UNITED STATES
SECURITIES AND EXCHANGE COMMISSION
Washington, D.C. 20549
FORM 10-K
(Mark One)
| [ ü ] | ANNUAL REPORT PURSUANT TO SECTION 13 OR 15(d) OF THE SECURITIES EXCHANGE ACT OF 1934 |
For the fiscal year ended December 31, 2009
or
| [ ] | TRANSITION REPORT PURSUANT TO SECTION 13 OR 15(d) OF THE SECURITIES EXCHANGE ACT OF 1934 |
For the transition period from to
Commission file number:
1-6523
Exact name of registrant as specified in its charter:
Bank of America Corporation
State or other jurisdiction of incorporation or organization:
Delaware
IRS Employer Identification No.:
56-0906609
Address of principal executive offices:
Bank of America Corporate Center
100 N. Tryon Street
Charlotte, North Carolina 28255
Registrant's telephone number, including area code:
(704) 386-5681
SECURITIES REGISTERED PURSUANT TO SECTION 12(b) OF THE ACT:
Title of each class | Name of each exchange on which registered | |
Common Stock | New York Stock Exchange | |
| London Stock Exchange | ||
| Tokyo Stock Exchange | ||
Depositary Shares, each Representing a 1/1,000 th interest in a share of | ||
6.204% Non-Cumulative Preferred Stock, Series D | New York Stock Exchange | |
Depositary Shares, each Representing a 1/1,000 th interest in a share of Floating Rate Non-Cumulative Preferred Stock, Series E | New York Stock Exchange | |
Depositary Shares, each Representing a 1/1,000 th Interest in a Share of 8.20% Non-Cumulative Preferred Stock, Series H | New York Stock Exchange | |
Depositary Shares, each Representing a 1/1,000 th interest in a share of 6.625% Non-Cumulative Preferred Stock, Series I | New York Stock Exchange | |
Depositary Shares, each Representing a 1/1,000 th interest in a share of 7.25% Non-Cumulative Preferred Stock, Series J | New York Stock Exchange | |
7.25% Non-Cumulative Perpetual Convertible Preferred Stock, Series L | New York Stock Exchange | |
Depositary Shares, each representing a 1/1,200 th interest in a share of Bank of America Corporation Floating Rate Non-Cumulative Preferred Stock, Series 1 | New York Stock Exchange | |
Depositary Shares, each representing a 1/1,200 th interest in a share of Bank of America Corporation Floating Rate Non-Cumulative Preferred Stock, Series 2 | New York Stock Exchange | |
Depositary Shares, each representing a 1/1,200 th interest in a share of Bank of America Corporation 6.375% Non-Cumulative Preferred Stock, Series 3 | New York Stock Exchange | |
Depositary Shares, each representing a 1/1,200 th interest in a share of Bank of America Corporation Floating Rate Non-Cumulative Preferred Stock, Series 4 | New York Stock Exchange | |
Depositary Shares, each representing a 1/1,200 th interest in a share of Bank of America Corporation Floating Rate Non-Cumulative Preferred Stock, Series 5 | New York Stock Exchange | |
Depositary Shares, each representing a 1/40 th interest in a share of Bank of America Corporation 6.70% Non-cumulative Perpetual Preferred Stock, Series 6 | New York Stock Exchange | |
Depositary Shares, each representing a 1/40 th interest in a share of Bank of America Corporation 6.25% Non-cumulative Perpetual Preferred Stock, Series 7 | New York Stock Exchange | |
Depositary Shares, each representing a 1/1,200 th interest in a share of Bank of America Corporation 8.625% Non-Cumulative Preferred Stock, Series 8 | New York Stock Exchange | |
6.75% Trust Preferred Securities of Countrywide Capital IV (and the guarantees related thereto) | New York Stock Exchange | |
7.00% Capital Securities of Countrywide Capital V (and the guarantees related thereto) | New York Stock Exchange | |
Capital Securities of BAC Capital Trust I (and the guarantee related thereto) | New York Stock Exchange | |
Capital Securities of BAC Capital Trust II (and the guarantee related thereto) | New York Stock Exchange | |
Capital Securities of BAC Capital Trust III (and the guarantee related thereto) | New York Stock Exchange | |
5 7 / 8 % Capital Securities of BAC Capital Trust IV (and the guarantee related thereto) | New York Stock Exchange | |
6% Capital Securities of BAC Capital Trust V (and the guarantee related thereto) | New York Stock Exchange | |
6% Capital Securities of BAC Capital Trust VIII (and the guarantee related thereto) | New York Stock Exchange | |
6 ¼% Capital Securities of BAC Capital Trust X (and the guarantee related thereto) | New York Stock Exchange | |
6 7 / 8 % Capital Securities of BAC Capital Trust XII (and the guarantee related thereto) | New York Stock Exchange | |
Floating Rate Preferred Hybrid Income Term Securities of BAC Capital Trust XIII (and the guarantee related thereto) | New York Stock Exchange | |
5.63% Fixed to Floating Rate Preferred Hybrid Income Term Securities of BAC Capital Trust XIV (and the guarantee related thereto) | New York Stock Exchange |
Title of each class | Name of each exchange on which registered | |
Minimum Return Index EAGLES SM , due June 1, 2010, Linked to the Nasdaq-100 Index ® | NYSE Amex | |
Minimum Return Index EAGLES ® , due June 28, 2010, Linked to the S&P 500 ® Index | NYSE Amex | |
Minimum Return – Return Linked Notes, due June 24, 2010, Linked to the Nikkei 225 Index | NYSE Amex | |
Minimum Return Basket EAGLES SM , due August 2, 2010, Linked to a Basket of Energy Stocks | NYSE Amex | |
Minimum Return Index EAGLES ® , due October 29, 2010, Linked to the Nasdaq-100 Index ® | NYSE Amex | |
1.50% Index CYCLES TM , due November 26, 2010, Linked to the S&P 500 ® Index | NYSE Amex | |
1.00% Index CYCLES TM , due December 28, 2010, Linked to the S&P MidCap 400 Index | NYSE Amex | |
Return Linked Notes due June 28, 2010, Linked to the Nikkei 225 Index | NYSE Amex | |
1.00% Index CYCLES TM , due January 28, 2011, Linked to a Basket of Health Care Stocks | NYSE Amex | |
Minimum Return Index EAGLES ® , due January 28, 2011, Linked to the Russell 2000 ® Index | NYSE Amex | |
1.00% Basket CYCLES TM , due May 27, 2010, Linked to a "70/30" Basket of Four Indices and an Exchange Traded Fund | NYSE Amex | |
Minimum Return Index EAGLES ® , due June 25, 2010, Linked to the Dow Jones Industrial Average SM | NYSE Amex | |
1.50% Basket CYCLES TM , due July 29, 2011, Linked to an "80/20" Basket of Four Indices and an Exchange Traded Fund | NYSE Amex | |
1.25% Index CYCLES TM , due August 25, 2010, Linked to the Dow Jones Industrial Average SM | NYSE Amex | |
1.25% Basket CYCLES TM , due September 27, 2011, Linked to a Basket of Four Indices | NYSE Amex | |
Minimum Return Basket EAGLES SM , due September 29, 2010, Linked to a Basket of Energy Stocks | NYSE Amex | |
Minimum Return Index EAGLES ® , due October 29, 2010, Linked to the S&P 500 ® Index | NYSE Amex | |
Minimum Return Index EAGLES ® , due November 23, 2010, Linked to the Nasdaq-100 Index ® | NYSE Amex | |
Minimum Return Index EAGLES ® , due November 24, 2010, Linked to the CBOE China Index | NYSE Amex | |
1.25% Basket CYCLES TM , due December 27, 2010, Linked to a "70/30" Basket of Four Indices and an Exchange Traded Fund | NYSE Amex | |
1.50% Index CYCLES TM , due December 28, 2011, Linked to a Basket of Health Care Stocks | NYSE Amex | |
6 1 / 2 % Subordinated InterNotes SM , due 2032 | New York Stock Exchange | |
5 1 / 2 % Subordinated InterNotes SM , due 2033 | New York Stock Exchange | |
5 7 / 8 % Subordinated InterNotes SM , due 2033 | New York Stock Exchange | |
6% Subordinated InterNotes SM , due 2034 | New York Stock Exchange | |
Minimum Return Index EAGLES ® , due March 25, 2011, Linked to the Dow Jones Industrial Average SM | NYSE Amex | |
1.625% Index CYCLES TM , due March 23, 2010, Linked to the Nikkei 225 Index | NYSE Amex | |
1.75% Index CYCLES TM , due April 28, 2011, Linked to the S&P 500 ® Index | NYSE Amex | |
Return Linked Notes, due August 26, 2010, Linked to a Basket of Three Indices | NYSE Amex | |
Return Linked Notes, due June 27, 2011, Linked to an "80/20" Basket of Four Indices and an Exchange Traded Fund | NYSE Amex | |
Minimum Return Index EAGLES ® , due July 29, 2010, Linked to the S&P 500 ® Index | NYSE Amex | |
Return Linked Notes, due January 28, 2011, Linked to a Basket of Two Indices | NYSE Amex | |
Minimum Return Index EAGLES ® , due August 26, 2010, Linked to the Dow Jones Industrial Average SM | NYSE Amex | |
Return Linked Notes, due August 25, 2011, Linked to the Dow Jones EURO STOXX 50 ® Index | NYSE Amex | |
Minimum Return Index EAGLES ® , due October 3, 2011, Linked to the S&P 500 ® Index | NYSE Amex | |
Minimum Return Index EAGLES ® , due October 28, 2011, Linked to the AMEX Biotechnology Index | NYSE Amex | |
Return Linked Notes, due October 27, 2011, Linked to a Basket of Three Indices | NYSE Amex | |
Return Linked Notes, due November 22, 2010, Linked to a Basket of Two Indices | NYSE Amex | |
Minimum Return Index EAGLES ® , due November 23, 2011, Linked to a Basket of Five Indices | NYSE Amex | |
Minimum Return Index EAGLES ® , due December 27, 2011, Linked to the Dow Jones Industrial Average SM | NYSE Amex | |
0.25% Senior Notes Optionally Exchangeable Into a Basket of Three Common Stocks, due February 2012 | NYSE Amex | |
Return Linked Notes, due December 29, 2011 Linked to a Basket of Three Indices | NYSE Amex | |
Bear Market Strategic Accelerated Redemption Securities ® , Linked to the iShares ® Dow Jones U.S. Real Estate Index Fund, due August 3, 2010 | NYSE Arca, Inc. | |
Accelerated Return Notes SM , Linked to the S&P 500 ® Index, due April 5, 2010 | NYSE Arca, Inc. | |
Strategic Accelerated Redemption Securities ® , Linked to the S&P 500 ® Index, due February 1, 2011 | NYSE Arca, Inc. | |
Strategic Accelerated Redemption Securities ® Linked to the S&P 500 ® Index, due January 11, 2012 | NYSE Arca, Inc. | |
Market-Linked Step Up Notes Linked to the S&P 500 ® Index, due December 23, 2011 | NYSE Arca, Inc. | |
Strategic Accelerated Redemption Securities ® Linked to the S&P 500 ® Index, due December 5, 2011 | NYSE Arca, Inc. | |
Market-Linked Step Up Notes Linked to the S&P 500 ® Index, due November 26, 2012 | NYSE Arca, Inc. | |
Market Index Target-Term Securities ® Linked to the Dow Jones Industrial Average SM , due December 2, 2014 | NYSE Arca, Inc. | |
Market-Linked Step Up Notes Linked to the S&P 500 ® Index, due November 28, 2011 | NYSE Arca, Inc. | |
Market-Linked Step Up Notes Linked to the S&P 500 ® Index, due October 28, 2011 | NYSE Arca, Inc. | |
Market-Linked Step Up Notes Linked to the Russell 2000 ® Index, due October 28, 2011 | NYSE Arca, Inc. | |
Notes Linked to the S&P 500 ® Index, due October 4, 2011 | NYSE Arca, Inc. | |
Market Index Target-Term Securities ® , Linked to the S&P 500 ® Index, due September 27, 2013 | NYSE Arca, Inc. | |
Accelerated Return Notes ® Linked to the S&P 500 ® Index, due October 29, 2010 | NYSE Arca, Inc. | |
Leveraged Index Return Notes ® , Linked to the S&P 500 ® Index, due July 27, 2012 | NYSE Arca, Inc. | |
Strategic Accelerated Redemption Securities ® , Linked to the S&P 500 ® Index, due August 2, 2011 | NYSE Arca, Inc. | |
Market Index Target-Term Securities ® , Linked to the S&P 500 ® Index, due July 26, 2013 | NYSE Arca, Inc. | |
Leveraged index Return Notes ® , Linked to the S&P 500 ® Index, due June 29, 2012 | NYSE Arca, Inc. | |
Strategic Accelerated Redemption Securities ® , Linked to the iShares ® FTSE/Xinhua 25 Index Fund, due June 1, 2011 | NYSE Arca, Inc. | |
Accelerated Return Notes ® , Linked to the S&P 500 ® Index, due July 30, 2010 | NYSE Arca, Inc. | |
Leveraged Index Return Notes ® , Linked to the S&P 500 ® Index, due June 1, 2012 | NYSE Arca, Inc. | |
Strategic Accelerated Redemption Securities ® , Linked to the S&P 500 ® Index, due June 1, 2011 | NYSE Arca, Inc. | |
Market Index Target-Term Securities ® , Linked to the Dow Jones Industrial Average SM , due May 31, 2013 | NYSE Arca, Inc. | |
Capped Leveraged Index Return Notes ® , Linked to the S&P 500 ® Index, due November 29, 2010 | NYSE Arca, Inc. | |
Strategic Accelerated Redemption Securities ® , Linked to the SPDR ® Gold Trust, due May 3, 2011 | NYSE Arca, Inc. | |
Market Index Target-Term Securities ® , Linked to the S&P 500 ® Index, due April 25, 2014 | NYSE Arca, Inc. | |
Strategic Accelerated Redemption Securities ® , Linked to the S&P 500 ® Index, due April 5, 2011 | NYSE Arca, Inc. | |
Bear Market Strategic Accelerated Redemption Securities ® , Linked to the iShares ® Dow Jones U.S. Real Estate Index Fund, due September 30, 2010 | NYSE Arca, inc. | |
Market Index Target-Term Securities ® , Linked to the S&P 500 ® Index, due March 28, 2014 | NYSE Arca, Inc. | |
Capped Leveraged Index Return Notes ® , Linked to the S&P 500 ® Index, due August 27, 2010 | NYSE Arca, Inc. | |
Bear Market Strategic Accelerated Redemption Securities ® , Linked to the S&P Small Cap Regional Banks Index, due August 31, 2010 | NYSE Arca, Inc. | |
Strategic Accelerated Redemption Securities ® , Linked to the S&P 500 ® Index, due March 1, 2011 | NYSE Arca, Inc. | |
Market Index Target-Term Securities ® , Linked to the S&P 500 ® Index, due February 28, 2014 | NYSE Arca, Inc. | |
Accelerated Return Notes SM , Linked to the S&P 500 ® Index, due April 5, 2010 | NYSE Arca, Inc. | |
Strategic Accelerated Redemption Securities ® , Linked to the S&P 500 ® Index, due February 1, 2011 | NYSE Arca, Inc. | |
Bear Market Strategic Accelerated Redemption Securities ® , Linked to the iShares ® Dow Jones U.S. Real Estate Index Fund, due August 3, 2010 | NYSE Arca, Inc. |
Securities registered pursuant to Section 12(g) of the Act: None
Indicate by check mark if the registrant is a well-known seasoned issuer, as defined in Rule 405 of the Securities Act. Yes ü No
Indicate by check mark if the registrant is not required to file reports pursuant to Section 13 or Section 15(d) of the Act. Yes No ü
Indicate by check mark whether the registrant: (1) has filed all reports required to be filed by Section 13 or 15(d) of the Securities Exchange Act of 1934 during the preceding 12 months (or for such shorter period that the registrant was required to file such reports), and (2) has been subject to such filing requirements for the past 90 days. Yes ü No
Indicate by check mark whether the registrant has submitted electronically and posted on its corporate Web site, if any, every Interactive Data File required to be submitted and posted pursuant to Rule 405 of Regulation S-T during the preceding 12 months (or for such shorter period that the registrant was required to submit and post such files). Yes ü No
Indicate by check mark if disclosure of delinquent filers pursuant to Item 405 of Regulation S-K is not contained herein, and will not be contained, to the best of registrant's knowledge, in definitive proxy or information statements incorporated by reference in Part III of this Form 10-K or any amendment to this Form 10-K.
Indicate by check mark whether the registrant is a large accelerated filer, an accelerated filer, a non-accelerated filer, or a smaller reporting company. See the definitions of "large accelerated filer," "accelerated filer" and "smaller reporting company" in Rule 12b-2 of the Exchange Act.
| Large accelerated filer ü | Accelerated filer | Non-accelerated filer (do not check if a smaller reporting company) | Smaller reporting company |
Indicate by check mark whether the registrant is a shell company (as defined in Rule 12b-2 of the Act). Yes No ü
The aggregate market value of the registrant's common stock ("Common Stock") held by non-affiliates is approximately $114,282,338,121 (based on the June 30, 2009 closing price of Common Stock of $13.20 per share as reported on the New York Stock Exchange). As of February 24, 2010, there were 10,032,005,453 shares of Common Stock outstanding.
DOCUMENTS INCORPORATED BY REFERENCE
Document of the Registrant | Form 10-K Reference Locations | |
| Portions of the 2010 Proxy Statement | PART III |
Table of Contents |
| Bank of America Corporation and Subsidiaries |
| Part I | Page | |||||||||||
| Item 1. | Business | 1 | ||||||||||
| Item 1A. | Risk Factors | 5 | ||||||||||
| Item 1B. | Unresolved Staff Comments | 11 | ||||||||||
| Item 2. | Properties | 11 | ||||||||||
| Item 3. | Legal Proceedings | 11 | ||||||||||
| Item 4. | Submission of Matters To A Vote of Security Holders | 11 | ||||||||||
Executive Officers of The Registrant | 11 | |||||||||||
| Part II | ||||||||||||
| Item 5. | Market for Registrant's Common Equity, Related Stockholder Matters and Issuer Purchases of Equity Securities | 13 | ||||||||||
| Item 6. | Selected Financial Data | 13 | ||||||||||
| Item 7. | Management's Discussion and Analysis of Financial Condition and Results of Operations | 14 | ||||||||||
| Item 7A. | Quantitative and Qualitative Disclosures About Market Risk | 112 | ||||||||||
| Item 8. | Financial Statements and Supplementary Data | 112 | ||||||||||
| Item 9. | Changes in and Disagreements with Accountants on Accounting and Financial Disclosure | 203 | ||||||||||
| Item 9A. | Controls And Procedures | 203 | ||||||||||
| Item 9B. | Other Information | 203 | ||||||||||
| Part III | ||||||
| Item 10. | Directors, Executive Officers and Corporate Governance | 204 | ||||
| Item 11. | Executive Compensation | 204 | ||||
| Item 12. | Security Ownership of Certain Beneficial Owners and Management and Related Stockholder Matters | 204 | ||||
| Item 13. | Certain Relationships and Related Transactions, and Director Independence | 205 | ||||
| Item 14. | Principal Accounting Fees and Services | 205 | ||||
| Part IV | ||||||
| Item 15. | Exhibits, Financial Statement Schedules | 206 | ||||
Part I |
| Bank of America Corporation and Subsidiaries |
Item 1. Business
General
Bank of America Corporation (together, with its consolidated subsidiaries, Bank of America, the Corporation, our company, we or us) is a Delaware corporation, a bank holding company and a financial holding company under the Gramm-Leach-Bliley Act. Our principal executive offices are located in the Bank of America Corporate Center, Charlotte, North Carolina 28255.
Bank of America is one of the world's largest financial institutions, serving individual consumers, small- and middle-market businesses, large corporations and governments with a full range of banking, investing, asset management and other financial and risk management products and services. Through our banking subsidiaries (the Banks) and various nonbanking subsidiaries throughout the United States and in selected international markets, we provide a diversified range of banking and nonbanking financial services and products through six business segments: Deposits, Global Card Services, Home Loans & Insurance, Global Banking, Global Markets , Global Wealth & Investment Management (GWIM) , with the remaining operations recorded in All Other .
We are a global franchise, serving customers and clients around the world with operations in all 50 U.S. states, the District of Columbia and more than 40 foreign countries. As of December 31, 2009, the Bank of America retail banking footprint includes approximately 80 percent of the U.S. population, and in the United States, we serve approximately 59 million consumer and small business relationships with approximately 6,000 banking centers, more than 18,000 ATMs, nationwide call centers, and the leading online and mobile banking platforms. We have banking centers in 12 of the 15 fastest growing states and have leadership positions in eight of those states. We offer industry-leading support to approximately four million small business owners. We have the No. 1 U.S. retail deposits market share and are the No. 1 issuer of debit cards in the United States. We have the No. 2 market share in credit card products in the United States and we are the No. 1 credit card lender in Europe. We have approximately 8,900 mortgage loan officers and are the No. 1 mortgage servicer and No. 2 mortgage originator in the United States.
In addition, as of December 31, 2009, our commercial and corporate clients include 98 percent of the U.S. Fortune 1,000 and 82 percent of the Global Fortune 500 and we serve more than 11,000 issuer clients and 3,500 institutional investors. We are the No. 1 treasury services provider in the United States and a leading provider globally. With our acquisition of Merrill Lynch & Co., Inc. (Merrill Lynch) in 2009, we significantly enhanced our wealth management business and are a global leader in corporate and investment banking and trading across a broad range of asset classes serving corporations, governments, institutions and individuals around the world. We have one of the largest wealth management businesses in the world with approximately 15,000 financial advisors and more than $2.1 trillion in net client assets, and we are a leading wealth manager for high-net-worth and ultra high net-worth clients. In addition, we have an economic ownership of approximately 34 percent in BlackRock, Inc., a publicly traded investment management company.
Additional information relating to our businesses and our subsidiaries is included in the information set forth in pages 27 through 42 of Item 7,
Management's Discussion and Analysis of Financial Condition and Results of Operations (MD&A) and Note 23 – Business Segment Information to the Notes to the Consolidated Financial Statements in Item 8, Financial Statements and Supplementary Data (Consolidated Financial Statements).
Bank of America's website is www.bankofamerica.com. Our Annual Reports on Form 10-K, Quarterly Reports on Form 10-Q, Current Reports on Form 8-K and amendments to those reports filed or furnished pursuant to Section 13(a) or 15(d) of the Securities Exchange Act of 1934 are available on our website at http://investor.bankofamerica.com under the heading SEC Filings as soon as reasonably practicable after we electronically file such material with, or furnish it to, the Securities and Exchange Commission (SEC). In addition, we make available on http://investor.bankofamerica.com under the heading Corporate Governance: (i) our Code of Ethics (including our insider trading policy); (ii) our Corporate Governance Guidelines; and (iii) the charter of each committee of our Board of Directors (the Board) (by clicking on the committee names under the Committee Composition link), and we also intend to disclose any amendments to our Code of Ethics, or waivers of our Code of Ethics on behalf of our Chief Executive Officer, Chief Financial Officer or Chief Accounting Officer, on our website. All of these corporate governance materials are also available free of charge in print to stockholders who request them in writing to: Bank of America Corporation, Attention: Shareholder Relations Department, 101 South Tryon Street, NC1-002-29-01, Charlotte, North Carolina 28255.
Competition
We operate in a highly competitive environment. Our competitors include banks, thrifts, credit unions, investment banking firms, investment advisory firms, brokerage firms, investment companies, insurance companies, mortgage banking companies, credit card issuers, mutual fund companies and e-commerce and other internet-based companies in addition to those competitors discussed more specifically below. We compete with some of these competitors globally and with others on a regional or product basis. Competition is based on a number of factors including, among others, customer service, quality and range of products and services offered, price, reputation, interest rates on loans and deposits, lending limits and customer convenience. Our ability to continue to compete effectively also depends in large part on our ability to attract new employees and retain and motivate our existing employees, while managing compensation and other costs.
More specifically, our consumer banking business competes with banks, thrifts, credit unions, finance companies and other nonbank organizations offering financial services. Our commercial and large corporate lending businesses compete with local, regional and international banks and nonbank financial organizations. In the investment banking, wealth management, investment advisory and brokerage businesses, our nonbanking subsidiaries compete with U.S. and international commercial banking and investment banking firms, investment advisory firms, brokerage firms, investment companies, mutual funds, hedge funds, private equity funds, trust banks, multi-family offices, advice boutiques and other organizations offering similar services and other investment alternatives available to investors. Our mortgage banking business competes with
| Bank of America 2009 | 1 |
banks, thrifts, mortgage brokers and other nonbank organizations offering mortgage banking and mortgage related services. Our card business competes in the United States and internationally with banks, consumer finance companies and retail stores with private label credit and debit cards.
We also compete actively for funds. A primary source of funds for the Banks is deposits, and competition for deposits includes other deposit-taking organizations, such as banks, thrifts and credit unions, as well as money market mutual funds. Investment banks and other entities that became bank holding companies and financial holding companies as a result of the recent financial crisis are also competitors for deposits. In addition, we compete for funding in the domestic and international short-term and long-term debt securities capital markets.
Over time, certain sectors of the financial services industry have become more concentrated, as institutions involved in a broad range of financial services have been acquired by or merged into other firms or have declared bankruptcy. This trend continued in 2008 and 2009 as the financial crisis caused additional mergers and asset acquisitions among industry participants. This trend toward consolidation has significantly increased the capital base and geographic reach of some of our competitors. This trend has also hastened the globalization of the securities markets. These developments could result in our remaining competitors gaining greater capital and other resources or having stronger local presences and longer operating histories outside the United States.
Our ability to expand certain of our banking operations in additional U.S. states remains subject to various federal and state laws. See "Government Supervision and Regulation – General" below for a more detailed discussion of interstate banking and branching legislation and certain state legislation.
Employees
As of December 31, 2009, there were approximately 284,000 full-time equivalent employees with Bank of America. Of these employees, 75,800 were employed within Deposits , 24,900 were employed within Global Card Services , 52,800 were employed within Home Loans & Insurance , 22,900 were employed within Global Banking , 17,600 were employed within Global Markets and 40,400 were employed within GWIM . The remainder were employed elsewhere within our company including various staff and support functions.
None of our domestic employees is subject to a collective bargaining agreement. Management considers our employee relations to be good.
Acquisition and Disposition Activity
As part of our operations, we regularly evaluate the potential acquisition of, and hold discussions with, various financial institutions and other businesses of a type eligible for financial holding company ownership or control. In addition, we regularly analyze the values of, and submit bids for, the acquisition of customer-based funds and other liabilities and assets of such financial institutions and other businesses. We also regularly consider the potential disposition of certain of our assets, branches, subsidiaries or lines of businesses. As a general rule, we publicly announce any material acquisitions or dispositions when a definitive agreement has been reached.
On January 1, 2009, we completed the acquisition of Merrill Lynch. Additional information on our acquisitions and mergers is included in Note 2 – Merger and Restructuring Activity to the Consolidated Financial Statements which is incorporated herein by reference.
Government Supervision and Regulation
The following discussion describes, among other things, elements of an extensive regulatory framework applicable to bank holding companies, financial holding companies and banks and specific information about Bank of America. U.S. federal regulation of banks, bank holding companies and financial holding companies is intended primarily for the protection of depositors and the Deposit Insurance Fund (DIF) rather than for the protection of stockholders and creditors. For additional information about recent regulatory programs, initiatives and legislation that impact us, see "Regulatory Initiatives" in the MD&A.
General
As a registered bank holding company and financial holding company, Bank of America Corporation is subject to the supervision of, and regular inspection by, the Board of Governors of the Federal Reserve System (Federal Reserve Board). The Banks are organized as national banking associations, which are subject to regulation, supervision and examination by the Office of the Comptroller of the Currency (Comptroller or OCC), the Federal Deposit Insurance Corporation (FDIC), the Federal Reserve Board and other federal and state regulatory agencies. In addition to banking laws, regulations and regulatory agencies, we are subject to various other laws and regulations and supervision and examination by other regulatory agencies, all of which directly or indirectly affect our operations and management and our ability to make distributions to stockholders. For example, our U.S. broker dealer subsidiaries are subject to regulation by and supervision of the SEC, the New York Stock Exchange and the Financial Industry Regulatory Authority (FINRA); our commodities businesses in the United States are subject to regulation by and supervision of the Commodities Futures Trading Commission (CFTC); and our insurance activities are subject to licensing and regulation by state insurance regulatory agencies.
Our non-U.S. businesses are also subject to extensive regulation by various non-U.S. regulators, including governments, securities exchanges, central banks and other regulatory bodies, in the jurisdictions in which the businesses operate. Our financial services operations in the United Kingdom are subject to regulation by and supervision of the Financial Services Authority (FSA).
A U.S. financial holding company, and the companies under its control, are permitted to engage in activities considered "financial in nature" as defined by the Gramm-Leach-Bliley Act and Federal Reserve Board interpretations (including, without limitation, insurance and securities activities), and therefore may engage in a broader range of activities than permitted for bank holding companies and their subsidiaries. Unless otherwise limited by the Federal Reserve Board, a financial holding company may engage directly or indirectly in activities considered financial in nature, either de novo or by acquisition, provided the financial holding company gives the Federal Reserve Board after-the-fact notice of the new activities. In addition, if the Federal Reserve Board finds that any of the Banks is not well capitalized or well managed, we would be required to enter into an agreement with the Federal Reserve Board to comply with all applicable capital and management requirements and which may contain additional limitations or conditions relating to our activities. The Gramm-Leach-Bliley Act also permits national banks, such as the Banks, to engage in activities considered financial in nature through a financial subsidiary, subject to certain conditions and limitations and with the approval of the OCC.
| 2 | Bank of America 2009 |
U.S. bank holding companies (including bank holding companies that also are financial holding companies) also are required to obtain the prior approval of the Federal Reserve Board before acquiring more than five percent of any class of voting stock of any non-affiliated bank. Pursuant to the Riegle-Neal Interstate Banking and Branching Efficiency Act of 1994 (Interstate Banking and Branching Act), a bank holding company may acquire banks located in states other than its home state without regard to the permissibility of such acquisitions under state law, but subject to any state requirement that the bank has been organized and operating for a minimum period of time, not to exceed five years, and the requirement that the bank holding company, after the proposed acquisition, controls no more than 10 percent of the total amount of deposits of insured depository institutions in the United States and no more than 30 percent or such lesser or greater amount set by state law of such deposits in that state. At December 31, 2009, we controlled approximately 12 percent of the total amount of deposits of insured institutions in the United States. Subject to certain restrictions, the Interstate Banking and Branching Act also authorizes banks to merge across state lines to create interstate banks. The Interstate Banking and Branching Act also permits a bank to open new branches in a state in which it does not already have banking operations if such state enacts a law permitting de novo branching.
Changes in Regulations
Proposals to change the laws and regulations governing the banking and financial services industries are frequently introduced in Congress, in the state legislatures and before the various bank regulatory agencies as well as by lawmakers and regulators in jurisdictions outside the United States where we operate. For example, in 2009, the U.S. Department of the Treasury (U.S. Treasury), the FDIC and the Federal Reserve Board developed programs and facilities designed to support the banking and financial services industries during the financial crisis. Congress and the U.S. government have continued to evaluate and develop legislation, programs and initiatives designed to, among other things, stabilize the financial and housing markets, stimulate the economy, including the U.S. government's foreclosure prevention program, and prevent future financial crises by further regulating the financial services industry. As a result of the financial crisis and challenging economic environment, we expect additional changes to be proposed and continued legislative and regulatory scrutiny of the financial services industry. The final form of any proposed programs or initiatives or related legislation, the likelihood and timing of any other future proposals or legislation, and the impact they might have on us cannot be determined at this time. For additional information regarding proposed regulatory and legislative initiatives, see "Executive Summary – Regulatory Overview" in the MD&A.
Capital and Operational Requirements
The Federal Reserve Board, the OCC and the FDIC have issued substantially similar risk-based and leverage capital guidelines applicable to U.S. banking organizations. In addition, these regulatory agencies may from time to time require that a banking organization maintain capital above the minimum levels, whether because of its financial condition or actual or anticipated growth. The Federal Reserve Board risk-based guidelines define a three-tier capital framework. Tier 1 capital includes common shareholders' equity, trust preferred securities, noncontrolling interests, qualifying preferred stock and any Common Equivalent Securities (CES), less goodwill and other adjustments. Tier 2 capital consists of preferred stock not qualifying as Tier 1 capital, mandatorily convertible debt, limited amounts of subordinated debt, other qualifying term debt, the allowance for credit losses up to 1.25 percent of risk-weighted assets and other adjustments. Tier 3 capital includes subordinated debt that is
unsecured, fully paid, has an original maturity of at least two years, is not redeemable before maturity without prior approval by the Federal Reserve Board and includes a lock-in clause precluding payment of either interest or principal if the payment would cause the issuing bank's risk-based capital ratio to fall or remain below the required minimum. The sum of Tier 1 and Tier 2 capital less investments in unconsolidated subsidiaries represents our qualifying total capital. Risk-based capital ratios are calculated by dividing Tier 1 and total capital by risk-weighted assets. Assets and off-balance sheet exposures are assigned to one of four categories of risk-weights, based primarily on relative credit risk. The minimum Tier 1 capital ratio is four percent and the minimum total capital ratio is eight percent. Our Tier 1 and total risk-based capital ratios under these guidelines at December 31, 2009 were 10.40 percent and 14.66 percent. At December 31, 2009, we had no subordinated debt that qualified as Tier 3 capital. While not an explicit requirement of law or regulation, bank regulatory agencies have stated that they expect common capital to be the primary component of a financial holding company's Tier 1 capital and that financial holding companies should maintain a Tier 1 common capital ratio of at least 4%. The Tier 1 common capital ratio is determined by dividing Tier 1 common capital by risk weighted assets. We calculate Tier 1 common capital as Tier 1 capital, which includes CES, less preferred stock, trust preferred securities, hybrid securities and noncontrolling interest. As of December 31, 2009, our Tier 1 common capital ratio was 7.81 percent.
The leverage ratio is determined by dividing Tier 1 capital by adjusted quarterly average total assets, after certain adjustments. Well-capitalized bank holding companies must have a minimum Tier 1 leverage ratio of three percent and not be subject to a Federal Reserve Board directive to maintain higher capital levels. Our leverage ratio at December 31, 2009 was 6.91 percent, which exceeded our leverage ratio requirement.
The Federal Deposit Insurance Corporation Improvement Act of 1991 (FDICIA), among other things, identifies five capital categories for insured depository institutions (well capitalized, adequately capitalized, undercapitalized, significantly undercapitalized and critically undercapitalized) and requires the respective federal regulatory agencies to implement systems for "prompt corrective action" for insured depository institutions that do not meet minimum capital requirements within such categories. FDICIA imposes progressively more restrictive constraints on operations, management and capital distributions, depending on the category in which an institution is classified. Failure to meet the capital guidelines could also subject a banking institution to capital-raising requirements. An "undercapitalized" bank must develop a capital restoration plan and its parent holding company must guarantee that bank's compliance with the plan. The liability of the parent holding company under any such guarantee is limited to the lesser of five percent of the bank's assets at the time it became "undercapitalized" or the amount needed to comply with the plan. Furthermore, in the event of the bankruptcy of the parent holding company, such guarantee would take priority over the parent's general unsecured creditors. In addition, FDICIA requires the various regulatory agencies to prescribe certain non-capital standards for safety and soundness relating generally to operations and management, asset quality and executive compensation, and permits regulatory action against a financial institution that does not meet such standards.
The various regulatory agencies have adopted substantially similar regulations that define the five capital categories identified by FDICIA, using the total risk-based capital, Tier 1 risk-based capital and leverage capital ratios as the relevant capital measures. Such regulations establish various degrees of corrective action to be taken when an institution is considered undercapitalized. Under the regulations, a "well capitalized" institution must have a Tier 1 risk-based capital ratio of at least six percent, a total risk-based capital ratio of at least ten percent and a leverage
| Bank of America 2009 | 3 |
ratio of at least five percent and not be subject to a capital directive order. Under these guidelines, each of the Banks was considered well capitalized as of December 31, 2009.
Regulators also must take into consideration: (a) concentrations of credit risk; (b) interest rate risk; and (c) risks from non-traditional activities, as well as an institution's ability to manage those risks, when determining the adequacy of an institution's capital. This evaluation is made as a part of the institution's regular safety and soundness examination. In addition, Bank of America Corporation, and any Bank with significant trading activity, must incorporate a measure for market risk in their regulatory capital calculations.
In addition, in June 2004, the Basel Committee on Banking Supervision published Basel II, which is designed to address credit risk, market risk and operational risk in the international banking markets. In December 2007, U.S. banking regulators published Basel II final rules which require us and certain of our U.S. Banks to implement Basel II. In December 2009, the Basel Committee on Banking Supervision released consultative documents on both capital and liquidity. Additionally, U.S. banking regulators continue to refine market risk requirements, which also have a regulatory capital impact. Revised requirements have not been issued but are expected in 2010. For additional information regarding these regulatory initiatives and proposals, see "Executive Summary – Regulatory Overview" in the MD&A and Note 16 – Regulatory Requirements and Restrictions to the Consolidated Financial Statements.
Distributions
Our funds for cash distributions to our stockholders are derived from a variety of sources, including cash and temporary investments. The primary source of such funds, and funds used to pay principal and interest on our indebtedness, is dividends received from the Banks. Each of the Banks is subject to various regulatory policies and requirements relating to the payment of dividends, including requirements to maintain capital above regulatory minimums. The appropriate federal regulatory authority is authorized to determine under certain circumstances relating to the financial condition of a bank or bank holding company that the payment of dividends would be an unsafe or unsound practice and to prohibit payment thereof.
In addition, the ability of Bank of America Corporation and the Banks to pay dividends may be affected by the various minimum capital requirements and the capital and non-capital standards established under FDICIA, as described above. The right of Bank of America Corporation, our stockholders and our creditors to participate in any distribution of the assets or earnings of our subsidiaries is further subject to the prior claims of creditors of the respective subsidiaries.
For additional information regarding the requirements relating to the payment of dividends, including the minimum capital requirements, see Note 15 – Shareholders' Equity and Earnings Per Common Share and Note 16 – Regulatory Requirements and Restrictions to the Consolidated Financial Statements.
Source of Strength
According to Federal Reserve Board policy, bank holding companies are expected to act as a source of financial strength to each subsidiary bank and to commit resources to support each such subsidiary. This support may be required at times when a bank holding company may not be able to provide such support. Similarly, under the cross-guarantee provisions of the Federal Deposit Insurance Act, in the event of a loss suffered or anticipated by the FDIC–either as a result of default of a banking subsidiary or related to FDIC assistance provided to a subsidiary in danger of default–the other Banks may be assessed for the FDIC's loss, subject to certain exceptions.
Deposit Insurance
Deposits placed at the U.S. Banks are insured by the FDIC subject to limits and conditions of applicable law and the FDIC's regulations. In 2009, FDIC insurance coverage limits were temporarily increased from $100,000 to $250,000 per customer until December 31, 2013. The FDIC administers the DIF, and all insured depository institutions are required to pay assessments to the FDIC that fund the DIF. Assessments are required if the ratio of the DIF to insured deposits in the United States falls below 1.15%. As a result of the ongoing instability in the economy and the failure of other U.S. depository institutions, the DIF ratio currently is below the required level and the FDIC has adopted a restoration plan that will result in substantially higher deposit insurance assessments for all depository institutions over the coming years. On December 30, 2009, the FDIC required all depository institutions to prepay deposit insurance assessments for the next three years in order to provide liquidity to the DIF. Deposit insurance assessment rates are subject to change by the FDIC and will be impacted by the overall economy and the stability of the banking industry as a whole.
Transactions with Affiliates
The U.S Banks are subject to restrictions under federal law that limit certain types of transactions between the Banks and their non-bank affiliates. In general, the U.S Banks are subject to quantitative and qualitative limits on extensions of credit, purchases of assets and certain other transactions involving Bank of America and its non-bank affiliates. Transactions between the U.S. Banks and their nonbank affiliates are required to be on arms length terms.
Privacy and Information Security
We are subject to many U.S., state and international laws and regulations governing requirements for maintaining policies and procedures to protect the non-public confidential information of our customers. The Gramm-Leach-Bliley Act requires the Banks to periodically disclose Bank of America's privacy policies and practices relating to sharing such information and enables retail customers to opt out of our ability to market to affiliates and non-affiliates under certain circumstances.
Additional Information
See also the following additional information which is incorporated herein by reference: Net Interest Income (under the captions "Financial Highlights – Net Interest Income" and "Supplemental Financial Data" in the MD&A and Tables I, II and XIII of the Statistical Tables); Securities (under the caption "Balance Sheet Analysis – Debt Securities" and "Market Risk Management – Interest Rate Risk Management for Nontrading Activities – Securities" in the MD&A and Note 1 – Summary of Significant Accounting Principles and Note 5 – Securities to the Consolidated Financial Statements); Outstanding Loans and Leases (under the caption "Balance Sheet Analysis – Loans and Leases" and "Credit Risk Management" in the MD&A, Table IV of the Statistical Tables, and Note 1 – Summary of Significant Accounting Principles and Note 6 – Outstanding Loans and Leases to the Consolidated Financial Statements); Deposits (under the caption "Balance Sheet Analysis – Deposits" and "Liquidity Risk and Capital Management – Funding and Liquidity Risk Management" in the MD&A and Note 11 – Deposits to the Consolidated Financial Statements); Short-term Borrowings (under the caption "Balance Sheet Analysis – Commercial Paper and Other Short-term Borrowings" and "Liquidity Risk and Capital Management – Funding and Liquidity Risk Management" in the MD&A, Table IX of the Statistical Tables and Note 12 – Short-term Borrowings and Note 13 – Long-term Debt to the Consolidated Financial Statements); Trading Account Assets and Liabilities (under the caption "Balance Sheet
| 4 | Bank of America 2009 |
Analysis – Federal Funds Sold and Securities Borrowed or Purchased Under Agreements to Resell", "Balance Sheet Analysis – Federal Funds Purchased and Securities Loaned or Sold Under Agreements to Repurchase" and "Market Risk Management – Trading Risk Management" in the MD&A and Note 3 – Trading Account Assets and Liabilities to the Consolidated Financial Statements); Market Risk Management (under the caption "Market Risk Management" in the MD&A); Liquidity Risk Management (under the caption "Liquidity Risk and Capital Management" in the MD&A); Compliance Risk Management (under the Caption "Compliance Risk Management" in the MD&A) and Operational Risk Management (under the caption "Operational Risk Management" in the MD&A); and Performance by Geographic Area (under Note 25 – Performance by Geographical Area to the Consolidated Financial Statements).
Item 1A. Risk Factors
In the course of conducting our business operations, we are exposed to a variety of risks that are inherent to the financial services industry. The following discusses some of the key inherent risk factors that could affect our business and operations, as well as other risk factors which are particularly relevant to us in the current period of significant economic and market disruption. Other factors besides those discussed below or elsewhere in this report could also adversely affect our business and operations, and these risk factors should not be considered a complete list of potential risks that may affect us.
Our businesses and earnings have been, and may continue to be, negatively affected by adverse b usiness and economic conditions. Our businesses and earnings are affected by general business and economic conditions in the United States and abroad. Given the concentration of our business activities in the United States, we are particularly exposed to downturns in the U.S. economy. For example, as a result of the challenging economic environment there continues to be a greater likelihood that an elevated number of our customers or counterparties will become delinquent on their loans or other obligations to us, which, in turn, may continue to result in a high level of charge-offs and provision for credit losses, all of which would adversely affect our earnings and capital levels.
General business and economic conditions that could affect us include the level and volatility of short-term and long-term interest rates, inflation, home prices, unemployment and under-employment levels, bankruptcies, household income, consumer spending, fluctuations in both debt and equity capital markets, liquidity of the global financial markets, the availability and cost of credit, investor confidence, and the strength of the U.S. economy and the other economies in which we operate. The deterioration of any of these conditions can adversely affect our consumer and commercial businesses and securities portfolios, as well as our earnings.
In 2009, weak economic conditions in the United States and abroad continued to adversely affect many of our businesses as well as our earnings. Dramatic declines in the housing market, with falling home prices and increasing foreclosures, and rising unemployment and underemployment, have further negatively impacted the demand for many of our products and the credit performance of our consumer and commercial portfolios. In addition, these conditions resulted in significant write-downs of asset values in several asset classes, notably mortgage-backed securities, commercial real estate and leveraged loans and exposure to monoline insurers. While there are early indications that the U.S. economy is stabilizing, the performance of our overall consumer and commercial portfolios may not significantly improve in the near future. A protracted continuation or worsening of these difficult business or economic conditions would likely exacerbate the adverse effects on us.
We have sold and continue to sell mortgage and other loans, including mortgage loans to third-party buyers and to the Federal National Mortgage
Association and Federal Home Loan Mortgage Corporation, under agreements that contain representations and warranties related to, among other things, the process for selecting the loans for inclusion in a sale and compliance with applicable criteria established by the buyer. We also have indirect exposure with respect to our mortgage and other loan sales as a result of credit protection provided by monoline financial guarantors. We have experienced and continue to experience increasing repurchase demands from and disputes with these buyers and monoline financial guarantors. In the event we are required to repurchase these mortgage and other loans or provide indemnification or other recourse, this could significantly increase our losses and thereby affect our future earnings.
Additional factors which could reduce our earnings include, among other things, lower residual net interest income as a result of a decision to deleverage our asset and liability management portfolio, higher than expected losses on our purchased impaired portfolio and compliance with governmental foreclosure prevention and loan modification initiatives.
We are a diversified financial services company providing consumer and commercial banking, credit card, mortgage, investment banking and capital markets trading services and investment services. Although we believe this diversity generally assists us in lessening the effect of a downturn in any of our businesses, it also means that our earnings could be adversely affected by the downturn to the extent not fully offset by any of our other businesses.
For a further discussion of the economic downturn and the resulting adverse impact on our credit performance, see "Executive Summary," "Financial Highlights" and "Credit Risk Management" in the MD&A.
Our increased c redit risk could result in higher credit losses and reduced earnings . When we loan money, commit to loan money or enter into a letter of credit or other contract with a counterparty, we incur credit risk, or the risk of losses if our borrowers do not repay their loans or our counterparties fail to perform according to the terms of their agreements. A number of our products expose us to credit risk, including loans, leases and lending commitments, derivatives, trading account assets and assets held-for-sale. As one of the nation's largest lenders, the credit quality of our consumer and commercial portfolios has a significant impact on our earnings. Current negative economic conditions are likely to continue to increase our credit exposure to third parties who may be more likely to default on their obligations to us. This increased credit risk could adversely affect our consumer credit card, home equity, consumer real estate and purchased impaired portfolios, among others, including causing increases in delinquencies and default rates, which we expect will continue to impact our charge-offs and provision for credit losses. In addition, this could also adversely affect our commercial loan portfolios where we have experienced increased losses, particularly in our commercial real estate and commercial domestic portfolios, reflecting broad based deteriorations across industries, property types and borrowers.
We estimate and establish reserves for credit risks and credit losses inherent in our lending activities (including unfunded lending commitments), excluding those measured at fair value under the fair value option. This process, which is critical to our financial results and condition, requires difficult, subjective and complex judgments, including forecasts of economic conditions and how our borrowers will react to those conditions. Our ability to assess future economic conditions or the creditworthiness of our customers is imperfect. The ability of our borrowers to repay their loans will likely be impacted by changes in economic conditions, which in turn could impact the accuracy of our forecasts. As with any such assessments, there is also the chance that we will fail to identify the proper factors or that we will fail to accurately estimate the impacts of factors that we identify. In addition, we may underestimate the credit losses in our loan portfolios and suffer unexpected losses if the models and approaches we use to establish reserves and make judgments in extending credit to our bor -
| Bank of America 2009 | 5 |
rowers and other counterparties become less predictive of future behaviors, valuations, assumptions or estimates.
In the ordinary course of our business, we also may be subject to a concentration of credit risk to a particular industry, country, counterparty, borrower or issuer. A deterioration in the financial condition or prospects of a particular industry or a failure or downgrade of, or default by, any particular entity or group of entities could negatively impact our businesses, perhaps materially, and the systems by which we set limits and monitor the level of our credit exposure to individual entities, industries and countries may not function as we have anticipated. While our activities expose us to many different industries and counterparties, we routinely execute a high volume of transactions with counterparties in the financial services industry, including brokers and dealers, commercial banks, investment funds and insurers. This has resulted in significant credit concentration with respect to this industry.
We have concentration of credit risk with respect to our consumer real estate, consumer credit card and commercial real estate portfolios, which represent a large percentage of our overall credit portfolio. The current financial crisis and economic slowdown has adversely affected these portfolios and further exposed us to this concentration of risk. Continued economic weakness or deterioration in real estate values or household incomes could result in materially higher credit losses.
For a further discussion of credit risk and our credit risk management policies and procedures, see "Credit Risk Management" in the MD&A and Note 1 – Summary of Significant Accounting Principles to the Consolidated Financial Statements.
Adverse changes in legislative and regulatory initiatives may significantly impact our earnings, operations, capital position and ability to pursue business opportunities. We are heavily regulated by regulatory agencies at the federal, state and international levels. As a result of the recent financial crisis and economic downturn, we have faced and expect to continue to face increased regulation and regulatory and political scrutiny, which creates significant uncertainty for us and the financial services industry in general.
In 2009, several major regulatory and legislative initiatives were adopted that will have significant future impacts on our businesses and financial results. For instance, in November 2009, the Federal Reserve Board issued amendments to Regulation E, which implements the Electronic Fund Transfer Act. The new rules have a compliance date of July 1, 2010. These amendments change, among other things, the way we and other banks may charge overdraft fees by limiting our ability to charge an overdraft fee for automated teller machine and one-time debit card transactions that overdraw a consumer's account, unless the consumer affirmatively consents to payment of overdrafts for those transactions. In connection with the amendments, we announced a program that allowed customers to opt out of overdraft services prior to the effective date of the amendments. In addition, in May 2009, the Credit Card Accountability Responsibility and Disclosure (CARD) Act of 2009 was enacted that provides for comprehensive reform related to credit card industry practices, including (1) significantly restricting banks' ability to change interest rates and assess fees to reflect individual consumer risk, (2) changing the way payments are applied and (3) requiring changes to consumer credit card disclosures. As a result, as we announced in October 2009, we did not increase interest rates on consumer credit accounts in response to provisions in the CARD Act prior to its effective date, unless a customer's account fell past due or was based on a variable interest rate. The most significant provisions of the CARD Act took effect in February 2010. Complying with the Regulation E amendments and the CARD Act requires us to invest significant management attention and resources to make the necessary disclosure and systems changes and will likely adversely affect our earnings.
Federal banking regulatory agencies may from time to time require that we change our required capital levels, including maintaining capital above
minimum levels. In January 2010, U.S. banking regulators issued a final rule regarding risk-based capital that eliminates the exclusion of certain asset- backed commercial paper (ABCP) program assets from risk-weighted assets. As a result of the new rules, as with all other consolidated variable interest entities, a banking organization is required to include the assets of a consolidated ABCP program in risk-weighted assets. The new rules would also eliminate the associated provision in the general risk-based capital rules that excludes from Tier 1 capital the noncontrolling interest in a consolidated ABCP program not included in a banking organization's risk-weighted assets. Beginning with reporting for the quarter ended March 31, 2010, we will be required to risk-weight the underlying assets of ABCP conduits as well as the contractual exposures (e.g. liquidity facilities).
In conjunction with the federal banking regulatory agencies' Supervisory Capital Assessment Program (SCAP) conducted in May 2009, we were required to increase Tier 1 common capital by approximately $33.9 billion. Additionally, in order to repay the $45 billion investment in our preferred stock previously made under the Trouble Asset Relief Program (TARP) by the U.S. Treasury, in December 2009, we raised approximately $19.3 billion in gross proceeds in an offering of CES and agreed to increase equity by $3 billion through asset sales by June 30, 2010 and raise up to approximately $1.7 billion through the issuance of restricted stock in lieu of a portion of incentive cash compensation to certain Bank of America associates as part of normal year-end incentive payments. For a further discussion of the CES, see "Executive Summary-TARP Repayment" in the MD&A.
In July 2009, the Basel Committee on Banking Supervision released a consultative document that would significantly increase the capital requirements for trading book activities if adopted as proposed. The proposal recommended implementation by December 31, 2010, but regulatory agencies are currently evaluating the proposed rulemaking and related impacts before establishing final rules. As a result, we cannot determine the implementation date or the final capital impact.
In December 2009, the Basel Committee on Banking Supervision released consultative documents on both capital and liquidity. If adopted as proposed, this could increase significantly the aggregate equity that bank holding companies are required to hold, by disqualifying certain instruments that previously have qualified as Tier 1 capital. The proposal currently includes a leverage ratio and increased liquidity and disclosure requirements. The leverage ratio could prove more restrictive than a risk-based measure while the liquidity requirement could result in banks holding greater levels of lower yielding instruments as a percentage of their assets. The proposal could also increase the capital charges imposed on certain assets, potentially making certain businesses more expensive to conduct. U.S. regulatory agencies have not opined on these proposals for U.S. implementation. We continue to assess the potential impact of this proposal. If we are required to increase our regulatory capital as a result of these or other regulatory or legislative initiatives, we may be required among other things to issue additional shares of common stock, which could dilute our existing stockholders.
As a result of the financial crisis, the financial services industry is facing the possibility of legislative and regulatory changes that would impose significant, adverse changes on its ability to serve both retail and wholesale customers. A proposal is currently being considered to levy a tax or fee on financial institutions with assets in excess of $50 billion to repay the costs of TARP, although the proposed tax would continue even after those costs are repaid. If enacted as proposed, the tax could significantly affect our earnings, either by increasing the costs of our liabilities or causing us to reduce our assets. It remains uncertain whether the tax will be enacted, to whom it would apply, or the amount of the tax we would be required to pay. It is also unclear the extent to which the costs of such a tax could be recouped through higher pricing.
In addition, various proposals for broad-based reform of the financial regulatory system are pending. A majority of these proposals would not
| 6 | Bank of America 2009 |
disrupt our core businesses, but a proposal could ultimately be adopted that adversely affects certain of our businesses. The proposals would require divestment of certain proprietary trading activities, or limit private equity investments. Other proposals, which include limiting the scope of an institution's derivatives activities, or forcing certain derivatives activities to be traded on exchanges, would diminish the demand for, and profitability of, certain businesses. Several other proposals would require issuers to retain unhedged interests in any asset that is securitized, potentially severely restricting the secondary market as a source of funding for consumer or commercial lending. There are also numerous proposals pending on how to resolve a failed systemically important institution. Following the passage of a bill in the U.S. House of Representatives and the possibility of similar provisions in a U.S. Senate bill, one ratings agency has placed us and other banks on negative outlook, and therefore adoption of such provisions may adversely affect our access to credit markets.
In addition, other countries, including the United Kingdom and France, have proposed and in some cases adopted certain reforms targeted at financial institutions, including, but not limited to, increased capital and liquidity requirements for local entities, including regulated U.K. subsidiaries of foreign bank holding companies and other financial institutions as well as branches of foreign banks located in the United Kingdom, the creation and production of recovery and resolutions plans (commonly referred to as living wills) by such entities, and a significant payroll tax on bank bonuses paid to employees over a certain threshold.
There can be no assurance as to whether or when any of the parts of these or other proposals will be enacted, and if enacted, what the final initiatives will consist of and what the ultimate impact on us will be.
We also may be required to pay significantly higher FDIC premiums because market developments have significantly depleted the DIF and reduced the ratio of reserves to insured deposits, which could increase our noninterest expense and reduce our earnings.
For more information on these and other legislative and regulatory initiatives, see "Regulatory Initiatives" in the MD&A.
In addition, Congress is currently considering reinstating income tax provisions whereby a majority of the income of certain foreign subsidiaries would not be subject to current U.S. income tax as a result of long-standing deferral provisions applicable to active finance income. These provisions, which in the past have expired and been extended, expired again for taxable years beginning on or after January 1, 2010. Absent an extension of these provisions, active financing income earned by our foreign subsidiaries during 2010 will generally be subject to a tax provision that considers the incremental U.S. income tax. The impact of the expiration of the provisions should they not be extended could be significant. The exact impact would depend upon the amount, composition and geographic mix of our future earnings. For more information on these provisions, see "Financial Highlights-Income Tax Expense" in the MD&A.
Compliance with current or future legislative and regulatory initiatives could require us to change certain of our business practices, impose significant additional costs on us, limit the products that we offer, result in a significant loss of revenue, limit our ability to pursue business opportunities in an efficient manner, require us to increase our regulatory capital, cause business disruptions, impact the value of assets that we hold or otherwise adversely affect our business, results of operations or financial condition. We have recently witnessed the introduction of an ever-increasing number of regulatory proposals that could substantially impact us and others in the financial services industry. The extent of changes imposed by, and frequency of adoption of, any regulatory initiatives could make it more difficult for us to comply in a timely manner, which could further limit our operations, increase compliance costs or divert management attention or other resources. The long-term impact of legislative and
regulatory initiatives on our business practices and revenues will depend upon the successful implementation of our strategies, consumer behavior, and competitors' responses to such initiatives, all of which are difficult to predict.
We could suffer losses as a result of the actions of or deterioration in the commercial s oundness of other financial services institutions and counter parties, including as a result of derivatives transactions . Our ability to engage in routine trading and funding transactions could be adversely affected by the actions and commercial soundness of other market participants. We have exposure to many different industries and counterparties, and we routinely execute transactions with counterparties in the financial services industry, including brokers and dealers, commercial banks, investment banks, mutual and hedge funds and other institutional clients. Financial services institutions and other counterparties are inter-related because of trading, funding, clearing or other relationships. As a result, defaults by, or even rumors or questions about, one or more financial services institutions, or the financial services industry generally, have led to market-wide liquidity problems and could lead to future losses or defaults by us or by other institutions. Many of these transactions expose us to credit risk in the event of default of a counterparty or client. In addition, our credit risk may be impacted when the collateral held by us cannot be realized upon or is liquidated at prices not sufficient to recover the full amount of the loan or derivatives exposure due us. There is no assurance that any such losses would not materially and adversely affect our results of operations.
We are party to a large number of derivatives transactions, including credit derivatives. Many of these derivative instruments are individually negotiated and non-standardized, which can make exiting, transferring or settling some positions difficult. Many credit derivatives require that we deliver to the counterparty the underlying security, loan or other obligation in order to receive payment. In a number of cases, we do not hold, and may not be able to obtain, the underlying security, loan or other obligation. This could cause us to forfeit the payments due to us under these contracts or result in settlement delays with the attendant credit and operational risk as well as increased costs to us.
Derivatives contracts and other transactions entered into with third parties are not always confirmed by the counterparties on a timely basis. While a transaction remains unconfirmed, we are subject to heightened credit and operational risk and in the event of default may find it more difficult to enforce the contract. In addition, as new and more complex derivatives products have been created, covering a wider array of underlying credit and other instruments, disputes about the terms of the underlying contracts may arise, which could impair our ability to effectively manage our risk exposures from these products and subject us to increased costs. For a further discussion of our derivatives exposure, see Note 4 -- Derivatives to the Consolidated Financial Statements.
Changes in accounting standards or inaccurate estimates or assumptions in the application of accounting policies could adversely affect our financial results . Our accounting policies and methods are fundamental to how we record and report our financial condition and results of operations. Some of these policies require use of estimates and assumptions that may affect the reported value of our assets or liabilities and financial results and are critical because they require management to make difficult, subjective and complex judgments about matters that are inherently uncertain.
Recently, the Financial Accounting Standards Board (FASB) and other regulators have adopted new guidance or rules relating to financial accounting or regulatory capital standards such as, among other things, the rules related to fair value accounting and new FASB guidance on consolidation of variable interest entities. In addition, accounting standard setters and those who interpret the accounting standards (such as the FASB, the SEC, banking regulators and our independent registered public accounting firm) may amend or even reverse their previous interpretations
| Bank of America 2009 | 7 |
or positions on how these standards should be applied. These changes can be hard to predict and can materially impact how we record and report our financial condition and results of operations. In some cases, we could be required to apply a new or revised standard retroactively, resulting in the Corporation restating prior period financial statements. For a further discussion of some of our critical accounting policies and standards and recent accounting changes, see "Regulatory Initiatives" and "Complex Accounting Estimates" in the MD&A and Note 1 – Summary of Significant Accounting Principles to the Consolidated Financial Statements.
Our ability to attract and retain customers and employees could be adversely affected to the extent our reputation is harmed . Our ability to attract and retain customers and employees could be adversely affected to the extent our reputation is damaged. Our actual or perceived failure to address various issues could give rise to reputational risk that could cause harm to us and our business prospects, including failure to properly address operational risks. These issues also include, but are not limited to, legal and regulatory requirements; privacy; properly maintaining customer and associate personal information; record keeping; money-laundering; sales and trading practices; ethical issues; appropriately addressing potential conflicts of interest; and the proper identification of the legal, reputational, credit, liquidity and market risks inherent in our products.
We are also facing enhanced public and regulatory scrutiny resulting from the financial crisis, including the U.S. Treasury's previous investment in our preferred stock, our acquisition of Merrill Lynch, modification of mortgages, volume of lending, compensation practices and the suitability of certain trading and investment businesses. Failure to appropriately address any of these issues could also give rise to additional regulatory restrictions, reputational harm and legal risks, which could among other consequences increase the size and number of litigation claims and damages asserted or subject us to enforcement actions, fines and penalties and cause us to incur related costs and expenses.
We face substantial potential legal liability and significant regulatory action, which could have materially adverse financial consequences or cause significant reputational harm to us . We face significant legal risks in our businesses, and the volume of claims and amount of damages and penalties claimed in litigation and regulatory proceedings against us and other financial institutions remain high and are increasing. Increased litigation costs, substantial legal liability or significant regulatory action against us could have material adverse financial effects or cause significant reputational harm to us, which in turn could seriously impact our business prospects. In addition, we face increased litigation risk and regulatory scrutiny as a result of the Merrill Lynch and Countrywide acquisitions. As a result of current economic conditions and the increased level of defaults over the prior couple of years, we have continued to experience increased litigation and other disputes with counterparties regarding relative rights and responsibilities. These litigation and regulatory matters and any related settlements could adversely impact our earnings and lead to volatility of our stock price. For a further discussion of litigation risks, see Note 14 – Commitments and Contingencies to the Consolidated Financial Statements.
Our l iquidity could be impaired by our inability to access the capital markets on favorable terms . Liquidity is essential to our businesses. Under normal business conditions, primary sources of funding for Bank of America Corporation include dividends received from banking and nonbanking subsidiaries and proceeds from the issuance of securities in the capital markets. The primary sources of funding for our banking subsidiaries include customer deposits and wholesale market-based funding. Our liquidity could be impaired by an inability to access the capital markets or by unforeseen outflows of cash, including deposits. This situation may arise due to circumstances that we may be unable to control, such as a general market disruption, negative views about the financial services industry generally, or an operational problem that affects third parties or us. Our
ability to raise certain types of funds as a result of the recent financial crisis has been and could continue to be adversely affected by conditions in the United States and international markets and economies. In 2009, global capital and credit markets continued to experience volatility and disruptions. As a result, we utilized several temporary U.S. government liquidity programs to enhance our liquidity position. Our ability to engage in securitization funding transactions on favorable terms could be adversely affected by continued or subsequent disruptions in the capital markets or other events, including actions by ratings agencies or deteriorating investor expectations.
Our credit ratings and the credit ratings of our securitization trusts are important to our liquidity. The ratings agencies regularly evaluate us and our securities, and their ratings of our long-term and short-term debt and other securities, including asset securitizations, are based on a number of factors, including our financial strength as well as factors not entirely within our control, including conditions affecting the financial services industry generally. During 2009, the ratings agencies took numerous actions to adjust our credit ratings and outlooks, many of which were negative. The ratings agencies have indicated that our credit ratings currently reflect their expectation that, if necessary, we would receive significant support from the U.S. government. In February 2010, Standard & Poor's affirmed our current credit ratings but revised the outlook to negative from stable, based on their belief that it is less certain whether the U.S. government would be willing to provide extraordinary support. In light of the difficulties in the financial services industry and the financial markets, there can be no assurance that we will maintain our current ratings. Failure to maintain those ratings could adversely affect our liquidity and competitive position by materially increasing our borrowing costs and significantly limiting our access to the funding or capital markets, including securitizations. A reduction in our credit ratings also could have a significant impact on certain trading revenues, particularly in those businesses where counterparty credit worthiness is critical. In connection with certain trading agreements, we may be required to provide additional collateral in the event of a credit ratings downgrade.
For a further discussion of our liquidity position and other liquidity matters, including ratings and outlooks and the policies and procedures we use to manage our liquidity risks, see "Liquidity Risk and Capital Management" in the MD&A.
Changes in financial or capital market conditions could cause our earnings and the value of our assets to decline . Market risk generally represents the risk that values of assets and liabilities or revenues will be adversely affected by changes in market conditions. As a result, we are directly and indirectly affected by changes in market conditions. For example, we rely on bank deposits for a low cost and stable source of funding for the loans that we make. However, changes in interest rates on bank deposits could adversely affect our net interest margin – the difference between the yield we earn on our assets and the interest rate we pay for deposits and other sources of funding – which could in turn affect our net interest income and earnings.
Market risk is inherent in the financial instruments associated with our operations and activities, including loans, deposits, securities, short-term borrowings, long-term debt, trading account assets and liabilities and derivatives. Just a few of the market conditions that may change from time to time, thereby exposing us to market risk, include changes in interest and currency exchange rates, equity and futures prices, the implied volatility of interest rates, credit spreads and price deterioration or changes in value due to changes in market perception or actual credit quality of either the issuer or its country of origin. Accordingly, depending on the instruments or activities impacted, market risks can have wide ranging, complex adverse effects on our results of operations and our overall financial condition. We also may incur significant unrealized gains or losses as a result of changes in our credit spreads or those of third parties, which may affect the fair value of our derivatives instruments and debt securities that we hold or issue.
| 8 | Bank of America 2009 |
Our models and strategies we use to assess and control our risk exposures are subject to inherent limitations. For example, our models, which rely on historical trends and assumptions, may not be sufficiently predictive of future results due to limited historical patterns, extreme or unanticipated market movements and illiquidity, especially during severe market downturns or stress events. The models that we use to assess and control our risk exposures also reflect assumptions about the degree of correlation or lack thereof among prices of various asset classes or other market indicators. In times of market stress or other unforeseen circumstances, such as the market conditions experienced in 2008 and 2009, previously uncorrelated indicators may become correlated, or previously correlated indicators may move in different directions. These types of market movements have at times limited the effectiveness of our hedging strategies and have caused us to incur significant losses, and they may do so in the future. These changes in correlation can be exacerbated where other market participants are using risk or trading models with assumptions or algorithms that are similar to ours. In these and other cases, it may be difficult to reduce our risk positions due to the activity of other market participants or widespread market dislocations, including circumstances where asset values are declining significantly or no market exists for certain assets. To the extent that we make investments directly in securities that do not have an established liquid trading market or are otherwise subject to restrictions on sale or hedging, we may not be able to reduce our positions and therefore reduce our risk associated with such positions.
For a further discussion of market risk and our market risk management policies and procedures, see "Market Risk Management" in the MD&A.
Adverse changes in the value of certain of our assets and liabilities could adversely impact our earnings . We have a large portfolio of financial instruments that we measure at fair value, including among others certain corporate loans and loan commitments, loans held-for-sale, structured reverse repurchase agreements and long-term deposits. We also have trading account assets and liabilities, derivatives assets and liabilities, available-for-sale debt and marketable equity securities, consumer-related mortgage servicing rights (MSRs) and certain other assets that are valued at fair value. We determine the fair values of these instruments based on the fair value hierarchy under applicable accounting guidance. The fair values of these financial instruments include adjustments for market liquidity, credit quality and other deal specific factors, where appropriate.
Gains or losses on these instruments can have a direct and significant impact on our earnings, unless we have effectively "hedged" our exposures. For example, changes in interest rates, among other things, can impact the value of our MSRs and can result in substantially higher or lower mortgage banking income and earnings, depending upon our ability to fully hedge the performance of our MSRs. Fair values may be impacted by declining values of the underlying assets or the prices at which observable market transactions occur and the continued availability of these transactions. The financial strength of counterparties, such as monoline financial guarantors, with whom we have economically hedged some of our exposure to these assets, also will affect the fair value of these assets. Sudden declines and significant volatility in the prices of assets may substantially curtail or eliminate the trading activity for these assets, which may make it very difficult to sell, hedge or value such assets. The inability to sell or effectively hedge assets reduces our ability to limit losses in such positions and the difficulty in valuing assets may increase our risk-weighted assets which requires us to maintain additional capital and increases our funding costs.
As previously disclosed on a current report on Form 8-K, in connection with the $2.8 billion in cash-settled restricted stock units awarded to some associates as part of their year-end compensation, we may recognize additional expense as a result of changes in the price of our common stock during the vesting period to the extent we do not effectively hedge this exposure. The awards of cash-settled restricted stock units are stock-based compensation paid out over time based on the price of
our common stock. Although we currently plan to make those payments in cash, we have reserved the right to make some or all of the payments in shares of our common stock.
Asset values also directly impact revenues in our asset management business. We receive asset-based management fees based on the value of our clients' portfolios or investments in funds managed by us and, in some cases, we also receive incentive fees based on increases in the value of such investments. Declines in asset values can reduce the value of our clients' portfolios or fund assets, which in turn can result in lower fees earned for managing such assets.
Our ability to successfully identify and manage our compliance and other risks is an important factor that can significantly impact our results. We seek to monitor and control our various risk exposures through a variety of separate but complementary financial, credit, operational, compliance and legal reporting systems. While we employ a broad and diversified set of risk monitoring and risk mitigation techniques, those techniques and the judgments that accompany their application cannot anticipate every economic, financial or regulatory outcome or the specifics or timing of such outcomes. Accordingly, our ability to successfully identify and manage risks facing us is an important factor that can significantly impact our results. Recent economic conditions, increased legislative and regulatory scrutiny and increased complexity of our operations, among other things, have increased and made it more difficult for us to manage our operational, compliance and other risks. For a further discussion of our risk management policies and procedures, see "Managing Risk" in the MD&A.
We may be unable to compete successfully as a result of the evolving financial services industry and market conditions. We operate in a highly competitive environment. Over time, there has been substantial consolidation among companies in the financial services industry, and this trend accelerated in 2008 and 2009 as the credit crisis led to numerous mergers and asset acquisitions among industry participants and in certain cases reorganization, restructuring, or even bankruptcy. This trend has also hastened the globalization of the securities and financial services markets. We will continue to experience intensified competition as further consolidation in the financial services industry in connection with current market conditions may produce larger and better-capitalized companies that are capable of offering a wider array of financial products and services at more competitive prices. To the extent we expand into new business areas and new geographic regions, we may face competitors with more experience and more established relationships with clients, regulators and industry participants in the relevant market, which could adversely affect our ability to compete. In addition, technological advances and the growth of e-commerce have made it possible for non-depository institutions to offer products and services that traditionally were banking products, and for financial institutions to compete with technology companies in providing electronic and internet-based financial solutions. Increased competition may affect our results by creating pressure to lower prices on our products and services and reducing market share.
Our continued ability to compete effectively in our businesses, including management of our existing businesses and expansion into new businesses and geographic areas, depends in part on our ability to retain and motivate our existing employees and attract new employees. We face significant competition for qualified employees both within and outside the financial services industry, including foreign-based institutions and institutions not subject to compensation or hiring restrictions imposed under any U. S. government initiatives or not subject to the same regulatory scrutiny. This is particularly the case in emerging markets, where we are often competing for qualified employees with entities that may have a significantly greater presence or more extensive experience in the region. A substantial portion of our annual bonus compensation paid to our senior employees has in recent years been paid in the form of long-term awards. The value of long-term equity awards to senior employees generally
| Bank of America 2009 | 9 |
has been impacted by the significant decline in the market price of our common stock. We also reduced the number of employees across nearly all of our businesses in 2008 and 2009. In addition, the consolidation in the financial services industry has intensified the inherent challenges of cultural integration between differing types of financial services institutions. The combination of these events could have a significant adverse impact on our ability to retain and hire the most qualified employees.
Our inability to successfully integrate, or realize the expected benefits from, our recent acquisitions could adversely affect our results. There are significant risks and uncertainties associated with mergers. We have made several significant acquisitions in the last several years, including our acquisition of Merrill Lynch, and there is a risk that integration difficulties or a significant decline in asset valuations or cash flows may cause us not to realize expected benefits from the transactions and may affect our results, including adversely impacting the carrying value of the acquisition premium or goodwill. In particular, the success of the Merrill Lynch acquisition will depend, in part, on our ability to realize the anticipated benefits and cost savings from combining the businesses of Bank of America and Merrill Lynch. To realize these anticipated benefits and cost savings, we must continue to successfully integrate our businesses, systems and operations. If we are not able to achieve these objectives, the anticipated benefits and cost savings of the acquisition may not be realized fully or may take longer to realize than expected. For example, we may fail to realize the growth opportunities and cost savings anticipated to be derived from the acquisition. Our ability to achieve these objectives has also been made more difficult as a result of the substantial challenges that we are facing in our businesses because of the current economic environment.
In addition, it is possible that the integration process could result in disruption of our and Merrill Lynch's ongoing businesses or inconsistencies in standards, controls, procedures and policies that adversely affect our ability to maintain sufficiently strong relationships with clients, customers, depositors and employees or to achieve the anticipated benefits of the acquisition. Integration efforts may also divert management attention and resources. These integration matters could have an adverse effect on us for an undetermined period. We will be subject to similar risks and difficulties in connection with any future acquisitions or decisions to downsize, sell or close units or otherwise change the business mix of the Corporation.
We may be adversely impacted by business, economic and political conditions in the non-U.S. jurisdictions in which we operate. We do business throughout the world, including in developing regions of the world commonly known as emerging markets. Our acquisition of Merrill Lynch has significantly increased our exposure to a number of risks in non-U.S. jurisdictions, including economic, market, reputational, operational, litigation and regulatory risks. Our businesses and revenues derived from non-U.S. jurisdictions are subject to risk of loss from currency fluctuations, social or judicial instability, changes in governmental policies or policies of central banks, expropriation, nationalization and/or confiscation of assets, unfavorable political and diplomatic developments and changes in legislation. Also, as in the United States, many non-U.S. jurisdictions in which we do business have been negatively impacted by recessionary conditions. While a number of these jurisdictions are showing signs of recovery, others continue to experience increasing levels of stress. In addition, the risk of default on sovereign debt in some non-U.S. jurisdictions is increasing and could expose us to losses.
In many countries, the laws and regulations applicable to the securities and financial services industries are uncertain and evolving, and it may be difficult for us to determine the exact requirements of local laws in every market or manage our relationships with multiple regulators in various jurisdictions. Our inability to remain in compliance with local laws in a particular market and manage our relationships with regulators could have a significant and negative effect not only on our business in that market but also on our reputation generally.
In addition, our revenues from emerging markets are particularly exposed to severe political, economic and financial disruptions, including significant currency devaluations, currency exchange controls and low or negative economic growth rates.
We also invest or trade in the securities of corporations and governments located in non-U.S. jurisdictions, including emerging markets. Revenues from the trading of non-U.S. securities may be subject to negative fluctuations as a result of the above factors. Furthermore, the impact of these fluctuations could be magnified, because generally non-U.S. trading markets, particularly in emerging market countries, are smaller, less liquid and more volatile than U.S. trading markets.
We are subject to geopolitical risks, including acts or threats of terrorism, and actions taken by the U.S. or other governments in response and/or military conflicts, that could adversely affect business and economic conditions abroad as well as in the United States.
For a further discussion of our foreign credit and trading portfolio, see "Credit Risk Management-Foreign Portfolio" in the MD&A.
Changes in g overnmental fiscal and monetary policy could adversely affect our businesses . Our businesses and earnings are affected by domestic and international fiscal and monetary policy. For example, the Federal Reserve Board regulates the supply of money and credit in the United States and its policies determine in large part our cost of funds for lending, investing and capital raising activities and the return we earn on those loans and investments, both of which affect our net interest margin. The actions of the Federal Reserve Board also can materially affect the value of financial instruments we hold, such as debt securities and MSRs, and its policies also can affect our borrowers, potentially increasing the risk that they may fail to repay their loans. Our businesses and earnings are also affected by the fiscal or other policies that are adopted by various U.S. regulatory authorities, non-U.S. governments and international agencies. Changes in domestic and international fiscal and monetary policies are beyond our control and difficult to predict.
We may suffer losses as a result of o perational risk or technical system failures . The potential for operational risk exposure exists throughout our organization. Integral to our performance is the continued efficacy of our internal processes, systems, relationships with third parties and the vast array of associates and key executives in our day-to-day and ongoing operations, including losses resulting from unauthorized trades by any associates. Operational risk also encompasses the failure to implement strategic objectives in a successful, timely and cost-effective manner. Failure to properly manage operational risk subjects us to risks of loss that may vary in size, scale and scope, including loss of customers. This also includes but is not limited to operational or technical failures, unlawful tampering with our technical systems, ineffectiveness or exposure due to interruption in third party support, as well as the loss of key individuals or failure on the part of key individuals to perform properly. For further discussion of operational risks and our operational risk management, see "Operational Risk Management" in the MD&A.
Our inability to adapt our p roducts and services to evolving industry standards and consumer preferences could harm our businesses . Our business model is based on a diversified mix of businesses that provide a broad range of financial products and services, delivered through multiple distribution channels. Our success depends, in part, on our ability to adapt our products and services to evolving industry standards. There is increasing pressure by competitors to provide products and services at lower prices. This can reduce our net interest margin and revenues from our fee-based products and services. In addition, the widespread adoption of new technologies, including internet services, could require us to incur substantial expenditures to modify or adapt our existing products and services. We might not be successful in developing or introducing new products and services, responding or adapting to changes in
| 10 | Bank of America 2009 |
consumer spending and saving habits, achieving market acceptance of our products and services, or sufficiently developing and maintaining loyal customers.
Bank of America Corporation is a holding company and as such is dependent upon its subsidiaries for liquidity, including its ability to pay dividends . Bank of America Corporation is a separate and distinct legal entity from our banking and nonbanking subsidiaries. We therefore depend on dividends, distributions and other payments from our banking and nonbanking subsidiaries to fund dividend payments on our common stock and preferred stock and to fund all payments on our other obligations, including debt obligations. Many of our subsidiaries are subject to laws that authorize regulatory agencies to block or reduce the flow of funds from those subsidiaries to Bank of America Corporation. Regulatory action of that kind could impede access to funds we need to make pay -
ments on our obligations or dividend payments. In addition, our right to participate in a distribution of assets upon a subsidiary's liquidation or reorganization is subject to the prior claims of the subsidiary's creditors. For a further discussion regarding our ability to pay dividends, see "Government Supervision and Regulation – Distributions" on page 4 of this report and Note 15 – Shareholders' Equity and Earnings Per Common Share and Note 16 – Regulatory Requirements and Restrictions to the Consolidated Financial Statements.
Item 1B. Unresolved Staff Comments
There are no unresolved written comments that were received from the SEC's staff 180 days or more before the end of our 2009 fiscal year relating to our periodic or current reports filed under the Securities Exchange Act of 1934.
Item 2. Properties
As of December 31, 2009, our principal offices and other materially important properties consisted of the following:
| Property | Type | Primary Segment | Owned/ Leased | Occupied; Sub-Leased to 3 rd parties | ||||
Bank of America Corporate Center Charlotte, NC | 60 story building | Principal executive offices-All Business Segments* | Owned | Occupy 48% (573,734 sq. ft.); sub-lease 50% (603,833 sq. ft.) of building | ||||
100 Federal Street Boston, MA | 37 story building | Global Wealth & Investment Management | Owned | Occupy 51% (636,202 sq. ft.); sub-lease 38% (470,029 sq. ft.) of building | ||||
Bank of America Tower One Bryant Park New York, NY | 52 story building | Global Markets; Global Wealth & Investment Management | 49% Owned | Occupy 99% of building (1,628,416 sq. ft.) | ||||
2 World Financial Center New York, NY | 44 story building (South Tower) | Global Markets; Global Wealth & Investment Management | Leased | Occupy 24% (609,155 sq. ft.); sub-lease 72% (1,815,833 sq. ft.) of building | ||||
4 World Financial Center New York, NY | 34 story building (North Tower) | Global Markets; Global Wealth & Investment Management | 49% Owned | Occupy 78% (1,215,754 sq. ft.) of building | ||||
222 Broadway New York, NY | 31 story building | Global Markets; Global Wealth & Investment Management | Owned | Occupy 93% (652,633 sq. ft.); sub-lease 7% (50,902 sq. ft.) of building | ||||
Hopewell Campus Hopewell, NJ | 8 building campus | All Business Segments | Owned | Occupy 99% (1,561,611 sq. ft.); sub-lease 1% of buildings | ||||
Jacksonville Complex Jacksonville, FL | 9 building campus | All Business Segments | Leased | Occupy 80% (950,842 sq. ft.) of buildings | ||||
Jacksonville Campus Jacksonville, FL | 4 building campus | All Business Segments | Owned | Occupy 95% (549,436 sq. ft.) of buildings | ||||
Concord Campus Concord, CA | 4 building campus | All Business Segments | Owned | Occupy 82% (887,469 sq. ft.) of buildings | ||||
Merrill Lynch Financial Center London, England | 4 building campus | Global Markets; Global Wealth & Investment Management | Leased | Occupy 84% (485,495 sq. ft.) of buildings | ||||
Other London Locations London, England | 3 buildings | Global Markets; Global Wealth & Investment Management | Leased | Occupy 70% (125,962 sq. ft.); sub-lease 5% of buildings | ||||
Bank of America Merrill Lynch Japan Tokyo, Japan | 20 story building | Global Markets; Global Wealth & Investment Management | Leased | Occupy 60% (158,861 sq. ft.); sub-lease 24% (62,613 sq. ft.) of building |
| * | All Business Segments consists of Deposits, Global Card Services, Home Loans & Insurance, Global Banking, Global Markets and Global Wealth & Investment Management . |
We own or lease approximately 118.7 million square feet in 27,779 locations in 50 states in the United States, the District of Columbia, the U.S. Virgin Islands, and Puerto Rico. We also own or lease approximately 6.9 million square feet in 90 cities in 44 foreign countries. We believe that the properties we own or lease are adequate for our needs and well maintained.
Item 3. Legal Proceedings
See "Litigation and Regulatory Matters" in Note 14 – Commitments and Contingencies to the Consolidated Financial Statements beginning on page 160 for Bank of America's litigation disclosure which is incorporated herein by reference.
Item 4. Submission of Matters To A Vote of Security Holders
There were no matters submitted to a vote of stockholders during the quarter ended December 31, 2009.
Executive Officers of The Registrant
The name, age and position of each of our current executive officers are listed below along with such officer's business experience. Unless otherwise indicated, executive officers are appointed by the Board to hold office until their successors are elected and qualified or until their earlier resignation or removal.
Neil A. Cotty (55) Interim Chief Financial Officer since February 1, 2010 and Chief Accounting Officer since July 2009; Chief Financial Officer, Global Banking and Global Wealth and Investment Management from October 2008 to July 2009; Chief Accounting Officer from April 2004 to September 2008; Senior Finance Executive for Consumer Products supporting Commercial Banking (now Global Commercial Banking) from October 2003 to April 2004; Senior Finance Executive for Consumer Products from January 2003 to October 2003.
David C. Darnell (56) President, Global Commercial Banking since July 2005. President, Middle Market Banking Group from June 2001 to July 2005; President, Bank of America Central Region from August 2000
| Bank of America 2009 | 11 |
to June 2001; President, Bank of America Midwest and Texas from September 1996 to August 2000; Executive Vice President and Commercial Division Executive in Florida from January 1989 to September 1996.
Barbara J. Desoer (57) President, Bank of America Home Loans and Insurance, since July 2008; Chief Technology and Operations Officer from August 2004 to July 2008; President, Consumer Products from July 2001 to August 2004; Director of Marketing from September 1999 to July 2001; President, Bank of America Northern California from January 1998 to September 1999.
Sallie L. Krawcheck (45) President, Global Wealth and Investment Management since August 2009; Chairman of Global Wealth Management of Citigroup, Inc. from January 2007 until December 2008; Chief Executive Officer of Global Wealth Management of Citigroup, Inc. from January 2007 to September 2008; Chief Financial Officer and Head of Strategy Citigroup, Inc. from November 2004 to January 2007; Chairman and Chief Executive Officer - SmithBarney of Citigroup, Inc. from October 2002 to November 2004; Chairman and Chief Executive Officer of Sanford C. Bernstein & Co. prior to 2002.
Thomas K. Montag (52) President, Global Banking and Markets since August 2009; President, Global Markets from January 2009 to August 2009; Executive Vice President and Head of Global Sales and Trading of Merrill Lynch & Co., Inc. from August 2008 to December 2008; Co-head, Global Securities of The Goldman Sachs Group, Inc. from 2006 to 2008; Co-president, Japanese Operations of The Goldman Sachs Group, Inc. from 2002 to 2007; Member, Management Committee of The Goldman Sachs Group, Inc. from 2002 to 2008; Member, Fixed Income, Currency and Commodities & Equities Executive Committee of The Goldman Sachs Group, Inc. from 2000 to 2008.
Brian T. Moynihan (50) President and Chief Executive Officer since January 2010; President, Consumer and Small Business Banking, from August 2009 to December 2009; President, Global Banking and Wealth
Management (now Global Wealth and Investment Management) from January 2009 to August 2009; General Counsel from December 2008 to January 2009; President, Global Corporate and Investment Banking (now Global Banking and Markets) from October 2007 to December 2008; President, Global Wealth and Investment Management from April 2004 to October 2007; Executive Vice President of FleetBoston Financial Corporation from 1999 to April 2004, with responsibility for Brokerage and Wealth Management from 2000 and Regional Commercial Financial Services and Investment Management from May 2003.
Edward P. O'Keefe (54) General Counsel since January 2009; Deputy General Counsel and Head of Litigation from December 2008 to January 2009; Global Compliance and Operational Risk Executive and Senior Privacy Executive from September 2008 to December 2008; Deputy General Counsel for Staff Support from August 2004 to September 2008.
Joe L. Price (49) President; Consumer, Small Business and Card Banking since February 1, 2010; Chief Financial Officer from January 2007 to January 2010; Global Corporate and Investment Banking Risk Management Executive from June 2003 to December 2006; Senior Vice President, Corporate Strategy and President, Consumer Special Assets from July 2002 to May 2003; President, Consumer Finance from November 1999 to July 2002; Corporate Risk Evaluation Executive and General Auditor from August 1997 to October 1999; Controller from June 1995 to July 1997; Accounting Policy and Finance Executive from April 1993 to May 1995.
Bruce R. Thompson (45) Chief Risk Officer since January 2010; Head of Global Capital Markets from July 2008 to January 2010; Co-head of Capital Markets (now Global Capital Markets) from October 2007 to July 2008; Co-head of Global Credit Products from June 2007 to October 2007; Co-head of Global Leveraged Finance from March 2007 to June 2007; Head of U.S. Leveraged Finance Capital Markets from May 2006 to March 2007; Managing Director of Banc of America Securities LLC, from 1996 to May 2006.
| 12 | Bank of America 2009 |
| Part II |
| Bank of America Corporation and Subsidiaries |
Item 5. Market for Registrant's Common Equity, Related Stockholder Matters and Issuer Purchases of Equity Securities
The principal market on which our common stock is traded is the New York Stock Exchange. Our common stock is also listed on the London Stock Exchange, and certain shares are listed on the Tokyo Stock Exchange. The following table sets forth the high and low closing sales prices of the common stock on the New York Stock Exchange for the periods indicated:
| Quarter | High | Low | ||||||
2008 | first | $ | 45.03 | $ | 35.31 | |||
second | 40.86 | 23.87 | ||||||
third | 37.48 | 18.52 | ||||||
fourth | 38.13 | 11.25 | ||||||
2009 | first | 14.33 | 3.14 | |||||
second | 14.17 | 7.05 | ||||||
third | 17.98 | 11.84 | ||||||
fourth | 18.59 | 14.58 | ||||||
As of February 24, 2010, there were 257,307 registered shareholders of common stock. During 2008 and 2009, we paid dividends on the common stock on a quarterly basis.
The following table sets forth dividends paid per share of our common stock for the periods indicated:
| Quarter | Dividend | ||||
2008 | first | $ | 0.64 | ||
second | 0.64 | ||||
third | 0.64 | ||||
fourth | 0.32 | ||||
2009 | first | 0.01 | |||
second | 0.01 | ||||
third | 0.01 | ||||
fourth | 0.01 | ||||
For additional information regarding our ability to pay dividends, see the discussion under the heading "Government Supervision and Regulation – Distributions" on page 4 of this report and Note 15 – Shareholders' Equity and Earnings Per Common Share to the Consolidated Financial Statements beginning on page 171, and Note 16 – Regulatory Requirements and Restrictions to the Consolidated Financial Statements beginning on page 175, which are incorporated herein by reference.
For information on our equity compensation plans, see Item 12 beginning on page 204 of this report and Note 18 – Stock-Based Compensation Plans to the Consolidated Financial Statements beginning on page 182, both of which are incorporated herein by reference.
The table below presents share repurchase activity for the three months ended December 31, 2009. For additional information regarding share repurchases on these restrictions, see Note 15 – Shareholders' Equity and Earnings Per Common Share to the Consolidated Financial Statements on page 171 which is incorporated herein by reference.
| (Dollars in millions, except per share information; shares in thousands) | Common Shares Repurchased (1) | Weighted Average Per Share Price | Shares Purchased as Part of Publicly Announced Programs | Remaining Buyback Authority (2) | ||||||
| Amounts | Shares | |||||||||
October 1 – 31, 2009 | 98 | 15.96 | - | 3,750 | 75,000 | |||||
November 1 – 30, 2009 | 24 | 14.28 | - | 3,750 | 75,000 | |||||
December 1 – 31, 2009 | 314 | 14.50 | - | 3,750 | 75,000 | |||||
Three months ended December 31, 2009 | 435 | 14.82 | ||||||||
| (1) | Consists of shares of our common stock purchased by participants under certain retirement plans and shares acquired by us in connection with satisfaction of tax withholding obligations on vested restricted stock units and certain forfeitures and terminations of employment related to awards under equity incentive plans. |
| (2) | On July 23, 2008, the Board authorized a stock repurchase program of up to 75 million shares of our common stock at an aggregate cost not to exceed $3.75 billion and is limited to a period of 12 to 18 months. The stock repurchase program expired on January 23, 2010. |
We did not have any unregistered sales of our equity securities in 2009, except as previously disclosed on Form 8-K.
Item 6. Selected Financial Data
See Table 6 in the MD&A on page 24 and Table XII of the Statistical Tables on page 105 which are incorporated herein by reference.
| Bank of America 2009 | 13 |
Item 7. Bank of America Corporation and Subsidiaries
Management's Discussion and Analysis of Financial Condition and Results of Operations
Table of Contents
| Page | ||
Executive Summary | 16 | |
Financial Highlights | 20 | |
Balance Sheet Analysis | 22 | |
Supplemental Financial Data | 25 | |
Business Segment Operations | 27 | |
Deposits | 28 | |
Global Card Services | 29 | |
Home Loans & Insurance | 31 | |
Global Banking | 33 | |
Global Markets | 35 | |
Global Wealth & Investment Management | 38 | |
All Other | 41 | |
Obligations and Commitments | 42 | |
Regulatory Initiatives | 43 | |
Managing Risk | 44 | |
Strategic Risk Management | 47 | |
Liquidity Risk and Capital Management | 47 | |
Credit Risk Management | 54 | |
Consumer Portfolio Credit Risk Management | 54 | |
Commercial Portfolio Credit Risk Management | 64 | |
Foreign Portfolio | 74 | |
Provision for Credit Losses | 76 | |
Allowance for Credit Losses | 76 | |
Market Risk Management | 79 | |
Trading Risk Management | 80 | |
Interest Rate Risk Management for Nontrading Activities | 83 | |
Mortgage Banking Risk Management | 86 | |
Compliance Risk Management | 86 | |
Operational Risk Management | 86 | |
ASF Framework | 87 | |
Complex Accounting Estimates | 88 | |
2008 Compared to 2007 | 92 | |
Overview | 92 | |
Business Segment Operations | 93 | |
Statistical Tables | 95 | |
Glossary | 108 |
Throughout the MD&A, we use certain acronyms and
abbreviations which are defined in the Glossary beginning on page 108.
| 14 | Bank of America 2009 |
Management's Discussion and Analysis of Financial Condition and Results of Operations
This report on Form 10-K and the documents into which it may be incorporated by reference may contain, and from time to time our management may make, certain statements that constitute forward-looking statements. Words such as "expects," "anticipates," "believes," "estimates" and other similar expressions or future or conditional verbs such as "will," "should," "would" and "could" are intended to identify such forward-looking statements. These statements are not historical facts, but instead represent the current expectations, plans or forecasts of Bank of America Corporation and its subsidiaries (the Corporation) regarding the Corporation's integration of the Merrill Lynch and Countrywide acquisitions and related cost savings, future results and revenues, credit losses, credit reserves and charge-offs, delinquency trends, nonperforming asset levels, level of preferred dividends, service charges, the closing of the sales of Columbia Management (Columbia) and First Republic Bank, effective tax rate, noninterest expense, impact of changes in fair value of Merrill Lynch structured notes, impact of new accounting guidance regarding consolidation on capital and reserves, mortgage production, the effect of various legal proceedings discussed in "Litigation and Regulatory Matters" in Note 14 – Commitments and Contingencies to the Consolidated Financial Statements and other matters relating to the Corporation and the securities that we may offer from time to time. These statements are not guarantees of future results or performance and involve certain risks, uncertainties and assumptions that are difficult to predict and often are beyond the Corporation's control. Actual outcomes and results may differ materially from those expressed in, or implied by, the Corporation's forward-looking statements.
You should not place undue reliance on any forward-looking statement and should consider the following uncertainties and risks, as well as the risks and uncertainties discussed elsewhere in this report, including under Item 1A. "Risk Factors," and in any of the Corporation's other subsequent Securities and Exchange Commission (SEC) filings: negative economic conditions that adversely affect the general economy, housing prices, job market, consumer confidence and spending habits which may affect, among other things, the credit quality of our loan portfolios (the degree of the impact of which is dependent upon the duration and severity of these conditions); the Corporation's modification policies and related results; the level and volatility of the capital markets, interest
rates, currency values and other market indices which may affect, among other things, our liquidity and the value of our assets and liabilities and, in turn, our trading and investment portfolios; changes in consumer, investor and counterparty confidence in, and the related impact on, financial markets and institutions; the Corporation's credit ratings and the credit ratings of our securitizations which are important to the Corporation's liquidity, borrowing costs and trading revenues; estimates of fair value of certain of the Corporation's assets and liabilities which could change in value significantly from period to period; legislative and regulatory actions in the United States (including the Electronic Fund Transfer Act, the Credit Card Accountability Responsibility and Disclosure (CARD) Act of 2009 and related regulations) and internationally which may increase the Corporation's costs and adversely affect the Corporation's businesses and economic conditions as a whole; the impact of litigation and regulatory investigations, including costs, expenses, settlements and judgments; various monetary and fiscal policies and regulations of the U.S. and non-U.S. governments; changes in accounting standards, rules and interpretations (including new accounting guidance on consolidation) and the impact on the Corporation's financial statements; increased globalization of the financial services industry and competition with other U.S. and international financial institutions; the Corporation's ability to attract new employees and retain and motivate existing employees; mergers and acquisitions and their integration into the Corporation, including our ability to realize the benefits and cost savings from and limit any unexpected liabilities acquired as a result of the Merrill Lynch acquisition; the Corporation's reputation; and decisions to downsize, sell or close units or otherwise change the business mix of the Corporation.
Forward-looking statements speak only as of the date they are made, and the Corporation undertakes no obligation to update any forward-looking statement to reflect the impact of circumstances or events that arise after the date the forward-looking statement was made.
Notes to the Consolidated Financial Statements referred to in the Management's Discussion and Analysis of Financial Condition and Results of Operations (MD&A) are incorporated by reference into the MD&A. Certain prior period amounts have been reclassified to conform to current period presentation.
| Bank of America 2009 | 15 |
Executive Summary
Business Overview
The Corporation is a Delaware corporation, a bank holding company and a financial holding company. Our principal executive offices are located in the Bank of America Corporate Center in Charlotte, North Carolina. Through our banking and various nonbanking subsidiaries throughout the United States and in certain international markets, we provide a diversified range of banking and nonbanking financial services and products through six business segments : Deposits, Global Card Services, Home Loans & Insurance, Global Banking, Global Markets and Global Wealth & Investment Management (GWIM), with the remaining operations recorded in All Other . At December 31, 2009, the Corporation had $2.2 trillion in assets and approximately 284,000 full-time equivalent employees. On January 1, 2009, we acquired Merrill Lynch & Co., Inc. (Merrill Lynch) and as a result we have one of the largest wealth management businesses in the world with approximately 15,000 financial advisors and more than $2.1 trillion in
net client assets. Additionally, we are a global leader in corporate and investment banking and trading across a broad range of asset classes serving corporations, governments, institutions and individuals around the world. On July 1, 2008, we acquired Countrywide Financial Corporation (Countrywide) significantly expanding our mortgage origination and servicing capabilities, making us a leading mortgage originator and servicer.
As of December 31, 2009, we currently operate in all 50 states, the District of Columbia and more than 40 foreign countries. In addition, our retail banking footprint covers approximately 80 percent of the U.S. population and in the U.S. we serve approximately 59 million consumer and small business relationships with approximately 6,000 banking centers, more than 18,000 ATMs, nationwide call centers, and leading online and mobile banking platforms. We have banking centers in 12 of the 15 fastest growing states and have leadership positions in eight of those states. We offer industry-leading support to approximately four million small business owners.
The following table provides selected consolidated financial data for 2009 and 2008.
Table 1 Selected Financial Data
| (Dollars in millions, except per share information) | 2009 | 2008 | ||||||
Income statement | ||||||||
Revenue, net of interest expense (FTE basis) | $ | 120,944 | $ | 73,976 | ||||
Net income | 6,276 | 4,008 | ||||||
Diluted earnings (loss) per common share | (0.29 | ) | 0.54 | |||||
Average diluted common shares issued and outstanding (in millions) | 7,729 | 4,596 | ||||||
Dividends paid per common share | $ | 0.04 | $ | 2.24 | ||||
Performance ratios | ||||||||
Return on average assets | 0.26 | % | 0.22 | % | ||||
Return on average tangible shareholders' equity (1) | 4.18 | 5.19 | ||||||
Efficiency ratio (FTE basis) (1) | 55.16 | 56.14 | ||||||
Balance sheet at year end | ||||||||
Total loans and leases | $ | 900,128 | $ | 931,446 | ||||
Total assets | 2,223,299 | 1,817,943 | ||||||
Total deposits | 991,611 | 882,997 | ||||||
Total common shareholders' equity | 194,236 | 139,351 | ||||||
Total shareholders' equity | 231,444 | 177,052 | ||||||
Common shares issued and outstanding (in millions) | 8,650 | 5,017 | ||||||
Asset quality | ||||||||
Allowance for loan and lease losses | $ | 37,200 | $ | 23,071 | ||||
Nonperforming loans, leases and foreclosed properties | 35,747 | 18,212 | ||||||
Allowance for loan and lease losses as a percentage of total nonperforming loans and leases | 111 | % | 141 | % | ||||
Net charge-offs | $ | 33,688 | $ | 16,231 | ||||
Net charge-offs as a percentage of average loans and leases outstanding | 3.58 | % | 1.79 | % | ||||
Capital ratios | ||||||||
Tier 1 common | 7.81 | % | 4.80 | % | ||||
Tier 1 | 10.40 | 9.15 | ||||||
Total | 14.66 | 13.00 | ||||||
Tier 1 leverage | 6.91 | 6.44 | ||||||
| (1) | Return on average tangible shareholders' equity and the efficiency ratio are non-GAAP measures. Other companies may define or calculate these measures differently. For additional information on these ratios and a corresponding reconciliation to GAAP financial measures, see Supplemental Financial Data beginning on page 25. |
2009 Economic Environment
2009 was a transition year as the U.S. economy began to stabilize although unemployment continued to rise. Gross Domestic Product, which fell sharply in the first quarter and continued to decline in the second quarter, rebounded in the second half of the year but remained well below its earlier expansion peak level. Consumer spending, which had declined sharply in the second half of 2008, rose modestly in each quarter of 2009 and received a boost from the U.S. government's Cash-for-Clunkers auto subsidies in the third quarter. Consumer spending remained tentative as households saved more and paid down debt. After reaching lows in January, housing activity increased compared to 2008 as home sales and new housing starts rose through the year lifting residential construction. Nevertheless, large inventories of unsold homes and the
increase in foreclosures continued to weigh heavily on the housing sector.
Businesses cut production, inventories, employment and capital spending aggressively in response to the financial crisis in late 2008 continuing into 2009. Production and capital spending fell in the first half of the year, inventories declined for the first three quarters and employment declined through the entire year although at a progressively lower rate. U.S. exports increased in the second half of the year reflecting the rebound of certain international economies following the global recession. Despite the modest growth in product demand and output in the second half of the year, job layoffs mounted, and the unemployment rate increased to over 10 percent in the fourth quarter, the highest since the early 1980s. Producing more with fewer workers drove improvement in labor productivity, boosting profits in the second half of the year.
| 16 | Bank of America 2009 |
The Board of Governors of the Federal Reserve System (Federal Reserve) lowered the federal funds rate to close to zero percent early in the first quarter and in mid-March announced a program of quantitative easing, in which it purchased U.S. Treasuries, mortgage-backed securities (MBS) and long-term debt of government-sponsored enterprises (GSEs). This program contributed to lower mortgage rates generating an increase in consumer mortgage refinancing which helped homeowners, and along with lower home prices, stimulated activity in the housing market.
In early 2009, the short-term funding markets began to return to normal and the U.S. government began to unwind its alternative liquidity facilities, and loan and asset guarantee programs. By mid-year, order had been restored to most financial market sectors. The stock market fell sharply through mid-March, but rebounded abruptly, triggered in part by the U.S. government's bank stress tests and banks' successful capital raising. The stock market rally through year end retraced some of the losses in household net worth and increased consumer confidence.
Our consumer businesses were affected by the economic factors mentioned above, as our Deposits business was negatively impacted by spread compression. Global Card Services was affected as reduced consumer spending led to lower revenue and a higher level of bankruptcies led to increased provision for credit losses. Home Loans & Insurance benefited from the low interest rate environment and lower home prices, driving higher mortgage production income; however, higher unemployment and falling home values drove increases in the provision for credit losses. In addition, the factors mentioned above negatively impacted growth in the consumer loan portfolio including credit card and real estate.
Global Banking felt the impact of the above economic factors as businesses paid down debt reducing loan balances. In addition, the commercial portfolio within Global Banking declined due to further reductions in spending by businesses as they sought to increase liquidity, and the resurgence of capital markets which allowed corporate clients to issue bonds and equity to replace loans as a source of funding. The commercial real estate and commercial – domestic portfolios experienced higher net charge-offs reflecting deterioration across a broad range of industries, property types and borrowers. In addition to increased net charge-offs, nonperforming loans, leases and foreclosed properties and commercial criticized utilized exposures were higher which contributed to increased reserves across most portfolios during the year.
Capital markets conditions showed some signs of improvement during 2009 and Global Markets took advantage of the favorable trading environment. Market dislocations that occurred throughout 2008 continued to impact our results in 2009, although to a lesser extent, as we experienced reduced write-downs on legacy assets compared to the prior year. During 2009, our credit spreads improved driving negative credit valuation adjustments on the Corporation's derivative liabilities recorded in Global Markets and on Merrill Lynch structured notes recorded in All Other.
GWIM also benefited from the improvement in capital markets driving growth in client assets resulting in increased fees and brokerage commissions. In addition, we continued to provide support to certain cash funds during 2009 although to a lesser extent than in the prior year. As of December 31, 2009, all capital commitments to these cash funds had been terminated and the funds no longer hold investments in structured investment vehicles (SIVs).
On a going forward basis, the continued weakness in the global economy and recent and proposed regulatory changes will continue to affect many of the markets in which we do business and may adversely impact our results for 2010. The impact of these conditions is dependent upon the timing, degree and sustainability of the economic recovery.
Regulatory Overview
In November 2009, the Federal Reserve issued amendments to Regulation E, which implement the Electronic Fund Transfer Act (Regulation E). The new rules have a compliance date of July 1, 2010. These amendments change, among other things, the way we and other banks may charge overdraft fees; by limiting our ability to charge an overdraft fee for ATM and one-time debit card transactions that overdraw a consumer's account, unless the consumer affirmatively consents to the bank's payment of overdrafts for those transactions. Changes to our overdraft practices will negatively impact future service charge revenue primarily in Deposits.
On May 22, 2009, the Credit Card Accountability Responsibility and Disclosure Act of 2009 (CARD Act) was signed into law. The majority of the CARD Act provisions became effective in February 2010. The CARD Act legislation contains comprehensive credit card reform related to credit card industry practices including significantly restricting banks' ability to change interest rates and assess fees to reflect individual consumer risk, changing the way payments are applied and requiring changes to consumer credit card disclosures. Under the CARD Act, banks must give customers 45 days notice prior to a change in terms on their account and the grace period for credit card payments changes from 14 days to 21 days. The CARD Act also requires banks to review any accounts that were repriced since January 1, 2009 for a possible rate reduction. As announced in October 2009, we did not increase interest rates on consumer card accounts in response to provisions in the CARD Act prior to its effective date unless the customer's account fell past due or was based on a variable interest rate. Within Global Card Services, the provisions in the CARD Act are expected to negatively impact net interest income, due to the restrictions on our ability to reprice credit cards based on risk, and card income due to restrictions imposed on certain fees.
In July 2009, the Basel Committee on Banking Supervision released a consultative document entitled "Revisions to the Basel II Market Risk Framework" that would significantly increase the capital requirements for trading book activities if adopted as proposed. The proposal recommended implementation by December 31, 2010, but regulatory agencies are currently evaluating the proposed rulemaking and related impacts before establishing final rules. As a result, we cannot determine the implementation date or the final capital impact.
In December 2009, the Basel Committee on Banking Supervision issued a consultative document entitled "Strengthening the Resilience of the Banking Sector." If adopted as proposed, this could increase significantly the aggregate equity that bank holding companies are required to hold by disqualifying certain instruments that previously have qualified as Tier 1 capital. In addition, it would increase the level of risk-weighted assets. The proposal could also increase the capital charges imposed on certain assets potentially making certain businesses more expensive to conduct. Regulatory agencies have not opined on the proposal for implementation. We continue to assess the potential impact of the proposal.
As a result of the financial crisis, the financial services industry is facing the possibility of legislative and regulatory changes that would impose significant, adverse changes on its ability to serve both retail and wholesale customers. A proposal is currently being considered to levy a tax or fee on financial institutions with assets in excess of $50 billion to repay the costs of TARP, although the proposed tax would continue even after those costs are repaid. If enacted as proposed, the tax could significantly affect our earnings, either by increasing the costs of our liabilities or causing us to reduce our assets. It remains uncertain whether the tax will be enacted, to whom it would apply, or the amount of the tax we would be required to pay. It is also unclear the extent to which the costs of such a tax could be recouped through higher pricing.
| Bank of America 2009 | 17 |
In addition, various proposals for broad-based reform of the financial regulatory system are pending. A majority of these proposals would not disrupt our core businesses, but a proposal could ultimately be adopted that adversely affects certain of our businesses. The proposals would require divestment of certain proprietary trading activities, or limit private equity investments. Other proposals, which include limiting the scope of an institution's derivatives activities, or forcing certain derivatives activities to be traded on exchanges, would diminish the demand for, and profitability of, certain businesses. Several other proposals would require issuers to retain unhedged interests in any asset that is securitized, potentially severely restricting the secondary market as a source of funding for consumer or commercial lending. There are also numerous proposals pending on how to resolve a failed systemically important institution. In light of the current regulatory environment, one ratings agency has placed Bank of America and certain other banks on negative outlook, and therefore adoption of such provisions may adversely affect our access to credit markets. It remains unclear whether any of these proposals will ultimately be enacted, and what form they may take.
For additional information on these items, refer to Item 1A., Risk Factors.
Performance Overview
Net income was $6.3 billion in 2009, compared with $4.0 billion in 2008. Including preferred stock dividends and the impact from the repayment of the U.S. government's $45.0 billion preferred stock investment in the Corporation under the Troubled Asset Relief Program (TARP), income applicable to common shareholders was a net loss of $2.2 billion, or $(0.29) per diluted share. Those results compared with 2008 net income applicable to common shareholders of $2.6 billion, or $0.54 per diluted share.
Revenue, net of interest expense on a fully taxable-equivalent (FTE) basis, rose to $120.9 billion representing a 63 percent increase from $74.0 billion in 2008 reflecting in part the addition of Merrill Lynch and the full-year impact of Countrywide.
Net interest income on a FTE basis increased to $48.4 billion compared with $46.6 billion in 2008. The increase was the result of a favorable rate environment, improved hedge results and the acquisitions of Countrywide and Merrill Lynch, offset in part by lower asset and liability management (ALM) portfolio levels, lower consumer loan balances and an increase in nonperforming loans. The net interest yield narrowed 33 basis points (bps) to 2.65 percent.
Noninterest income rose to $72.5 billion compared with $27.4 billion in 2008. Higher trading account profits, equity investment income, investment and brokerage services fees and investment banking income reflected the addition of Merrill Lynch while higher mortgage banking and insurance income reflected the full-year impact of Countrywide. Gains on sales of debt securities increased driven by sales of agency MBS and collateralized mortgage obligations (CMOs). Equity investment income benefited from pre-tax gains of $7.3 billion related to the sale of portions of our investment in China Construction Bank (CCB) and a pre-tax gain of $1.1 billion on our investment in BlackRock, Inc. (BlackRock). In addition, trading account profits benefited from decreased write-downs on legacy assets of $6.5 billion compared to the prior year. The other income (loss) category included a $3.8 billion gain from the contribution of our merchant processing business to a joint venture. This was partially offset by a decline in card income of $5.0 billion mainly due to higher credit losses on securitized credit card loans and lower fee income. In addition, noninterest income was negatively impacted by $4.9 billion in net losses mostly related to credit valuation adjustments on the Merrill Lynch structured notes.
The provision for credit losses was $48.6 billion, an increase of $21.7 billion compared to 2008, reflecting deterioration in the economy and housing markets which drove higher credit costs in both the
consumer and commercial portfolios. Higher reserve additions resulted from further deterioration in the purchased impaired consumer portfolios obtained through acquisitions, broad-based deterioration in the core commercial portfolio and the impact of deterioration in the housing markets on the residential mortgage portfolio.
Noninterest expense increased to $66.7 billion compared with $41.5 billion in 2008. Personnel costs and other general operating expenses rose due to the addition of Merrill Lynch and the full-year impact of Countrywide. Pre-tax merger and restructuring charges rose to $2.7 billion from $935 million a year earlier due to the acquisition of Merrill Lynch.
For the year, we recognized a tax benefit of $1.9 billion compared with tax expense of $420 million in 2008. The decrease in tax expense was due to certain tax benefits, as well as a shift in the geographic mix of the Corporation's earnings driven by the addition of Merrill Lynch.
TARP Repayment
In efforts to help stabilize financial institutions, in October 2008, the U.S. Department of the Treasury (U.S. Treasury) created the TARP to invest in certain eligible financial institutions in the form of non-voting, senior preferred stock. We participated in the TARP by issuing to the U.S. Treasury non-voting perpetual preferred stock (TARP Preferred Stock) and warrants for a total of $45.0 billion. On December 2, 2009, the Corporation received approval from the U.S. Treasury and the Federal Reserve to repay the $45.0 billion investment. In accordance with the approval, on December 9, 2009, we repurchased all shares of the TARP Preferred Stock by using $25.7 billion from excess liquidity and $19.3 billion in proceeds from the sale of 1.3 billion units of Common Equivalent Securities (CES) valued at $15.00 per unit. In addition, the Corporation agreed to increase equity by $3.0 billion through asset sales in 2010 and approximately $1.7 billion through the issuance in 2010 of restricted stock in lieu of a portion of incentive cash compensation to certain of the Corporation's associates as part of their 2009 year-end performance award. As a result of repurchasing the TARP Preferred Stock, the Corporation accelerated the remaining accretion of the issuance discount on the TARP Preferred Stock of $4.0 billion and recorded a corresponding charge to retained earnings and income (loss) applicable to common shareholders in the calculation of diluted earnings per common share. While participating in the TARP, we recorded $7.4 billion in dividends and accretion, including $2.7 billion in cash dividends and $4.7 billion of accretion on the TARP Preferred Stock (the remaining accretion of $4.0 billion was included as part of the $45.0 billion cash payment). Repayment will save us approximately $3.6 billion in annual dividends, including $2.9 billion in cash and $720 million of discount accretion. At the time we repurchased the TARP Preferred Stock, we did not repurchase the related warrants. The U.S. Treasury recently announced its intention to auction, during March 2010, these warrants.
We issued the CES, which qualify as Tier 1 common capital, because we did not have a sufficient number of authorized common shares available for issuance at the time we repaid the TARP Preferred Stock. Each CES consisted of one depositary share representing a 1/1000th interest in a share of our Common Equivalent Junior Preferred Stock, Series S (Common Equivalent Stock) and a contingent warrant to purchase 0.0467 of a share of our common stock for a purchase price of $0.01 per share. The Corporation held a special meeting of shareholders on February 23, 2010 at which we obtained stockholder approval of an amendment to our amended and restated certificate of incorporation to increase the number of authorized shares of our common stock, and following the effective date of the amendment, on February 24, 2010, the Common Equivalent Stock converted in full into our common stock and the contingent warrants expired without having become exercisable and the CES ceased to exist.
| 18 | Bank of America 2009 |
Recent Accounting Developments
On January 1, 2010, the Corporation adopted new Financial Accounting Standards Board (FASB) guidance that results in the consolidation of entities that were off-balance sheet as of December 31, 2009. The adoption of this new accounting guidance resulted in a net incremental increase in assets on January 1, 2010, on a preliminary basis, of $100 billion, including $70 billion resulting from consolidation of credit card trusts and $30 billion from consolidation of other special purpose entities including multi-
seller conduits. These preliminary amounts are net of retained interests in securitizations held on our balance sheet and an $11 billion increase in the allowance for loan losses, the majority of which relates to credit card receivables. This increase in the allowance for loan losses was recorded on January 1, 2010 as a charge net-of-tax to retained earnings for the cumulative effect of the adoption of this new accounting guidance. Initial recording of these assets and related allowance and liabilities on the Corporation's balance sheet had no impact on results of operations.
Segment Results
Table 2 Business Segment Results
| Total Revenue (1) | Net Income (Loss) | |||||||||||||||||
| (Dollars in millions) | 2009 | 2008 | 2009 | 2008 | ||||||||||||||
Deposits | $ | 14,008 | $ | 17,840 | $ | 2,506 | $ | 5,512 | ||||||||||
Global Card Services (2) | 29,342 | 31,220 | (5,555 | ) | 1,234 | |||||||||||||
Home Loans & Insurance | 16,902 | 9,310 | (3,838 | ) | (2,482 | ) | ||||||||||||
Global Banking | 23,035 | 16,796 | 2,969 | 4,472 | ||||||||||||||
Global Markets | 20,626 | (3,831 | ) | 7,177 | (4,916 | ) | ||||||||||||
Global Wealth & Investment Management | 18,123 | 7,809 | 2,539 | 1,428 | ||||||||||||||
All Other (2) | (1,092 | ) | (5,168 | ) | 478 | (1,240 | ) | |||||||||||
Total FTE basis | 120,944 | 73,976 | 6,276 | 4,008 | ||||||||||||||
FTE adjustment | (1,301 | ) | (1,194 | ) | – | – | ||||||||||||
Total Consolidated | $ | 119,643 | $ | 72,782 | $ | 6,276 | $ | 4,008 | ||||||||||
| (1) | Total revenue is net of interest expense, and is on a FTE basis for the business segments and All Other . |
| (2) | Global Card Services is presented on a managed basis with a corresponding offset recorded in All Other . |
Deposits net income narrowed due to declines in net revenue and increased noninterest expense. Net revenue declined mainly due to a lower net interest income allocation from ALM activities and spread compression as interest rates declined. This decrease was partially offset by growth in average deposits on strong organic growth and the migration of certain client deposits from GWIM partially offset by an expected decline in higher-yielding Countrywide deposits. Noninterest expense increased as a result of higher Federal Deposit Insurance Corporation (FDIC) insurance and special assessment costs.
Global Card Services reported a net loss as credit costs continued to rise reflecting weak economies in the U.S., Europe and Canada. Managed net revenue declined mainly due to lower fee income driven by changes in consumer retail purchase and payment behavior in the current economic environment and the absence of one-time gains that positively impacted 2008 results. The decline was partially offset by higher net interest income as lower funding costs outpaced the decline in average managed loans. Provision for credit losses increased as economic conditions led to higher losses.
Home Loans & Insurance net loss widened as higher credit costs continued to negatively impact results. Net revenue and noninterest expense increased primarily driven by the full-year impact of Countrywide and higher loan production from increased refinance activity. Provision for credit losses increased driven by continued economic and housing market weakness combined with further deterioration in the purchased impaired portfolio.
Global Banking net income declined as increases in revenue driven by strong deposit growth, the impact of the Merrill Lynch acquisition and favorable market conditions for debt and equity issuances were more than offset by increased credit costs. Provision for credit losses increased driven by higher net charge-offs and reserve additions in the
commercial real estate and commercial – domestic portfolios. These increases reflect deterioration across a broad range of property types, industries and borrowers. Noninterest expense increased as a result of the Merrill Lynch acquisition, and higher FDIC insurance and special assessment costs.
Global Markets net income increased driven by the addition of Merrill Lynch and a more favorable trading environment. Net revenue increased due to improved market conditions and new issuance capabilities due to the addition of Merrill Lynch driving increased fixed income, currency and commodity, and equity revenues. In addition, improved market conditions led to significantly lower write-downs on legacy assets compared with the prior year.
GWIM net income increased driven by the addition of Merrill Lynch partially offset by a lower net interest income allocation from ALM activities, the migration of client balances to Deposits and Home Loans & Insurance, lower average equity market levels and higher credit costs. Net revenue more than doubled as a result of higher investment and brokerage services income due to the addition of Merrill Lynch, the gain on our investment in BlackRock and the lower level of support we provided for certain cash funds. Provision for credit losses increased driven by higher net charge-offs in the consumer real estate and commercial portfolios.
All Other net income increased driven by higher equity investment income and increased gains on the sale of debt securities partially offset by negative credit valuation adjustments on certain Merrill Lynch structured notes as credit spreads improved. Results were also impacted by lower other-than-temporary impairment charges primarily related to non-agency CMOs. Excluding the securitization impact to show Global Card Services on a managed basis, the provision for credit losses increased due to higher credit costs related to our ALM residential mortgage portfolio.
| Bank of America 2008 | 19 |
Financial Highlights
Net Interest Income
Net interest income on a FTE basis increased $1.9 billion to $48.4 billion for 2009 compared to 2008. The increase was driven by the improved interest rate environment, improved hedge results, the acquisitions of Countrywide and Merrill Lynch, the impact of new draws on previously securitized accounts and the contribution from market-based net interest income related to our Global Markets business which benefited from the Merrill Lynch acquisition. These items were partially offset by the impact of deleveraging the ALM portfolio earlier in 2009, lower consumer loan levels and the adverse impact of nonperforming loans. The net interest yield on a FTE basis decreased 33 bps to 2.65 percent for 2009 compared to 2008 due to the factors related to the core businesses as described above. For more information on net interest income on a FTE basis, see Tables I and II beginning on page 95.
Noninterest Income
Table 3 Noninterest Income
| (Dollars in millions) | 2009 | 2008 | ||||||
Card income | $ | 8,353 | $ | 13,314 | ||||
Service charges | 11,038 | 10,316 | ||||||
Investment and brokerage services | 11,919 | 4,972 | ||||||
Investment banking income | 5,551 | 2,263 | ||||||
Equity investment income | 10,014 | 539 | ||||||
Trading account profits (losses) | 12,235 | (5,911 | ) | |||||
Mortgage banking income | 8,791 | 4,087 | ||||||
Insurance income | 2,760 | 1,833 | ||||||
Gains on sales of debt securities | 4,723 | 1,124 | ||||||
Other income (loss) | (14 | ) | (1,654 | ) | ||||
Net impairment losses recognized in earnings on available-for-sale debt securities | (2,836 | ) | (3,461 | ) | ||||
Total noninterest income | $ | 72,534 | $ | 27,422 | ||||
Noninterest income increased $45.1 billion to $72.5 billion in 2009 compared to 2008.
| • | Card income on a held basis decreased $5.0 billion primarily due to higher credit losses on securitized credit card loans and lower fee income which was driven by changes in consumer retail purchase and payment behavior in the current economic environment. |
| • | Service charges grew $722 million due to the acquisition of Merrill Lynch. |
| • | Investment and brokerage services increased $6.9 billion primarily due to the acquisition of Merrill Lynch partially offset by the impact of lower valuations in the equity markets driven by the market downturn in the fourth quarter of 2008, which improved modestly in 2009, and net outflows in the cash funds. |
| • | Investment banking income increased $3.3 billion due to higher debt, equity and advisory fees reflecting the increased size of the investment banking platform from the acquisition of Merrill Lynch. |
| • | Equity investment income increased $9.5 billion driven by $7.3 billion in gains on sales of portions of our CCB investment and a $1.1 billion gain related to our BlackRock investment. The results were partially offset by the absence of the Visa-related gain recorded during the prior year. |
| • | Trading account profits (losses) increased $18.1 billion primarily driven by favorable core trading results and reduced write-downs on legacy |
assets partially offset by negative credit valuation adjustments on derivative liabilities of $801 million due to improvement in the Corporation's credit spreads. |
| • | Mortgage banking income increased $4.7 billion driven by higher production and servicing income of $3.2 billion and $1.5 billion. These increases were primarily due to increased volume as a result of the full-year impact of Countrywide and higher refinance activity partially offset by lower MSR results, net of hedges. |
| • | Insurance income increased $927 million due to the full-year impact of Countrywide's property and casualty businesses. |
| • | Gains on sales of debt securities increased $3.6 billion due to the favorable interest rate environment and improved credit spreads. Gains were primarily driven by sales of agency MBS and CMOs. |
| • | The net loss in other decreased $1.6 billion primarily due to the $3.8 billion gain from the contribution of our merchant processing business to a joint venture, reduced support provided to cash funds and lower write-downs on legacy assets offset by negative credit valuation adjustments recorded on Merrill Lynch structured notes of $4.9 billion. |
| • | Net impairment losses recognized in earnings on available-for-sale (AFS) debt securities decreased $625 million driven by lower collateralized debt obligation (CDO) related impairment losses partially offset by higher impairment losses on non-agency CMOs. |
Provision for Credit Losses
The provision for credit losses increased $21.7 billion to $48.6 billion for 2009 compared to 2008.
The consumer portion of the provision for credit losses increased $15.1 billion to $36.9 billion for 2009 compared to 2008. The increase was driven by higher net charge-offs in our consumer real estate, consumer credit card and consumer lending portfolios reflecting deterioration in the economy and housing markets. In addition to higher net charge-offs, the provision increase was also driven by higher reserve additions for deterioration in the purchased impaired and residential mortgage portfolios, new draws on previously securitized accounts as well as an approximate $800 million addition to increase the reserve coverage to approximately 12 months of charge-offs in consumer credit card. These increases were partially offset by lower reserve additions in our unsecured domestic consumer lending portfolios resulting from improved delinquencies and in the home equity portfolio due to the slowdown in the pace of deterioration. In the Countrywide and Merrill Lynch consumer purchased impaired portfolios, the additions to reserves to reflect further reductions in expected principal cash flows were $3.5 billion in 2009 compared to $750 million in 2008. The increase was primarily related to the home equity purchased impaired portfolio.
The commercial portion of the provision for credit losses including the provision for unfunded lending commitments increased $6.7 billion to $11.7 billion for 2009 compared to 2008. The increase was driven by higher net charge-offs and higher additions to the reserves in the commercial real estate and commercial – domestic portfolios reflecting deterioration across a broad range of property types, industries and borrowers. These increases were partially offset by lower reserve additions in the small business portfolio due to improved delinquencies.
Net charge-offs totaled $33.7 billion, or 3.58 percent of average loans and leases for 2009 compared with $16.2 billion, or 1.79 percent for 2008. The increased level of net charge-offs is a result of the same factors noted above.
| 20 | Bank of America 2009 |
Noninterest Expense
Table 4 Noninterest Expense
| (Dollars in millions) | 2009 | 2008 | ||||
Personnel | $ | 31,528 | $ | 18,371 | ||
Occupancy | 4,906 | 3,626 | ||||
Equipment | 2,455 | 1,655 | ||||
Marketing | 1,933 | 2,368 | ||||
Professional fees | 2,281 | 1,592 | ||||
Amortization of intangibles | 1,978 | 1,834 | ||||
Data processing | 2,500 | 2,546 | ||||
Telecommunications | 1,420 | 1,106 | ||||
Other general operating | 14,991 | 7,496 | ||||
Merger and restructuring charges | 2,721 | 935 | ||||
Total noninterest expense | $ | 66,713 | $ | 41,529 | ||
Noninterest expense increased $25.2 billion to $66.7 billion for 2009 compared to 2008. Personnel costs and other general operating expenses rose due to the addition of Merrill Lynch and the full-year impact of Countrywide. Personnel expense rose due to increased revenue and the impacts of Merrill Lynch and Countrywide partially offset by a change in compensation that delivers a greater portion of incentive pay over time. Additionally, noninterest expense increased due to higher litigation costs compared to the prior year, a $425 million pre-tax charge to pay the U.S. government to terminate its asset guarantee term sheet and higher FDIC insurance costs including a $724 million special assessment in 2009.
Income Tax Expense
Income tax benefit was $1.9 billion for 2009 compared to expense of $420 million for 2008 and resulted in an effective tax rate of (44.0) percent compared to 9.5 percent in the prior year. The change in the effective tax rate from the prior year was due to increased permanent tax preference items as well as a shift in the geographic mix of our earnings driven by the addition of Merrill Lynch. Significant permanent tax preference items for 2009 included the reversal of part of a valuation allowance provided for acquired capital loss carryforward tax benefits, annually recurring tax-exempt income and tax credits, a loss on certain foreign subsidiary stock and the effect of audit settlements.
We acquired with Merrill Lynch a deferred tax asset related to a federal capital loss carryforward against which a valuation allowance was recorded at the date of acquisition. In 2009, we recognized substantial capital gains, against which a portion of the capital loss carryforward was utilized.
The income of certain foreign subsidiaries has not been subject to U.S. income tax as a result of long-standing deferral provisions applicable to active finance income. These provisions expired for taxable years beginning on or after January 1, 2010. On December 9, 2009, the U.S. House of Representatives passed a bill that would have extended these provisions as well as certain other expiring tax provisions through December 31, 2010. Absent an extension of these provisions, this active financing income earned by foreign subsidiaries after January 1, 2010 will generally be subject to a tax provision that considers the incremental U.S. income tax. The impact of the expiration of these provisions would depend upon the amount, composition and geographic mix of our future earnings and could increase our annual income tax expense by up to $1.0 billion. For more information on income tax expense, see Note 19 – Income Taxes to the Consolidated Financial Statements.
| Bank of America 2009 | 21 |
Balance Sheet Analysis
Table 5 Selected Balance Sheet Data
| December 31 | Average Balance | |||||||||||||
| (Dollars in millions) | 2009 | 2008 | 2009 | 2008 | ||||||||||
Assets | ||||||||||||||
Federal funds sold and securities borrowed or purchased under agreements to resell | $ | 189,933 | $ | 82,478 | $ | 235,764 | $ | 128,053 | ||||||
Trading account assets | 182,206 | 134,315 | 217,048 | 186,579 | ||||||||||
Debt securities | 311,441 | 277,589 | 271,048 | 250,551 | ||||||||||
Loans and leases | 900,128 | 931,446 | 948,805 | 910,878 | ||||||||||
All other assets (1) | 639,591 | 392,115 | 764,852 | 367,918 | ||||||||||
Total assets | $ | 2,223,299 | $ | 1,817,943 | $ | 2,437,517 | $ | 1,843,979 | ||||||
Liabilities | ||||||||||||||
Deposits | $ | 991,611 | $ | 882,997 | $ | 980,966 | $ | 831,144 | ||||||
Federal funds purchased and securities loaned or sold under agreements to repurchase | 255,185 | 206,598 | 369,863 | 272,981 | ||||||||||
Trading account liabilities | 65,432 | 51,723 | 72,207 | 72,915 | ||||||||||
Commercial paper and other short-term borrowings | 69,524 | 158,056 | 118,781 | 182,729 | ||||||||||
Long-term debt | 438,521 | 268,292 | 446,634 | 231,235 | ||||||||||
All other liabilities | 171,582 | 73,225 | 204,421 | 88,144 | ||||||||||
Total liabilities | 1,991,855 | 1,640,891 | 2,192,872 | 1,679,148 | ||||||||||
Shareholders' equity | 231,444 | 177,052 | 244,645 | 164,831 | ||||||||||
Total liabilities and shareholders' equity | $ | 2,223,299 | $ | 1,817,943 | $ | 2,437,517 | $ | 1,843,979 | ||||||
| (1) | All other assets are presented net of allowance for loan and lease losses for the year-end and average balances. |
At December 31, 2009, total assets were $2.2 trillion, an increase of $405.4 billion, or 22 percent, from December 31, 2008. Average total assets in 2009 increased $593.5 billion, or 32 percent, from 2008. The increases in year-end and average total assets were primarily attributable to the acquisition of Merrill Lynch, which impacted virtually all categories, but particularly federal funds sold and securities borrowed or purchased under agreements to resell, trading account assets, and debt securities. Cash and cash equivalents, which are included in all other assets in the table above, increased due to our strengthened liquidity and capital position. Partially offsetting these increases was a decrease in year-end loans and leases primarily attributable to customer payments, reduced demand and charge-offs.
At December 31, 2009, total liabilities were $2.0 trillion, an increase of $351.0 billion, or 21 percent, from December 31, 2008. Average total liabilities for 2009 increased $513.7 billion, or 31 percent, from 2008. The increases in year-end and average total liabilities were attributable to the acquisition of Merrill Lynch which impacted virtually all categories, but particularly federal funds purchased and securities loaned or sold under agreements to repurchase, long-term debt and other liabilities. In addition to the impact of Merrill Lynch, deposits increased as we benefited from higher savings and movement into more liquid products due to the low rate environment. Partially offsetting these increases was a decrease in commercial paper and other short-term borrowings due in part to lower Federal Home Loan Bank (FHLB) borrowings.
Federal Funds Sold and Securities Borrowed or Purchased Under Agreements to Resell
Federal funds transactions involve lending reserve balances on a short-term basis. Securities borrowed and securities purchased under agreements to resell are utilized to accommodate customer transactions, earn interest rate spreads and obtain securities for settlement. Year-end and average federal funds sold and securities borrowed or purchased under agreements to resell increased $107.5 billion and $107.7 billion in 2009, attributable primarily to the acquisition of Merrill Lynch.
Trading Account Assets
Trading account assets consist primarily of fixed income securities (including government and corporate debt), equity and convertible instruments. Year-end and average trading account assets increased $47.9 billion and $30.5 billion in 2009, attributable primarily to the acquisition of Merrill Lynch.
Debt Securities
Debt securities include U.S. Treasury and agency securities, MBS, principally agency MBS, foreign bonds, corporate bonds and municipal debt. We use the debt securities portfolio primarily to manage interest rate and liquidity risk and to take advantage of market conditions that create more economically attractive returns on these investments. The year-end and average balances of debt securities increased $33.9 billion and $20.5 billion from 2008 due to net purchases of securities and the impact of the acquisition of Merrill Lynch. For additional information on our AFS debt securities, see Market Risk Management – Securities beginning on page 84 and Note 5 – Securities to the Consolidated Financial Statements.
Loans and Leases
Year-end loans and leases decreased $31.3 billion to $900.1 billion in 2009 compared to 2008 primarily due to lower commercial loans as the result of customer payments and reduced demand, lower customer merger and acquisition activity, and net charge-offs, partially offset by the addition of Merrill Lynch. Average loans and leases increased $37.9 billion to $948.8 billion in 2009 compared to 2008 primarily due to the addition of Merrill Lynch, and the full-year impact of Countrywide. The average consumer loan portfolio increased $24.4 billion due to the addition of Merrill Lynch domestic and foreign securities-based lending margin loans, Merrill Lynch consumer real estate balances, and the full-year impact of Countrywide, partially offset by lower balance sheet retention, sales and conversions of residential mortgages into retained MBS and net charge-offs. The average commercial loan and lease portfolio increased $13.5 billion primarily due to the acquisition of Merrill Lynch. For a more detailed discussion of the loan portfolio, see Credit Risk Management beginning on page 54, and Note 6 – Outstanding Loans and Leases to the Consolidated Financial Statements.
| 22 | Bank of America 2009 |
All Other Assets
Year-end and average all other assets increased $247.5 billion and $396.9 billion at December 31, 2009 driven primarily by the acquisition of Merrill Lynch, which impacted various line items, including derivative assets. In addition, the increase was driven by higher cash and cash equivalents due to our strengthened liquidity and capital position.
Deposits
Year-end and average deposits increased $108.6 billion to $991.6 billion and $149.8 billion to $981.0 billion in 2009 compared to 2008. The increases were in domestic interest-bearing deposits and noninterest-bearing deposits. Partially offsetting these increases was a decrease in foreign interest-bearing deposits. We categorize our deposits as core and market-based deposits. Core deposits exclude negotiable CDs, public funds, other domestic time deposits and foreign interest-bearing deposits. Average core deposits increased $164.4 billion, or 24 percent, to $861.3 billion in 2009 compared to 2008. The increase was attributable to growth in our average NOW and money market accounts and IRAs and noninterest-bearing deposits due to higher savings, the consumer flight-to-safety and movement into more liquid products due to the low rate environment. Average market-based deposit funding decreased $14.6 billion to $119.7 billion in 2009 compared to 2008 due primarily to a decrease in deposits in banks located in foreign countries.
Federal Funds Purchased and Securities Loaned or Sold Under Agreements to Repurchase
Federal funds transactions involve borrowing reserve balances on a short-term basis. Securities loaned and securities sold under agreements to repurchase are collateralized financing transactions utilized to accommodate customer transactions, earn interest rate spreads and finance inventory positions. Year-end and average federal funds purchased and securities loaned or sold under agreements to repurchase increased $48.6 billion and $96.9 billion primarily due to the Merrill Lynch acquisition.
Trading Account Liabilities
Trading account liabilities consist primarily of short positions in fixed income securities (including government and corporate debt), equity and
convertible instruments. Year-end trading account liabilities increased $13.7 billion in 2009, attributable primarily to increases in equity securities and foreign sovereign debt.
Commercial Paper and Other Short-term Borrowings
Commercial paper and other short-term borrowings provide a funding source to supplement deposits in our ALM strategy. Year-end and average commercial paper and other short-term borrowings decreased $88.5 billion to $69.5 billion and $63.9 billion to $118.8 billion in 2009 compared to 2008 due, in part, to lower FHLB balances as a result of our strong liquidity position.
Long-term Debt
Year-end and average long-term debt increased $170.2 billion to $438.5 billion and $215.4 billion to $446.6 billion in 2009 compared to 2008. The increases were attributable to issuances and the addition of long-term debt associated with the Merrill Lynch acquisition. For additional information on long-term debt, see Note 13 – Long-term Debt to the Consolidated Financial Statements.
All Other Liabilities
Year-end and average all other liabilities increased $98.4 billion and $116.3 billion at December 31, 2009 driven primarily by the acquisition of Merrill Lynch, which impacted various line items, including derivative liabilities.
Shareholders' Equity
Year-end and average shareholders' equity increased $54.4 billion and $79.8 billion due to a common stock offering of $13.5 billion, $29.1 billion of common and preferred stock issued in connection with the Merrill Lynch acquisition, the issuance of CES of $19.2 billion, an increase in accumulated other comprehensive income (OCI) and net income. These increases were partially offset by repayment of TARP Preferred Stock of $45.0 billion, $30.0 billion of which was issued in early 2009, and higher preferred stock dividend payments. The increase in accumulated OCI was due to unrealized gains on AFS debt and marketable equity securities. Average shareholders' equity was also impacted by the issuance of preferred stock and common stock warrants of $30.0 billion in early 2009. This preferred stock was part of the TARP repayment in December 2009.
| Bank of America 2009 | 23 |
Table 6 Five Year Summary of Selected Financial Data
| (Dollars in millions, except per share information) | 2009 | 2008 | 2007 | 2006 | 2005 | |||||||||||||||
Income statement | ||||||||||||||||||||
Net interest income | $ | 47,109 | $ | 45,360 | $ | 34,441 | $ | 34,594 | $ | 30,737 | ||||||||||
Noninterest income | 72,534 | 27,422 | 32,392 | 38,182 | 26,438 | |||||||||||||||
Total revenue, net of interest expense | 119,643 | 72,782 | 66,833 | 72,776 | 57,175 | |||||||||||||||
Provision for credit losses | 48,570 | 26,825 | 8,385 | 5,010 | 4,014 | |||||||||||||||
Noninterest expense, before merger and restructuring charges | 63,992 | 40,594 | 37,114 | 34,988 | 28,269 | |||||||||||||||
Merger and restructuring charges | 2,721 | 935 | 410 | 805 | 412 | |||||||||||||||
Income before income taxes | 4,360 | 4,428 | 20,924 | 31,973 | 24,480 | |||||||||||||||
Income tax expense (benefit) | (1,916 | ) | 420 | 5,942 | 10,840 | 8,015 | ||||||||||||||
Net income | 6,276 | 4,008 | 14,982 | 21,133 | 16,465 | |||||||||||||||
Net income (loss) applicable to common shareholders | (2,204 | ) | 2,556 | 14,800 | 21,111 | 16,447 | ||||||||||||||
Average common shares issued and outstanding (in thousands) | 7,728,570 | 4,592,085 | 4,423,579 | 4,526,637 | 4,008,688 | |||||||||||||||
Average diluted common shares issued and outstanding (in thousands) | 7,728,570 | 4,596,428 | 4,463,213 | 4,580,558 | 4,060,358 | |||||||||||||||
Performance ratios | ||||||||||||||||||||
Return on average assets | 0.26 | % | 0.22 | % | 0.94 | % | 1.44 | % | 1.30 | % | ||||||||||
Return on average common shareholders' equity | n/m | 1.80 | 11.08 | 16.27 | 16.51 | |||||||||||||||
Return on average tangible common shareholders' equity (1) | n/m | 4.72 | 26.19 | 38.23 | 31.80 | |||||||||||||||
Return on average tangible shareholders' equity (1) | 4.18 | 5.19 | 25.13 | 37.80 | 31.67 | |||||||||||||||
Total ending equity to total ending assets | 10.41 | 9.74 | 8.56 | 9.27 | 7.86 | |||||||||||||||
Total average equity to total average assets | 10.04 | 8.94 | 8.53 | 8.90 | 7.86 | |||||||||||||||
Dividend payout | n/m | n/m | 72.26 | 45.66 | 46.61 | |||||||||||||||
Per common share data | ||||||||||||||||||||
Earnings (loss) | $ | (0.29 | ) | $ | 0.54 | $ | 3.32 | $ | 4.63 | $ | 4.08 | |||||||||
Diluted earnings (loss) | (0.29 | ) | 0.54 | 3.29 | 4.58 | 4.02 | ||||||||||||||
Dividends paid | 0.04 | 2.24 | 2.40 | 2.12 | 1.90 | |||||||||||||||
Book value | 21.48 | 27.77 | 32.09 | 29.70 | 25.32 | |||||||||||||||
Tangible book value (1) | 11.94 | 10.11 | 12.71 | 13.26 | 13.51 | |||||||||||||||
Market price per share of common stock | ||||||||||||||||||||
Closing | $ | 15.06 | $ | 14.08 | $ | 41.26 | $ | 53.39 | $ | 46.15 | ||||||||||
High closing | 18.59 | 45.03 | 54.05 | 54.90 | 47.08 | |||||||||||||||
Low closing | 3.14 | 11.25 | 41.10 | 43.09 | 41.57 | |||||||||||||||
Market capitalization | $ | 130,273 | $ | 70,645 | $ | 183,107 | $ | 238,021 | $ | 184,586 | ||||||||||
Average balance sheet | ||||||||||||||||||||
Total loans and leases | $ | 948,805 | $ | 910,878 | $ | 776,154 | $ | 652,417 | $ | 537,218 | ||||||||||
Total assets | 2,437,517 | 1,843,979 | 1,602,073 | 1,466,681 | 1,269,892 | |||||||||||||||
Total deposits | 980,966 | 831,144 | 717,182 | 672,995 | 632,432 | |||||||||||||||
Long-term debt | 446,634 | 231,235 | 169,855 | 130,124 | 97,709 | |||||||||||||||
Common shareholders' equity | 182,288 | 141,638 | 133,555 | 129,773 | 99,590 | |||||||||||||||
Total shareholders' equity | 244,645 | 164,831 | 136,662 | 130,463 | 99,861 | |||||||||||||||
Asset quality (2) | ||||||||||||||||||||
Allowance for credit losses (3) | $ | 38,687 | $ | 23,492 | $ | 12,106 | $ | 9,413 | $ | 8,440 | ||||||||||
Nonperforming loans, leases and foreclosed properties (4) | 35,747 | 18,212 | 5,948 | 1,856 | 1,603 | |||||||||||||||
Allowance for loan and lease losses as a percentage of total loans and leases outstanding ( 4 ) | 4.16 | % | 2.49 | % | 1.33 | % | 1.28 | % | 1.40 | % | ||||||||||
Allowance for loan and lease losses as a percentage of total nonperforming loans and leases ( 4 ) | 111 | 141 | 207 | 505 | 532 | |||||||||||||||
Net charge-offs | $ | 33,688 | $ | 16,231 | $ | 6,480 | $ | 4,539 | $ | 4,562 | ||||||||||
Net charge-offs as a percentage of average loans and | 3.58 | % | 1.79 | % | 0.84 | % | 0.70 | % | 0.85 | % | ||||||||||
Nonperforming loans and leases as a percentage of total loans and leases outstanding ( 4 ) | 3.75 | 1.77 | 0.64 | 0.25 | 0.26 | |||||||||||||||
Nonperforming loans, leases and foreclosed properties as a percentage of total loans, leases and foreclosed properties ( 4 ) | 3.98 | 1.96 | 0.68 | 0.26 | 0.28 | |||||||||||||||
Ratio of the allowance for loan and lease losses at December 31 to net charge-offs | 1.10 | 1.42 | 1.79 | 1.99 | 1.76 | |||||||||||||||
Capital ratios (year end) | ||||||||||||||||||||
Risk-based capital: | ||||||||||||||||||||
Tier 1 common | 7.81 | % | 4.80 | % | 4.93 | % | 6.82 | % | 6.80 | % | ||||||||||
Tier 1 | 10.40 | 9.15 | 6.87 | 8.64 | 8.25 | |||||||||||||||
Total | 14.66 | 13.00 | 11.02 | 11.88 | 11.08 | |||||||||||||||
Tier 1 leverage | 6.91 | 6.44 | 5.04 | 6.36 | 5.91 | |||||||||||||||
Tangible equity (1) | 6.42 | 5.11 | 3.73 | 4.47 | 4.36 | |||||||||||||||
Tangible common equity (1) | 5.57 | 2.93 | 3.46 | 4.27 | 4.34 | |||||||||||||||
| (1) | Tangible equity ratios and tangible book value per share of common stock are non-GAAP measures. Other companies may define or calculate these measures differently. For additional information on these ratios and a corresponding reconciliation to GAAP financial measures, see Supplemental Financial Data beginning on page 25. |
| (2) | For more information on the impact of the purchased impaired loan portfolio on asset quality, see Consumer Portfolio Credit Risk Management beginning on page 54 and Commercial Portfolio Credit Risk Management beginning on page 64. |
| (3) | Includes the allowance for loan and lease losses and the reserve for unfunded lending commitments. |
| (4) | Balances and ratios do not include loans accounted for under the fair value option. |
| n/m | = not meaningful |
| 24 | Bank of America 2009 |
Supplemental Financial Data
Table 7 provides a reconciliation of the supplemental financial data mentioned below with financial measures defined by generally accepted accounting principles in the United States of America (GAAP). Other companies may define or calculate supplemental financial data differently.
We view net interest income and related ratios and analyses (i.e., efficiency ratio and net interest yield) on a FTE basis. Although this is a non-GAAP measure, we believe managing the business with net interest income on a FTE basis provides a more accurate picture of the interest margin for comparative purposes. To derive the FTE basis, net interest income is adjusted to reflect tax-exempt income on an equivalent before-tax basis with a corresponding increase in income tax expense. For purposes of this calculation, we use the federal statutory tax rate of 35 percent. This measure ensures comparability of net interest income arising from taxable and tax-exempt sources.
As mentioned above, certain performance measures including the efficiency ratio and net interest yield utilize net interest income (and thus total revenue) on a FTE basis. The efficiency ratio measures the costs expended to generate a dollar of revenue, and net interest yield evaluates how many bps we are earning over the cost of funds. During our annual planning process, we set efficiency targets for the Corporation and each line of business. We believe the use of this non-GAAP measure provides additional clarity in assessing our results. Targets vary by year and by business, and are based on a variety of factors including maturity of the business, competitive environment, market factors, and other items (e.g., risk appetite).
We also evaluate our business based upon ratios that utilize tangible equity. Return on average tangible common shareholders' equity measures our earnings contribution as a percentage of common shareholders' equity plus CES less goodwill and intangible assets (excluding MSRs), net of related deferred tax liabilities. Return on average tangible shareholders' equity (ROTE) measures our earnings contribution as a percentage of average shareholders' equity reduced by goodwill and intangible assets (excluding MSRs), net of related deferred tax liabilities. The tangible common equity ratio represents common shareholders' equity plus CES less goodwill and intangible assets (excluding MSRs), net of related deferred tax liabilities divided by total assets less goodwill and intangible assets (excluding MSRs), net of related deferred tax liabilities. The tangible equity ratio represents total shareholders' equity less goodwill and intangible assets (excluding MSRs), net of related deferred tax liabilities divided by total assets less goodwill and intangible assets (excluding MSRs), net of related deferred tax liabilities. Tangible book value per common share represents ending common shareholders' equity plus CES less goodwill and intangible assets (excluding MSRs), net of related deferred tax liabilities divided by ending common shares outstanding plus the number of common shares issued upon conversion of CES. These measures are used to evaluate our use of equity (i.e., capital). In addition, profitability, relationship, and investment models all use ROTE as key measures to support our overall growth goals.
The aforementioned performance measures and ratios are presented in Table 6.
| Bank of America 2009 | 25 |
Table 7 Supplemental Financial Data and Reconciliations to GAAP Financial Measures
| (Dollars in millions, shares in thousands) | 2009 | 2008 | 2007 | 2006 | 2005 | |||||||||||||||
FTE basis data | ||||||||||||||||||||
Net interest income | $ | 48,410 | $ | 46,554 | $ | 36,190 | $ | 35,818 | $ | 31,569 | ||||||||||
Total revenue, net of interest expense | 120,944 | 73,976 | 68,582 | 74,000 | 58,007 | |||||||||||||||
Net interest yield | 2.65 | % | 2.98 | % | 2.60 | % | 2.82 | % | 2.84 | % | ||||||||||
Efficiency ratio | 55.16 | 56.14 | 54.71 | 48.37 | 49.44 | |||||||||||||||
Reconciliation of average common shareholders' equity to average tangible common shareholders' equity | ||||||||||||||||||||
Common shareholders' equity | $ | 182,288 | $ | 141,638 | $ | 133,555 | $ | 129,773 | $ | 99,590 | ||||||||||
Common Equivalent Securities | 1,213 | – | – | – | – | |||||||||||||||
Goodwill | (86,034 | ) | (79,827 | ) | (69,333 | ) | (66,040 | ) | (45,331 | ) | ||||||||||
Intangible assets (excluding MSRs) | (12,220 | ) | (9,502 | ) | (9,566 | ) | (10,324 | ) | (3,548 | ) | ||||||||||
Related deferred tax liabilities | 3,831 | 1,782 | 1,845 | 1,809 | 1,014 | |||||||||||||||
Tangible common shareholders' equity | $ | 89,078 | $ | 54,091 | $ | 56,501 | $ | 55,218 | $ | 51,725 | ||||||||||
Reconciliation of average shareholders' equity to average tangible shareholders' equity | ||||||||||||||||||||
Shareholders' equity | $ | 244,645 | $ | 164,831 | $ | 136,662 | $ | 130,463 | $ | 99,861 | ||||||||||
Goodwill | (86,034 | ) | (79,827 | ) | (69,333 | ) | (66,040 | ) | (45,331 | ) | ||||||||||
Intangible assets (excluding MSRs) | (12,220 | ) | (9,502 | ) | (9,566 | ) | (10,324 | ) | (3,548 | ) | ||||||||||
Related deferred tax liabilities | 3,831 | 1,782 | 1,845 | 1,809 | 1,014 | |||||||||||||||
Tangible shareholders' equity | $ | 150,222 | $ | 77,284 | $ | 59,608 | $ | 55,908 | $ | 51,996 | ||||||||||
Reconciliation of year end common shareholders' equity to year end tangible common shareholders' equity | ||||||||||||||||||||
Common shareholders' equity | $ | 194,236 | $ | 139,351 | $ | 142,394 | $ | 132,421 | $ | 101,262 | ||||||||||
Common Equivalent Securities | 19,244 | – | – | – | – | |||||||||||||||
Goodwill | (86,314 | ) | (81,934 | ) | (77,530 | ) | (65,662 | ) | (45,354 | ) | ||||||||||
Intangible assets (excluding MSRs) | (12,026 | ) | (8,535 | ) | (10,296 | ) | (9,422 | ) | (3,194 | ) | ||||||||||
Related deferred tax liabilities | 3,498 | 1,854 | 1,855 | 1,799 | 1,336 | |||||||||||||||
Tangible common shareholders' equity | $ | 118,638 | $ | 50,736 | $ | 56,423 | $ | 59,136 | $ | 54,050 | ||||||||||
Reconciliation of year end shareholders' equity to year end tangible shareholders' equity | ||||||||||||||||||||
Shareholders' equity | $ | 231,444 | $ | 177,052 | $ | 146,803 | $ | 135,272 | $ | 101,533 | ||||||||||
Goodwill | (86,314 | ) | (81,934 | ) | (77,530 | ) | (65,662 | ) | (45,354 | ) | ||||||||||
Intangible assets (excluding MSRs) | (12,026 | ) | (8,535 | ) | (10,296 | ) | (9,422 | ) | (3,194 | ) | ||||||||||
Related deferred tax liabilities | 3,498 | 1,854 | 1,855 | 1,799 | 1,336 | |||||||||||||||
Tangible shareholders' equity | $ | 136,602 | $ | 88,437 | $ | 60,832 | $ | 61,987 | $ | 54,321 | ||||||||||
Reconciliation of year end assets to year end tangible assets | ||||||||||||||||||||
Assets | $ | 2,223,299 | $ | 1,817,943 | $ | 1,715,746 | $ | 1,459,737 | $ | 1,291,803 | ||||||||||
Goodwill | (86,314 | ) | (81,934 | ) | (77,530 | ) | (65,662 | ) | (45,354 | ) | ||||||||||
Intangible assets (excluding MSRs) | (12,026 | ) | (8,535 | ) | (10,296 | ) | (9,422 | ) | (3,194 | ) | ||||||||||
Related deferred tax liabilities | 3,498 | 1,854 | 1,855 | 1,799 | 1,336 | |||||||||||||||
Tangible assets | $ | 2,128,457 | $ | 1,729,328 | $ | 1,629,775 | $ | 1,386,452 | $ | 1,244,591 | ||||||||||
Reconciliation of year end common shares outstanding to year end tangible common shares outstanding | ||||||||||||||||||||
Common shares outstanding | 8,650,244 | 5,017,436 | 4,437,885 | 4,458,151 | 3,999,688 | |||||||||||||||
Assumed conversion of common equivalent shares | 1,286,000 | – | – | – | – | |||||||||||||||
Tangible common shares outstanding | 9,936,244 | 5,017,436 | 4,437,885 | 4,458,151 | 3,999,688 | |||||||||||||||
| 26 | Bank of America 2009 |
Core Net Interest Income – Managed Basis
We manage core net interest income – managed basis, which adjusts reported net interest income on a FTE basis for the impact of market-based activities and certain securitizations, net of retained securities. As discussed in the Global Markets business segment section beginning on page 35, we evaluate our market-based results and strategies on a total market-based revenue approach by combining net interest income and noninterest income for Global Markets. We also adjust for loans that we originated and subsequently sold into credit card securitizations. Noninterest income, rather than net interest income and provision for credit losses, is recorded for assets that have been securitized as we are compensated for servicing the securitized assets and record servicing income and gains or losses on securitizations, where appropriate. We believe the use of this non-GAAP presentation provides additional clarity in managing our results. An analysis of core net interest income – managed basis, core average earning assets – managed basis and core net interest yield on earning assets – managed basis, which adjust for the impact of these two non-core items from reported net interest income on a FTE basis, is shown below.
Core net interest income on a managed basis increased $2.3 billion to $52.8 billion for 2009 compared to 2008. The increase was driven by the favorable interest rate environment and the acquisitions of Merrill Lynch and Countrywide. These items were partially offset by the impact of deleveraging the ALM portfolio earlier in 2009, lower consumer loan levels and the adverse impact of our nonperforming loans. For more information on our nonperforming loans, see Credit Risk Management on page 54.
On a managed basis, core average earning assets increased $130.1 billion to $1.4 trillion for 2009 compared to 2008 primarily due to the acquisitions of Merrill Lynch and Countrywide partially offset by lower loan levels and earlier deleveraging of the AFS debt securities portfolio.
Core net interest yield on a managed basis decreased 19 bps to 3.69 percent for 2009 compared to 2008, primarily due to the addition of lower yielding assets from the Merrill Lynch and Countrywide acquisitions, reduced consumer loan levels and the impact of deleveraging the ALM portfolio earlier in 2009 partially offset by the favorable interest rate environment.
Table 8 Core Net Interest Income – Managed Basis
| (Dollars in millions) | 2009 | 2008 | ||||||
Net interest income (1) | ||||||||
As reported | $ | 48,410 | $ | 46,554 | ||||
Impact of market-based net interest income (2) | (6,119 | ) | (4,939 | ) | ||||
Core net interest income | 42,291 | 41,615 | ||||||
Impact of securitizations (3) | 10,524 | 8,910 | ||||||
Core net interest income – managed basis | $ | 52,815 | $ | 50,525 | ||||
Average earning assets | ||||||||
As reported | $ | 1,830,193 | $ | 1,562,729 | ||||
Impact of market-based earning assets (2) | (481,542 | ) | (360,667 | ) | ||||
Core average earning assets | 1,348,651 | 1,202,062 | ||||||
Impact of securitizations (4) | 83,640 | 100,145 | ||||||
Core average earning assets – managed basis | $ | 1,432,291 | $ | 1,302,207 | ||||
Net interest yield contribution (1) | ||||||||
As reported | 2.65 | % | 2.98 | % | ||||
Impact of market-based activities (2) | 0.49 | 0.48 | ||||||
Core net interest yield on earning assets | 3.14 | 3.46 | ||||||
Impact of securitizations | 0.55 | 0.42 | ||||||
Core net interest yield on earning assets – managed basis | 3.69 | % | 3.88 | % | ||||
| (1) | FTE basis |
| (2) | Represents the impact of market-based amounts included in Global Markets . |
| (3) | Represents the impact of securitizations utilizing actual bond costs. This is different from the business segment view which utilizes funds transfer pricing methodologies. |
| (4) | Represents average securitized loans less accrued interest receivable and certain securitized bonds retained. |
Business Segment Operations
Segment Description and Basis of Presentation
We report the results of our operations through six business segments: Deposits, Global Card Services, Home Loans & Insurance, Global Banking, Global Markets and GWIM , with the remaining operations recorded in All Other . The Corporation may periodically reclassify business segment results based on modifications to its management reporting methodologies and changes in organizational alignment. Prior period amounts have been reclassified to conform to current period presentation.
We prepare and evaluate segment results using certain non-GAAP methodologies and performance measures, many of which are discussed in Supplemental Financial Data beginning on page 25. We begin by evaluating the operating results of the segments which by definition exclude merger and restructuring charges. The segment results also reflect certain revenue and expense methodologies which are utilized to determine
net income. The net interest income of the business segments includes the results of a funds transfer pricing process that matches assets and liabilities with similar interest rate sensitivity and maturity characteristics.
Equity is allocated to business segments and related businesses using a risk-adjusted methodology incorporating each segment's stand-alone credit, market, interest rate and operational risk components. The nature of these risks is discussed further beginning on page 44. The Corporation benefits from the diversification of risk across these components which is reflected as a reduction to allocated equity for each segment. Average equity is allocated to the business segments and is affected by the portion of goodwill that is specifically assigned to them.
For more information on our basis of presentation, selected financial information for the business segments and reconciliations to consolidated total revenue, net income and year-end total assets, see Note 23 – Business Segment Information to the Consolidated Financial Statements.
| Bank of America 2009 | 27 |
Deposits
| (Dollars in millions) | 2009 | 2008 | ||||||
Net interest income (1) | $ | 7,160 | $ | 10,970 | ||||
Noninterest income: | ||||||||
Service charges | 6,802 | 6,801 | ||||||
All other income | 46 | 69 | ||||||
Total noninterest income | 6,848 | 6,870 | ||||||
Total revenue, net of interest expense | 14,008 | 17,840 | ||||||
Provision for credit losses | 380 | 399 | ||||||
Noninterest expense | 9,693 | 8,783 | ||||||
Income before income taxes | 3,935 | 8,658 | ||||||
Income tax expense (1) | 1,429 | 3,146 | ||||||
Net income | $ | 2,506 | $ | 5,512 | ||||
Net interest yield (1) | 1.77 | % | 3.13 | % | ||||
Return on average equity | 10.55 | 22.55 | ||||||
Efficiency ratio (1) | 69.19 | 49.23 | ||||||
Balance Sheet | ||||||||
Average | ||||||||
Total earning assets (2) | $ | 405,563 | $ | 349,930 | ||||
Total assets (2) | 432,268 | 379,067 | ||||||
Total deposits | 406,833 | 357,608 | ||||||
Allocated equity | 23,756 | 24,445 | ||||||
Year end | ||||||||
Total earning assets (2) | $ | 418,156 | $ | 363,334 | ||||
Total assets (2) | 445,363 | 390,487 | ||||||
Total deposits | 419,583 | 375,763 | ||||||
| (1) | FTE basis |
| (2) | Total earning assets and total assets include asset allocations to match liabilities (i.e., deposits). |
Deposits includes the results of consumer deposit activities which consist of a comprehensive range of products provided to consumers and small businesses. In addition, Deposits includes our student lending results and an allocation of ALM activities. In the U.S., we serve approximately 59 million consumer and small business relationships through a franchise that stretches coast to coast through 32 states and the District of Columbia utilizing our network of 6,011 banking centers, 18,262 domestic-branded ATMs, telephone, online and mobile banking channels.
Our deposit products include traditional savings accounts, money market savings accounts, CDs and IRAs, and noninterest- and interest-bearing checking accounts. Deposit products provide a relatively stable source of funding and liquidity. We earn net interest spread revenues from investing this liquidity in earning assets through client-facing lending and ALM activities. The revenue is allocated to the deposit products using our funds transfer pricing process which takes into account the interest rates and maturity characteristics of the deposits. Deposits also generate fees such as account service fees, non-sufficient funds fees, overdraft charges and ATM fees.
During the third quarter of 2009, we announced changes in our overdraft fee policies intended to help customers limit overdraft fees. These changes negatively impacted net revenue beginning in the fourth quarter of 2009. In addition, in November 2009, the Federal Reserve issued Regulation E which will negatively impact future service charge revenue in Deposits . For more information on Regulation E, see Regulatory Overview beginning on page 17.
During 2009, our active online banking customer base grew to 29.6 million subscribers, a net increase of 1.3 million subscribers from December 31, 2008 reflecting our continued focus on increasing the use of alternative banking channels. In addition, our active bill pay users paid $302.4 billion of bills online during 2009 compared to $301.1 billion during 2008.
Deposits includes the net impact of migrating customers and their related deposit balances between GWIM and Deposits . During 2009, total deposits of $43.4 billion were migrated to Deposits from GWIM. Conversely, $20.5 billion of deposits were migrated from Deposits to GWIM during 2008. The directional shift was mainly due to client segmentation threshold changes resulting from the Merrill Lynch acquisition, partially offset by the acceleration in 2008 of movement of clients into GWIM as part of our growth initiatives for our more affluent customers. As of the date of migration, the associated net interest income, service charges and noninterest expense are recorded in the segment to which deposits were transferred.
Net income fell $3.0 billion, or 55 percent, to $2.5 billion as net revenue declined and noninterest expense rose. Net interest income decreased $3.8 billion, or 35 percent, to $7.2 billion as a result of a lower net interest income allocation from ALM activities and spread compression as interest rates declined. Average deposits grew $49.2 billion, or 14 percent, due to strong organic growth and the net migration of certain households' deposits from GWIM . Organic growth was driven by the continuing need of customers to manage their liquidity as illustrated by growth in higher spread deposits from new money as well as movement from certificates of deposits to checking accounts and other products. This increase was partially offset by the expected decline in higher-yielding Countrywide deposits.
Noninterest income was flat at $6.8 billion as service charges remained unchanged for the year. The positive impacts of revenue initiatives were offset by changes in consumer spending behavior attributable to current economic conditions, as well as the negative impact of the implementation in the fourth quarter of 2009 of the new initiatives aimed at assisting customers who are economically stressed by reducing their banking fees.
Noninterest expense increased $910 million, or 10 percent, due to higher FDIC insurance and special assessment costs, partially offset by lower operating costs related to lower transaction volume due to the economy and productivity initiatives.
| 28 | Bank of America 2009 |
Global Card Services
| (Dollars in millions) | 2009 | 2008 | ||||||
Net interest income (1) | $ | 20,264 | $ | 19,589 | ||||
Noninterest income: | ||||||||
Card income | 8,555 | 10,033 | ||||||
All other income | 523 | 1,598 | ||||||
Total noninterest income | 9,078 | 11,631 | ||||||
Total revenue, net of interest expense | 29,342 | 31,220 | ||||||
Provision for credit losses (2) | 30,081 | 20,164 | ||||||
Noninterest expense | 7,961 | 9,160 | ||||||
Income (loss) before income taxes | (8,700 | ) | 1,896 | |||||
Income tax expense (benefit) (1) | (3,145 | ) | 662 | |||||
Net income (loss) | $ | (5,555 | ) | $ | 1,234 | |||
Net interest yield (1) | 9.36 | % | 8.26 | % | ||||
Return on average equity | n/m | 3.15 | ||||||
Efficiency ratio (1) | 27.13 | 29.34 | ||||||
Balance Sheet | ||||||||
Average | ||||||||
Total loans and leases | $ | 216,654 | $ | 236,714 | ||||
Total earning assets | 216,410 | 237,025 | ||||||
Total assets | 232,643 | 258,710 | ||||||
Allocated equity | 41,409 | 39,186 | ||||||
Year end | ||||||||
Total loans and leases | $ | 201,230 | $ | 233,040 | ||||
Total earning assets | 200,988 | 233,094 | ||||||
Total assets | 217,139 | 252,683 | ||||||
| (1) | FTE basis |
| (2) | Represents provision for credit losses on held loans combined with realized credit losses associated with the securitized loan portfolio. |
| n/m | = not meaningful |
Global Card Services provides a broad offering of products, including U.S. consumer and business card, consumer lending, international card and debit card to consumers and small businesses. We provide credit card products to customers in the U.S., Canada, Ireland, Spain and the United Kingdom. We offer a variety of co-branded and affinity credit and debit card products and are one of the leading issuers of credit cards through endorsed marketing in the U.S. and Europe. On May 22, 2009, the CARD Act which calls for a number of changes to credit card industry practices was signed into law. The provisions in the CARD Act are expected to negatively impact net interest income due to the restrictions on our ability to reprice credit cards based on risk, and card income due to restrictions imposed on certain fees. For more information on the CARD Act, see Regulatory Overview beginning on page 17.
The Corporation reports its Global Card Services results on a managed basis which is consistent with the way that management evaluates the results of the business. Managed basis assumes that securitized loans were not sold and presents earnings on these loans in a manner similar to the way loans that have not been sold (i.e., held loans) are
presented. Loan securitization is an alternative funding process that is used by the Corporation to diversify funding sources. Loan securitization removes loans from the Consolidated Balance Sheet through the sale of loans to an off-balance sheet qualifying special purpose entity (QSPE).
Securitized loans continue to be serviced by the business and are subject to the same underwriting standards and ongoing monitoring as held loans. In addition, excess servicing income is exposed to similar credit risk and repricing of interest rates as held loans. Starting late in the third quarter of 2008 and continuing into the first quarter of 2009, liquidity for asset-backed securitizations became disrupted and spreads rose to historic highs which negatively impacted our credit card securitization programs. Beginning in the second quarter of 2009, conditions started to improve with spreads narrowing and liquidity returning to the marketplace, however, we did not return to the credit card securitization market during 2009. For more information, see the Liquidity Risk and Capital Management discussion beginning on page 47.
Global Card Services recorded a net loss of $5.6 billion in 2009 compared to net income of $1.2 billion in 2008 due to higher provision for credit losses as credit costs continued to rise driven by weak economies in the U.S., Europe and Canada. Managed net revenue declined $1.9 billion to $29.3 billion in 2009 driven by lower noninterest income partially offset by growth in net interest income.
Net interest income grew to $20.3 billion in 2009 from $19.6 billion in 2008 driven by increased loan spreads due to the beneficial impact of lower short-term interest rates on our funding costs partially offset by a decrease in average managed loans of $20.1 billion, or eight percent.
Noninterest income decreased $2.6 billion, or 22 percent, to $9.1 billion driven by decreases in card income of $1.5 billion, or 15 percent, and all other income of $1.1 billion, or 67 percent. The decrease in card income resulted from lower cash advances primarily related to balance transfers, and lower credit card interchange and fee income primarily due to changes in consumer retail purchase and payment behavior in the current economic environment. This decrease was partially offset by the absence of a negative valuation adjustment on the interest-only strip recorded in 2008. In addition, all other income in 2008 included the gain associated with the Visa initial public offering (IPO).
Provision for credit losses increased by $9.9 billion to $30.1 billion as economic conditions led to higher losses in the consumer card and consumer lending portfolios including a higher level of bankruptcies. Also contributing to the increase were higher reserve additions related to new draws on previously securitized accounts as well as an approximate $800 million addition to increase the reserve coverage to approximately 12 months of charge-offs in consumer credit card. These reserve additions were partially offset by the beneficial impact of reserve reductions from improving delinquency trends in the second half of 2009.
Noninterest expense decreased $1.2 billion, or 13 percent, to $8.0 billion due to lower operating and marketing costs. In addition, noninterest expense in 2008 included benefits associated with the Visa IPO.
| Bank of America 2009 | 29 |
The table below and the following discussion present selected key indicators for the Global Card Services and credit card portfolios. Credit card includes U.S., Europe and Canada consumer credit card and does not include business card, debit card and consumer lending.
Key Statistics
| ||||||||
| (Dollars in millions) | 2009 | 2008 | ||||||
Global Card Services | ||||||||
Average – total loans: | ||||||||
Managed | $ | 216,654 | $ | 236,714 | ||||
Held | 118,201 | 132,313 | ||||||
Year end – total loans: | ||||||||
Managed | 201,230 | 233,040 | ||||||
Held | 111,515 | 132,080 | ||||||
Managed net losses (1) : | ||||||||
Amount | 26,655 | 15,723 | ||||||
Percent (2) | 12.30 | % | 6.64 | % | ||||
Credit Card | ||||||||
Average – total loans: | ||||||||
Managed | $ | 170,486 | $ | 184,246 | ||||
Held | 72,033 | 79,845 | ||||||
Year end – total loans: | ||||||||
Managed | 160,824 | 182,234 | ||||||
Held | 71,109 | 81,274 | ||||||
Managed net losses (1) : | ||||||||
Amount | 19,185 | 11,382 | ||||||
Percent (2) | 11.25 | % | 6.18 | % | ||||
| (1) | Represents net charge-offs on held loans combined with realized credit losses associated with the securitized loan portfolio. |
| (2) | Ratios are calculated as managed net losses divided by average outstanding managed loans during the year. |
Global Card Services managed net losses increased $10.9 billion to $26.7 billion, or 12.30 percent of average outstandings, compared to $15.7 billion, or 6.64 percent in 2008. This increase was driven by portfolio deterioration due to economic conditions including a higher level of bankruptcies. Additionally, consumer lending net charge-offs increased $2.1 billion to $4.3 billion, or 17.75 percent of average outstandings compared to $2.2 billion, or 7.98 percent in 2008. Lower loan balances driven by reduced marketing and tightened credit criteria also adversely impacted net charge-off ratios.
Managed consumer credit card net losses increased $7.8 billion to $19.2 billion, or 11.25 percent of average credit card outstandings, compared to $11.4 billion, or 6.18 percent in 2008. The increase was driven by portfolio deterioration due to economic conditions including elevated unemployment, underemployment and a higher level of bankruptcies.
For more information on credit quality, see Consumer Portfolio Credit Risk Management beginning on page 54.
| 30 | Bank of America 2009 |
Home Loans & Insurance
| (Dollars in millions) | 2009 | 2008 | ||||||
Net interest income (1) | $ | 4,974 | $ | 3,311 | ||||
Noninterest income: | ||||||||
Mortgage banking income | 9,321 | 4,422 | ||||||
Insurance income | 2,346 | 1,416 | ||||||
All other income | 261 | 161 | ||||||
Total noninterest income | 11,928 | 5,999 | ||||||
Total revenue, net of interest expense | 16,902 | 9,310 | ||||||
Provision for credit losses | 11,244 | 6,287 | ||||||
Noninterest expense | 11,683 | 6,962 | ||||||
Loss before income taxes | (6,025 | ) | (3,939 | ) | ||||
Income tax benefit (1) | (2,187 | ) | (1,457 | ) | ||||
Net loss | $ | (3,838 | ) | $ | (2,482 | ) | ||
Net interest yield (1) | 2.57 | % | 2.55 | % | ||||
Efficiency ratio (1) | 69.12 | 74.78 | ||||||
Balance Sheet | ||||||||
Average | ||||||||
Total loans and leases | $ | 130,519 | $ | 105,724 | ||||
Total earning assets | 193,262 | 129,674 | ||||||
Total assets | 230,234 | 147,461 | ||||||
Allocated equity | 20,533 | 9,517 | ||||||
Year end | ||||||||
Total loans and leases | $ | 131,302 | $ | 122,947 | ||||
Total earning assets | 188,466 | 175,609 | ||||||
Total assets | 232,706 | 205,046 | ||||||
| (1) | FTE basis |
Home Loans & Insurance generates revenue by providing an extensive line of consumer real estate products and services to customers nationwide. Home Loans & Insurance products are available to our customers through a retail network of 6,011 banking centers, mortgage loan officers in approximately 880 locations and a sales force offering our customers direct telephone and online access to our products. These products are also offered through our correspondent and wholesale loan acquisition channels. Home Loans & Insurance products include fixed and adjustable rate first-lien mortgage loans for home purchase and refinancing needs, reverse mortgages, home equity lines of credit and home equity loans. First mortgage products are either sold into the secondary mortgage market to investors while retaining MSRs and the Bank of America customer relationships, or are held on our balance sheet in All Other for ALM purposes. Home Loans & Insurance is not impacted by the Corporation's mortgage production retention decisions as Home Loans & Insurance is compensated for the decision on a management accounting basis with a corresponding offset recorded in All Other . In addition, Home Loans & Insurance offers property, casualty, life, disability and credit insurance.
While the results of Countrywide's deposit operations are included in Deposits, the majority of its ongoing operations are recorded in Home Loans & Insurance . Countrywide's acquired first mortgage and discontinued real estate portfolios are recorded in All Other and are managed as part of our overall ALM activities .
Home Loans & Insurance includes the impact of migrating customers and their related loan balances between GWIM and Home Loans & Insurance . As of the date of migration, the associated net interest income
and noninterest expense are recorded in the segment to which the customers were migrated. Total loans of $11.5 billion were migrated from GWIM in 2009 compared to $1.6 billion in 2008. The increase was mainly due to client segmentation threshold changes resulting from the Merrill Lynch acquisition.
Home Loans & Insurance recorded a net loss of $3.8 billion in 2009 compared to a net loss of $2.5 billion in 2008, as growth in noninterest income and net interest income was more than offset by higher provision for credit losses and higher noninterest expense.
Net interest income grew $1.7 billion, or 50 percent, driven primarily by an increase in average loans held-for-sale (LHFS) and home equity loans. The $19.1 billion increase in average LHFS was the result of higher mortgage loan volume driven by the lower interest rate environment. The growth in average home equity loans of $23.7 billion, or 23 percent, was due primarily to the migration of certain loans from GWIM to Home Loans & Insurance as well as the full-year impact of Countrywide balances.
Noninterest income increased $5.9 billion to $11.9 billion driven by higher mortgage banking income which benefited from the full-year impact of Countrywide and lower current interest rates which drove higher production income.
Provision for credit losses increased $5.0 billion to $11.2 billion driven by continued economic and housing market weakness particularly in geographic areas experiencing higher unemployment and falling home prices. Additionally, reserve increases in the Countrywide home equity purchased impaired loan portfolio were $2.8 billion higher in 2009 compared to 2008 reflecting further reduction in expected principal cash flows.
Noninterest expense increased $4.7 billion to $11.7 billion largely due to the full-year impact of Countrywide as well as increased compensation costs and other expenses related to higher production volume and delinquencies. Partly contributing to the increase in expenses was the more than doubling of personnel and other costs in the area of our business that is responsible for assisting distressed borrowers with loan modifications or other workout solutions.
Mortgage Banking Income
We categorize Home Loans & Insurance mortgage banking income into production and servicing income. Production income is comprised of revenue from the fair value gains and losses recognized on our IRLCs and LHFS and the related secondary market execution, and costs related to representations and warranties in the sales transactions and other obligations incurred in the sales of mortgage loans. In addition, production income includes revenue for transfers of mortgage loans from Home Loans & Insurance to the ALM portfolio related to the Corporation's mortgage production retention decisions which is eliminated in All Other .
Servicing activities primarily include collecting cash for principal, interest and escrow payments from borrowers, disbursing customer draws for lines of credit and accounting for and remitting principal and interest payments to investors and escrow payments to third parties. Our home retention efforts are also part of our servicing activities, along with responding to customer inquiries and supervising foreclosures and property dispositions. Servicing income includes ancillary income earned in connection with these activities such as late fees, and MSR valuation adjustments, net of economic hedge activities.
| Bank of America 2009 | 31 |
The following table summarizes the components of mortgage banking income.
Mortgage Banking Income
| (Dollars in millions) | 2009 | 2008 | ||||||
Production income | $ | 5,539 | $ | 2,105 | ||||
Servicing income: | ||||||||
Servicing fees and ancillary income | 6,200 | 3,531 | ||||||
Impact of customer payments | (3,709 | ) | (3,314 | ) | ||||
Fair value changes of MSRs, net of economic hedge results | 712 | 1,906 | ||||||
Other servicing-related revenue | 579 | 194 | ||||||
Total net servicing income | 3,782 | 2,317 | ||||||
Total Home Loans & Insurance mortgage banking income | 9,321 | 4,422 | ||||||
Other business segments' mortgage banking | (530 | ) | (335 | ) | ||||
Total consolidated mortgage banking income | $ | 8,791 | $ | 4,087 | ||||
| (1) | Includes the effect of transfers of mortgage loans from Home Loans & Insurance to the ALM portfolio in All Other . |
Production income increased $3.4 billion in 2009 compared to 2008. This increase was driven by higher mortgage volumes due in large part to Countrywide and also to higher refinance activity resulting from the lower interest rate environment, partially offset by an increase in representations and warranties expense to $1.9 billion in 2009 from $246 million in 2008. The increase in representations and warranties expense was driven by increased estimates of defaults reflecting deterioration in the economy and housing markets combined with a higher rate of repurchase or similar requests. For further information regarding representations and warranties, see Note 8 – Securitizations to the Consolidated Financial Statements and the Consumer Portfolio Credit Risk Management – Residential Mortgage discussion beginning on page 56.
Net servicing income increased $1.5 billion in 2009 compared to 2008 largely due to the full-year impact of Countrywide which drove an increase of $2.7 billion in servicing fees and ancillary income partially offset by lower MSR performance, net of hedge activities. The fair value changes of MSRs, net of economic hedge results were $712 million and $1.9 billion in 2009 and 2008. The positive 2009 MSRs results were primarily driven by changes in the forward interest rate curve. The positive 2008 MSR results were driven primarily by the expectation that weakness in the housing market would lessen the impact of decreasing market interest rates on expected future prepayments. For further discussion on MSRs and the related hedge instruments, see Mortgage Banking Risk Management on page 86.
The following table presents select key indicators for Home Loans & Insurance .
Home Loans & Insurance Key Statistics
| (Dollars in millions, except as noted) | 2009 | 2008 | ||||||
Loan production | ||||||||
Home Loans & Insurance: | ||||||||
First mortgage | $ | 357,371 | $ | 128,945 | ||||
Home equity | 10,488 | 31,998 | ||||||
Total Corporation (1) : | ||||||||
First mortgage | 378,105 | 140,510 | ||||||
Home equity | 13,214 | 40,489 | ||||||
Year end | ||||||||
Mortgage servicing portfolio (in billions) (2 ) | $ | 2,151 | $ | 2,057 | ||||
Mortgage loans serviced for | 1,716 | 1,654 | ||||||
Mortgage servicing rights: | ||||||||
Balance | 19,465 | 12,733 | ||||||
Capitalized mortgage servicing rights (% of loans serviced for investors) | 113 | bps | 77 | bps | ||||
| (1) | In addition to loan production in Home Loans & Insurance , the remaining first mortgage and home equity loan production is primarily in GWIM . |
| ( 2 ) | Servicing of residential mortgage loans, home equity lines of credit, home equity loans and discontinued real estate mortgage loans. |
First mortgage production in Home Loans & Insurance was $357.4 billion in 2009 compared to $128.9 billion in 2008. The increase of $228.4 billion was due in large part to the full-year impact of Countrywide as well as an increase in the mortgage market driven by a decline in interest rates. Home equity production was $10.5 billion in 2009 compared to $32.0 billion in 2008. The decrease of $21.5 billion was primarily due to our more stringent underwriting guidelines for home equity lines of credit and loans as well as lower consumer demand.
At December 31, 2009, the consumer MSR balance was $19.5 billion, which represented 113 bps of the related unpaid principal balance as compared to $12.7 billion, or 77 bps of the related principal balance at December 31, 2008. The increase in the consumer MSR balance was driven by increases in the forward interest rate curve and the additional MSRs recorded in connection with sales of loans. This resulted in the 36 bps increase in the capitalized MSRs as a percentage of loans serviced for investors.
| 32 | Bank of America 2009 |
Global Banking
| (Dollars in millions) | 2009 | 2008 | ||||||
Net interest income (1) | $ | 11,250 | $ | 10,755 | ||||
Noninterest income: | ||||||||
Service charges | 3,954 | 3,233 | ||||||
Investment banking income | 3,108 | 1,371 | ||||||
All other income | 4,723 | 1,437 | ||||||
Total noninterest income | 11,785 | 6,041 | ||||||
Total revenue, net of interest expense | 23,035 | 16,796 | ||||||
Provision for credit losses | 8,835 | 3,130 | ||||||
Noninterest expense | 9,539 | 6,684 | ||||||
Income before income taxes | 4,661 | 6,982 | ||||||
Income tax expense (1) | 1,692 | 2,510 | ||||||
Net income | $ | 2,969 | $ | 4,472 | ||||
Net interest yield (1) | 3.34 | % | 3.30 | % | ||||
Return on average equity | 4.93 | 8.84 | ||||||
Efficiency ratio (1) | 41.41 | 39.80 | ||||||
Balance Sheet | ||||||||
Average | ||||||||
Total loans and leases | $ | 315,002 | $ | 318,325 | ||||
Total earning assets (2) | 337,315 | 325,764 | ||||||
Total assets (2) | 394,140 | 382,790 | ||||||
Total deposits | 211,261 | 177,528 | ||||||
Allocated equity | 60,273 | 50,583 | ||||||
Year end | ||||||||
Total loans and leases | $ | 291,117 | $ | 328,574 | ||||
Total earning assets (2) | 343,057 | 338,915 | ||||||
Total assets (2) | 398,061 | 394,541 | ||||||
Total deposits | 227,437 | 215,519 | ||||||
| (1) | FTE basis |
| (2) | Total earning assets and total assets include asset allocations to match liabilities (i.e., deposits). |
Global Banking provides a wide range of lending-related products and services, integrated working capital management, treasury solutions and investment banking services to clients worldwide through our network of offices and client relationship teams along with various product partners. Our clients include multinationals, middle-market and business banking companies, correspondent banks, commercial real estate firms and governments. Our lending products and services include commercial loans and commitment facilities, real estate lending, leasing, trade finance, short-term credit facilities, asset-based lending and indirect consumer loans. Our capital management and treasury solutions include treasury management, foreign exchange and short-term investing options. Our investment banking services provide our commercial and corporate issuer clients with debt and equity underwriting and distribution capabilities as well as merger-related and other advisory services. Global Banking also includes the results of our merchant services joint venture, as discussed below, and the economic hedging of our credit risk to certain exposures utilizing various risk mitigation tools. Our clients are supported in offices throughout the world that are divided into four distinct geographic regions: U.S. and Canada; Asia Pacific; Europe, Middle East and Africa; and Latin America. For more information on our foreign operations, see Foreign Portfolio beginning on page 74.
During the second quarter of 2009, we entered into a joint venture agreement with First Data Corporation (First Data) to form Banc of America Merchant Services, LLC. The joint venture provides payment solutions, including credit, debit and prepaid cards, and check and e-commerce payments to merchants ranging from small businesses to corporate and commercial clients worldwide. We contributed approximately 240,000 merchant relationships, a sales force of approximately 350 associates, and the use of the Bank of America brand name. First Data contributed
approximately 140,000 merchant relationships, 200 sales associates and state of the art technology. The joint venture and clients benefit from both companies' comprehensive suite of leading payment solutions capabilities. At December 31, 2009, we owned 46.5 percent of the joint venture and we account for our investment under the equity method of accounting. The third party investor has the right to put their interest to the joint venture which would have the effect of increasing the Corporation's ownership interest to 49 percent. In connection with the formation of the joint venture, we recorded a pre-tax gain of $3.8 billion which represents the excess of fair value over the carrying value of our contributed merchant processing business.
Global Banking net income decreased $1.5 billion, or 34 percent, to $3.0 billion in 2009 compared to 2008 as an increase in revenue was more than offset by higher provision for credit losses and noninterest expense.
Net interest income increased $495 million, or five percent, as average deposits grew $33.7 billion, or 19 percent, driven by deposit growth as our clients remain very liquid. In addition, average deposit growth benefited from a flight-to-safety in late 2008. Net interest income also benefited from improved loan spreads on new, renewed and amended facilities. These increases were partially offset by a $3.3 billion, or one percent, decline in average loan balances due to decreased client demand as clients are deleveraging and capital markets began to open up so that corporate clients could access other funding sources. In addition, net interest income was negatively impacted by a lower net interest income allocation from ALM activities and increased nonperforming loans.
Noninterest income increased $5.7 billion, or 95 percent, to $11.8 billion, mainly driven by the $3.8 billion pre-tax gain related to the contribution of the merchant processing business into a joint venture, higher investment banking income and service charges. Investment banking income increased $1.7 billion due to the acquisition of Merrill Lynch and strong growth in debt and equity capital markets fees. Service charges increased $721 million, or 22 percent, driven by the Merrill Lynch acquisition and the impact of fees charged for services provided to the merchant processing joint venture. All other income increased $3.3 billion compared to the prior year from the gain related to the contribution of the merchant processing business. All other income also includes our proportionate share of the joint venture net income, where prior to formation of the joint venture these activities were reflected in card income. In addition, noninterest income benefited in 2008 from Global Banking's share of the Visa IPO gain.
The provision for credit losses increased $5.7 billion to $8.8 billion in 2009 compared to 2008 primarily driven by higher net charge-offs and reserve additions in the commercial real estate and commercial – domestic portfolios resulting from deterioration across a broad range of property types, industries and borrowers.
Noninterest expense increased $2.9 billion, or 43 percent, to $9.5 billion, primarily attributable to the Merrill Lynch acquisition and higher FDIC insurance and special assessment costs. These items were partially offset by a reduction in certain merchant-related expenses that are now incurred by the joint venture and a change in compensation that delivers a greater portion of incentive pay over time. In addition, noninterest expense in 2008 also included benefits associated with the Visa IPO.
Global Banking Revenue
Global Banking evaluates its revenue from two primary client views, global commercial banking and global corporate and investment banking. Global commercial banking primarily includes revenue related to our commercial and business banking clients who are generally defined as companies with sales between $2 million and $2 billion including middle-market and multinational clients as well as commercial real estate clients. Global
| Bank of America 2009 | 33 |
corporate and investment banking primarily includes revenue related to our large corporate clients including multinationals which are generally defined as companies with sales in excess of $2 billion. Additionally, global corporate and investment banking revenue also includes debt and equity underwriting and merger-related advisory services (net of revenue sharing primarily with Global Markets ). The following table presents further detail regarding Global Banking revenue.
| (Dollars in millions) | 2009 | 2008 | ||||
Global Banking revenue | ||||||
Global commercial banking | $ | 15,209 | $ | 11,362 | ||
Global corporate and investment banking | 7,826 | 5,434 | ||||
Total Global Banking revenue | $ | 23,035 | $ | 16,796 | ||
Global Banking revenue increased $6.2 billion to $23.0 billion in 2009 compared to 2008. Global Banking revenue consists of credit-related revenue derived from lending-related products and services, treasury services-related revenue primarily from capital and treasury management, and investment banking income.
| • | Global commercial banking revenue increased $3.8 billion, or 34 percent, primarily driven by the gain from the contribution of the merchant processing business to the joint venture. |
Credit-related revenue within global commercial banking increased $960 million to $6.7 billion due to improved loan spreads on new, renewed and amended facilities and the Merrill Lynch acquisition. Average loans and leases decreased $3.7 billion to $219.0 billion as increased balances due to the Merrill Lynch acquisition were more than offset by reduced client demand.
Treasury services-related revenue within global commercial banking increased $2.9 billion to $8.5 billion driven by the $3.8 billion gain related to the contribution of the merchant services business to the joint venture, partially offset by lower net interest income and the absence of the 2008 gain associated with the Visa IPO. Average treasury services deposit balances increased $22.7 billion to $130.9 billion driven by clients managing their balances.
| • | Global corporate and investment banking revenue increased $2.4 billion in 2009 compared to 2008 driven primarily by the Merrill Lynch acquisition which resulted in increased debt and equity capital markets fees, and higher net interest income due mainly to growth in average deposits. |
Credit-related revenue within global corporate and investment banking increased $387 million to $2.9 billion in 2009 compared to 2008 driven by improved loan spreads and the Merrill Lynch acquisition, partially offset by the adverse impact of increased nonperforming loans and the higher cost of credit hedging. Average loans and leases remained essentially flat as reduced demand offset the impact of the Merrill Lynch acquisition.
Treasury services-related revenue within global corporate and investment banking decreased $438 million to $2.5 billion in 2009 driven by lower net interest income, service fees and card income. Average deposit balances increased $11.1 billion to $80.4 billion during 2009 primarily due to clients managing their balances.
Investment Banking Income
Product specialists within Global Markets work closely with Global Banking on underwriting and distribution of debt and equity securities and certain other products. To reflect the efforts of Global Markets and Global Banking in servicing our clients with the best product capabilities, we allocate revenue to the two segments based on relative contribution. Therefore, to provide a complete discussion of our consolidated investment banking income, we have included the following table that presents total investment banking income for the Corporation.
| (Dollars in millions) | 2009 | 2008 | ||||||
Investment banking income | ||||||||
Advisory (1) | $ | 1,167 | $ | 546 | ||||
Debt issuance | 3,124 | 1,539 | ||||||
Equity issuance | 1,964 | 624 | ||||||
| 6,255 | 2,709 | |||||||
Offset for intercompany fees (2) | (704 | ) | (446 | ) | ||||
Total investment banking income | $ | 5,551 | $ | 2,263 | ||||
| (1) | Advisory includes fees on debt and equity advisory, and merger and acquisitions. |
| (2) | The offset to fees paid on the Corporation's transactions. |
Investment banking income increased $3.3 billion to $5.6 billion in 2009 compared to 2008. The increase was largely due to the Merrill Lynch acquisition and favorable market conditions for debt and equity issuances. Debt issuance fees increased $1.6 billion due primarily to leveraged finance and investment grade bond issuances. Equity issuance fees increased $1.3 billion as we benefited from the increased size of the investment banking platform. Advisory fees increased $621 million attributable to the larger advisory platform partially offset by decreased merger and acquisitions activity.
| 34 | Bank of America 2009 |
Global Markets
| (Dollars in millions) | 2009 | 2008 | ||||||
Net interest income (1) | $ | 6,120 | $ | 5,151 | ||||
Noninterest income: | ||||||||
Investment and brokerage services | 2,552 | 752 | ||||||
Investment banking income | 2,850 | 1,337 | ||||||
Trading account profits (losses) | 11,675 | (5,809 | ) | |||||
All other income (loss) | (2,571 | ) | (5,262 | ) | ||||
Total noninterest income (loss) | 14,506 | (8,982 | ) | |||||
Total revenue, net of interest expense | 20,626 | (3,831 | ) | |||||
Provision for credit losses | 400 | (50 | ) | |||||
Noninterest expense | 10,042 | 3,906 | ||||||
Income (loss) before income taxes | 10,184 | (7,687 | ) | |||||
Income tax expense (benefit) (1) | 3,007 | (2,771 | ) | |||||
Net income (loss) | $ | 7,177 | $ | (4,916 | ) | |||
Return on average equity | 23.33 | % | n/m | |||||
Efficiency ratio (1) | 48.68 | n/m | ||||||
Balance Sheet | ||||||||
Average | ||||||||
Total trading-related assets ( 2 ) | $ | 507,648 | $ | 338,074 | ||||
Total market-based earning assets | 481,542 | 360,667 | ||||||
Total earning assets | 490,406 | 366,195 | ||||||
Total assets | 656,621 | 427,734 | ||||||
Allocated equity | 30,765 | 12,839 | ||||||
Year end | ||||||||
Total trading-related assets (2) | $ | 411,212 | $ | 244,174 | ||||
Total market-based earning assets | 404,467 | 237,452 | ||||||
Total earning assets | 409,717 | 243,275 | ||||||
Total assets | 538,456 | 306,693 | ||||||
| (1) | FTE basis |
| (2) | Includes assets which are not considered earning assets (i.e., derivative assets). |
| n/m | = not meaningful |
Global Markets provides financial products, advisory services, financing, securities clearing, settlement and custody services globally to our institutional investor clients in support of their investing and trading activities. We also work with our commercial and corporate clients to provide debt and equity underwriting and distribution capabilities and risk management products using interest rate, equity, credit, currency and commodity derivatives, foreign exchange, fixed income and mortgage-related products. The business may take positions in these products and participate in market-making activities dealing in government securities, equity and equity-linked securities, high-grade and high-yield corporate debt securities, commercial paper, MBS and asset-backed securities (ABS). Underwriting debt and equity, securities research and certain market-based activities are executed through our global broker/dealer affiliates which are our primary dealers in several countries. Global Markets is a leader in the global distribution of fixed income, currency and energy commodity products and derivatives. Global Markets also has one of the largest equity trading operations in the world and is a leader in the origination and distribution of equity and equity-related products.
Net income increased $12.1 billion to $7.2 billion in 2009 compared to a loss of $4.9 billion in 2008 as increased noninterest income driven by trading account profits was partially offset by higher noninterest expense.
Net interest income, almost all of which is market-based, increased $969 million to $6.1 billion due to growth in average market-based earning assets which increased $120.9 billion or 34 percent, driven primarily by the Merrill Lynch acquisition.
Noninterest income increased $23.5 billion due to the Merrill Lynch acquisition, favorable core trading results and decreased write-downs on legacy assets partially offset by negative credit valuation adjustments on derivative liabilities due to improvement in our credit spreads in 2009. Noninterest expense increased $6.1 billion, largely attributable to the Merrill Lynch acquisition. This increase was partially offset by a change in compensation that delivers a greater portion of incentive pay over time.
Sales and Trading Revenue
Global Markets revenue is primarily derived from sales and trading and investment banking activities which are shared between Global Markets and Global Banking . Global Banking originates certain deal-related transactions with our corporate and commercial clients that are executed and distributed by Global Markets . In order to reflect the relative contribution of each business segment, a revenue-sharing agreement has been implemented which attributes revenue accordingly (see page 34 for a discussion of investment banking fees on a consolidated basis). In addition, certain gains and losses related to write-downs on legacy assets and select trading results are also allocated or shared between Global Markets and Global Banking . Therefore, in order to provide a complete discussion of our sales and trading revenue, the following table and related discussion present total sales and trading revenue for the consolidated Corporation. Sales and trading revenue is segregated into fixed income (investment and noninvestment grade corporate debt obligations, commercial mortgage-backed securities (CMBS), residential mortgage-backed securities (RMBS) and CDOs), currencies (interest rate and foreign exchange contracts), commodities (primarily futures, forwards, swaps and options) and equity income from equity-linked derivatives and cash equity activity.
| (Dollars in millions) | 2009 | 2008 | |||||
Sales and trading revenue (1, 2) | |||||||
Fixed income, currencies and commodities (FICC) | $ | 12,727 | $ | (7,625 | ) | ||
Equity income | 4,901 | 743 | |||||
Total sales and trading revenue | $ | 17,628 | $ | (6,882 | ) | ||
| (1) | Includes $356 million and $257 million of net interest income on a FTE basis for 2009 and 2008. |
| (2) | Includes $1.1 billion and $1.2 billion of write-downs on legacy assets that were allocated to Global Banking for 2009 and 2008. |
Sales and trading revenue increased $24.5 billion to $17.6 billion in 2009 compared to a loss of $6.9 billion in 2008 due to the addition of Merrill Lynch and the improving economy. Write-downs on legacy assets in 2009 were $3.8 billion with $2.7 billion included in Global Markets as compared to $10.5 billion in 2008 with $9.3 billion recorded in Global Markets . Further, we recorded negative net credit valuation adjustments on derivative liabilities of $801 million resulting from improvements in our credit spreads in 2009 compared to a gain of $354 million in 2008.
FICC revenue increased $20.4 billion to $12.7 billion in 2009 compared to 2008 primarily driven by credit and structured products which continued to benefit from improved market liquidity and tighter credit spreads as well as new issuance capabilities.
| • | During 2009, we incurred $2.2 billion of losses resulting from our CDO exposure which includes our super senior, warehouse, sales and trading positions, hedging activities and counterparty credit risk valuations. This compares to $4.8 billion in CDO-related losses for 2008. Included in the above losses were $910 million and $1.1 billion of losses in 2009 and 2008 related to counterparty risk on our CDO-related exposure. Also included in the above losses were other-than-temporary impairment charges of $1.2 billion in 2009 compared to $3.3 billion in 2008 related to CDOs and retained positions classified as AFS debt securities. See the following detailed CDO exposure discussion. |
| • | During 2009 we recorded $1.6 billion of losses, net of hedges, on CMBS funded debt and forward finance commitments compared to losses of $944 million in 2008. These losses were concentrated in the more difficult to hedge floating-rate debt. In addition, we recorded $670 million in losses associated with equity investments we made in acquisition-related financing transactions compared to $545 million in losses in the prior year. At December 31, 2009 and 2008, we held $5.3 billion and $6.9 billion of funded and unfunded CMBS exposure of which $4.4 billion and $6.0 billion were primarily floating-rate |
| Bank of America 2009 | 35 |
acquisition-related financings to major, well-known operating companies. CMBS exposure decreased as $4.1 billion of funded CMBS debt acquired in the Merrill Lynch acquisition was partially offset by a transfer of $3.8 billion of CMBS funded debt to commercial loans held for investment as we plan to hold these positions and, to a lesser extent, by loan sales and paydowns. |
| • | We incurred losses in 2009 on our leveraged loan exposures of $286 million compared to $1.1 billion in 2008. At December 31, 2009, the carrying value of our leveraged funded positions held for distribution was $2.4 billion, which included $1.2 billion from the Merrill Lynch acquisition, compared to $2.8 billion at December 31, 2008, which did not include Merrill Lynch. At December 31, 2009, 99 percent of the carrying value of the leveraged funded positions was senior secured. |
| • | We recorded a loss of $100 million on auction rate securities (ARS) in 2009 compared to losses of $898 million in 2008 which reflects stabilizing valuations on ARS during the year. We have agreed to purchase ARS at par from certain customers in connection with an agreement with federal and state securities regulators. During 2009, we purchased a net $3.8 billion of ARS from our customers and at December 31, 2009, our outstanding buyback commitment was $291 million. |
Equity products sales and trading revenue increased $4.2 billion to $4.9 billion in 2009 compared to 2008 driven by the addition of Merrill Lynch's trading and financing platforms.
Collateralized Debt Obligation Exposure
CDO vehicles hold diversified pools of fixed income securities and issue multiple tranches of debt securities including commercial paper, mezzanine and equity securities. Our CDO exposure can be divided into funded and unfunded super senior liquidity commitment exposure, other super senior exposure (i.e., cash positions and derivative contracts), warehouse, and sales and trading positions. For more information on our CDO liquidity commitments, see Note 9 – Variable Interest Entities to the Consolidated Financial Statements. Super senior exposure represents the most senior class of commercial paper or notes that are issued by the CDO vehicles. These financial instruments benefit from the subordination of all other securities issued by the CDO vehicles.
As presented in the following table, at December 31, 2009, our hedged and unhedged super senior CDO exposure before consideration of insurance, net of write-downs was $3.6 billion.
Super Senior Collateralized Debt Obligation Exposure
December 31, 2009
| (Dollars in millions) | Subprime ( 1 ) | Retained Positions | Total Subprime | Non-Subprime ( 2 ) | Total | ||||||||||
Unhedged | $ | 938 | $ | 528 | $ | 1,466 | $ | 839 | $ | 2,305 | |||||
Hedged ( 3 ) | 661 | – | 661 | 652 | 1,313 | ||||||||||
Total | $ | 1,599 | $ | 528 | $ | 2,127 | $ | 1,491 | $ | 3,618 | |||||
| (1) | Classified as subprime when subprime consumer real estate loans make up at least 35 percent of the original net exposure value of the underlying collateral. |
| (2) | Includes highly rated collateralized loan obligations and CMBS super senior exposure. |
| (3) | Hedged amounts are presented at carrying value before consideration of the insurance. |
We value our CDO structures using the average of all prices obtained from either external pricing services or offsetting trades for approximately 89 percent and 77 percent of the CDO exposure and related retained positions. The majority of the remaining positions where no pricing quotes were available were valued using matrix pricing and projected cash flows. Unrealized losses recorded in accumulated OCI on super senior cash positions and retained positions from liquidated CDOs in aggregate increased $88 million during 2009 to $104 million at December 31, 2009.
At December 31, 2009, total subprime super senior unhedged exposure of $1.466 billion was carried at 15 percent and the $839 million of non-subprime unhedged exposure was carried at 51 percent of their original net exposure amounts. Net hedged subprime super senior exposure of $661 million was carried at 13 percent and the $652 million of hedged non-subprime super senior exposure was carried at 64 percent of its original net exposure.
The following table presents the carrying values of our subprime net exposures including subprime collateral content and percentages of certain vintages.
Unhedged Subprime Super Senior Collateralized Debt Obligation Carrying Values
December 31, 2009
Subprime Net Exposure | Carrying Value as a Percent of Original Net Exposure | Subprime Content of Collateral ( 1 ) | Vintage of Subprime Collateral | ||||||||||||
| (Dollars in millions) | Percent in 2006/2007 Vintages | Percent in 2005/Prior Vintages | |||||||||||||
Mezzanine super senior liquidity commitments | $ | 88 | 7 | % | 100 | % | 85 | % | 15 | % | |||||
Other super senior exposure | |||||||||||||||
High grade | 577 | 20 | 43 | 23 | 77 | ||||||||||
Mezzanine | 272 | 16 | 34 | 79 | 21 | ||||||||||
CDO-squared | 1 | 1 | 100 | 100 | – | ||||||||||
Total other super senior | 850 | ||||||||||||||
Total super senior | 938 | 15 | |||||||||||||
Retained positions from liquidated CDOs | 528 | 15 | 28 | 22 | 78 | ||||||||||
Total | $ | 1,466 | 15 | ||||||||||||
| ( 1 ) | Based on current net exposure value. |
| 36 | Bank of America 2009 |
At December 31, 2009, we held purchased insurance on our subprime and non-subprime super senior CDO exposure with a notional value of $5.2 billion and $1.0 billion from monolines and other financial guarantors. Monolines provided $3.8 billion of the purchased insurance in the form of CDS, total return swaps or financial guarantees. In addition, we held collateral in the form of cash and marketable securities of
$1.1 billion related to our non-monoline purchased insurance. In the case of default, we look to the underlying securities and then to recovery on purchased insurance. The table below provides notional, receivable, counterparty credit valuation adjustment and gains (write-downs) on insurance purchased from monolines.
Credit Default Swaps with Monoline Financial Guarantors
December 31, 2009
| (Dollars in millions) | Super Senior CDOs | Other Guaranteed Positions | Total | |||||||||
Notional | $ | 3,757 | $ | 38,834 | $ | 42,591 | ||||||
Mark-to-market or guarantor receivable | $ | 2,833 | $ | 8,256 | $ | 11,089 | ||||||
Credit valuation adjustment | (1,873 | ) | (4,132 | ) | (6,005 | ) | ||||||
Total | $ | 960 | $ | 4,124 | $ | 5,084 | ||||||
Credit valuation adjustment % | 66 | % | 50 | % | 54 | % | ||||||
(Write-downs) gains during 2009 | $ | (961 | ) | $ | 98 | $ | (863 | ) | ||||
Monoline wrap protection on our super senior CDOs had a notional value of $3.8 billion at December 31, 2009, with a receivable of $2.8 billion and a counterparty credit valuation adjustment of $1.9 billion, or 66 percent. During 2009, we recorded $961 million of counterparty credit risk-related write-downs on these positions. At December 31, 2008, the monoline wrap on our super senior CDOs had a notional value of $2.8 billion, with a receivable of $1.5 billion and a counterparty credit valuation adjustment of $1.1 billion, or 72 percent.
In addition to the monoline financial guarantor exposure related to super senior CDOs, we had $38.8 billion of notional exposure to monolines that predominantly hedge corporate collateralized loan obligation and CDO exposure as well as CMBS, RMBS and other ABS cash and synthetic exposures that were acquired from Merrill Lynch. At December 31, 2008, the monoline wrap on our other guaranteed positions was $5.9 billion of notional exposure. Mark-to-market monoline derivative credit exposure was $8.3 billion at December 31, 2009 compared to $694 million at December 31, 2008. This increase was driven
by the addition of Merrill Lynch exposures as well as credit deterioration related to underlying counterparties, partially offset by positive valuation adjustments on legacy assets and terminated monoline contracts.
At December 31, 2009, the counterparty credit valuation adjustment related to non-super senior CDO monoline derivative exposure was $4.1 billion which reduced our net mark-to-market exposure to $4.1 billion. We do not hold collateral against these derivative exposures. Also, during 2009 we recognized gains of $113 million for counterparty credit risk related to these positions.
With the Merrill Lynch acquisition, we acquired a loan with a carrying value of $4.4 billion as of December 31, 2009 that is collateralized by U.S. super senior ABS CDOs. Merrill Lynch originally provided financing to the borrower for an amount equal to approximately 75 percent of the fair value of the collateral. The loan has full recourse to the borrower and all scheduled payments on the loan have been received. Events of default under the loan are customary events of default, including failure to pay interest when due and failure to pay principal at maturity. Collateral for the loan is excluded from our CDO exposure discussions and the applicable tables.
| Bank of America 2009 | 37 |
Global Wealth & Investment Management
| 2009 | ||||||||||||||||||||
| (Dollars in millions) | Total | Merrill Lynch Global Wealth Management (1) | U.S. Trust | Columbia Management | Other | |||||||||||||||
Net interest income (2) | $ | 5,564 | $ | 4,567 | $ | 1,361 | $ | 32 | $ | (396 | ) | |||||||||
Noninterest income: | ||||||||||||||||||||
Investment and brokerage services | 9,273 | 6,130 | 1,254 | 1,090 | 799 | |||||||||||||||
All other income (loss) | 3,286 | 1,684 | 48 | (201 | ) | 1,755 | ||||||||||||||
Total noninterest income | 12,559 | 7,814 | 1,302 | 889 | 2,554 | |||||||||||||||
Total revenue, net of interest expense | 18,123 | 12,381 | 2,663 | 921 | 2,158 | |||||||||||||||
Provision for credit losses | 1,061 | 619 | 442 | – | – | |||||||||||||||
Noninterest expense | 13,077 | 9,411 | 1,945 | 932 | 789 | |||||||||||||||
Income (loss) before income taxes | 3,985 | 2,351 | 276 | (11 | ) | 1,369 | ||||||||||||||
Income tax expense (benefit) (2) | 1,446 | 870 | 102 | (4 | ) | 478 | ||||||||||||||
Net income (loss) | $ | 2,539 | $ | 1,481 | $ | 174 | $ | (7 | ) | $ | 891 | |||||||||
Net interest yield (2) | 2.53 | % | 2.49 | % | 2.58 | % | n/m | n/m | ||||||||||||
Return on average equity (3) | 13.44 | 18.50 | 3.39 | n/m | n/m | |||||||||||||||
Efficiency ratio (2) | 72.16 | 76.01 | 73.03 | n/m | n/m | |||||||||||||||
Year end – total assets (4) | $ | 254,192 | $ | 195,175 | $ | 55,371 | $ | 2,717 | n/m | |||||||||||
| 2008 | ||||||||||||||||||||
| (Dollars in millions) | Total | Merrill Lynch Global Wealth Management (1) | U.S. Trust | Columbia Management | Other | |||||||||||||||
Net interest income (2) | $ | 4,797 | $ | 3,211 | $ | 1,570 | $ | 6 | $ | 10 | ||||||||||
Noninterest income: | ||||||||||||||||||||
Investment and brokerage services | 4,059 | 1,001 | 1,400 | 1,496 | 162 | |||||||||||||||
All other income (loss) | (1,047 | ) | 58 | 18 | (1,120 | ) | (3 | ) | ||||||||||||
Total noninterest income | 3,012 | 1,059 | 1,418 | 376 | 159 | |||||||||||||||
Total revenue, net of interest expense | 7,809 | 4,270 | 2,988 | 382 | 169 | |||||||||||||||
Provision for credit losses | 664 | 561 | 103 | – | – | |||||||||||||||
Noninterest expense | 4,910 | 1,788 | 1,831 | 1,126 | 165 | |||||||||||||||
Income (loss) before income taxes | 2,235 | 1,921 | 1,054 | (744 | ) | 4 | ||||||||||||||
Income tax expense (benefit) (2) | 807 | 711 | 390 | (275 | ) | (19 | ) | |||||||||||||
Net income (loss) | $ | 1,428 | $ | 1,210 | $ | 664 | $ | (469 | ) | $ | 23 | |||||||||
Net interest yield (2) | 2.97 | % | 2.60 | % | 3.05 | % | n/m | n/m | ||||||||||||
Return on average equity (3) | 12.20 | 36.66 | 14.20 | n/m | n/m | |||||||||||||||
Efficiency ratio (2) | 62.87 | 41.88 | 61.26 | n/m | n/m | |||||||||||||||
Year end – total assets (4) | $ | 189,073 | $ | 137,282 | $ | 57,167 | $ | 2,923 | n/m | |||||||||||
| (1) | Effective January 1, 2009, as a result of the Merrill Lynch acquisition, we combined Merrill Lynch's wealth management business and our former Premier Banking & Investments business to form Merrill Lynch Global Wealth Management ( MLGWM). |
| (2) | FTE basis |
| (3) | Average allocated equity for GWIM was $18.9 billion and $11.7 billion at December 31, 2009 and 2008. |
| (4) | Total assets include asset allocations to match liabilities (i.e., deposits). |
| n/m | = not meaningful |
| December 31 | Average Balance | |||||||||||||
| (Dollars in millions) | 2009 | 2008 | 2009 | 2008 | ||||||||||
Balance Sheet | ||||||||||||||
Total loans and leases | $ | 99,596 | $ | 89,401 | $ | 103,398 | $ | 87,593 | ||||||
Total earning assets (1) | 219,866 | 179,319 | 219,612 | 161,685 | ||||||||||
Total assets (1) | 254,192 | 189,073 | 251,969 | 170,973 | ||||||||||
Total deposits | 224,840 | 176,186 | 225,980 | 160,702 | ||||||||||
| (1) | Total earning assets and total assets include asset allocations to match liabilities (i.e., deposits). |
| 38 | Bank of America 2009 |
GWIM provides a wide offering of customized banking, investment and brokerage services tailored to meet the changing wealth management needs of our individual and institutional customer base. Our clients have access to a range of services offered through three primary businesses: MLGWM; U.S. Trust, Bank of America Private Wealth Management (U.S. Trust); and Columbia . The results of the Retirement & Philanthropic Services business, the Corporation's approximate 34 percent economic ownership interest in BlackRock and other miscellaneous items are included in Other within GWIM .
As part of the Merrill Lynch acquisition, we added its financial advisors and an economic ownership interest of approximately 50 percent in BlackRock, a publicly traded investment management company. During 2009, BlackRock completed its purchase of Barclays Global Investors, an asset management business, from Barclays PLC which had the effect of diluting our ownership interest in BlackRock and, for accounting purposes, was treated as a sale of a portion of our ownership interest. As a result, upon the closing of this transaction, the Corporation's economic ownership interest in BlackRock was reduced to approximately 34 percent and we recorded a pre-tax gain of $1.1 billion.
Net income increased $1.1 billion, or 78 percent, to $2.5 billion as higher total revenue was partially offset by increases in noninterest expense and provision for credit losses.
Net interest income increased $767 million, or 16 percent, to $5.6 billion primarily due to the acquisition of Merrill Lynch partially offset by a lower net interest income allocation from ALM activities and the impact of the migration of client balances during 2009 to Deposits and Home Loans & Insurance . GWIM's average loan and deposit growth benefited from the acquisition of Merrill Lynch and the shift of client assets from off-balance sheet (e.g., money market funds) to on-balance sheet products (e.g., deposits) partially offset by the net migration of customer relationships. A more detailed discussion regarding migrated customer relationships and related balances is provided in the following MLGWM discussion.
Noninterest income increased $9.5 billion to $12.6 billion primarily due to higher investment and brokerage services income driven by the Merrill Lynch acquisition, the $1.1 billion gain on our investment in BlackRock and the lower level of support provided to certain cash funds partially offset by the impact of lower average equity market levels and net outflows primarily in the cash complex.
Provision for credit losses increased $397 million, or 60 percent, to $1.1 billion, reflecting the weak economy during 2009 which drove higher net charge-offs in the consumer real estate and commercial portfolios including a single large commercial charge-off.
Noninterest expense increased $8.2 billion to $13.1 billion driven by the addition of Merrill Lynch and higher FDIC insurance and special assessment costs partially offset by lower revenue-related expenses.
Client Assets
The following table presents client assets which consist of AUM, client brokerage assets, assets in custody and client deposits.
Client Assets
| December 31 | ||||||||
| (Dollars in millions) | 2009 | 2008 | ||||||
Assets under management | $ | 749,852 | $ | 523,159 | ||||
Client brokerage assets (1) | 1,270,461 | 172,106 | ||||||
Assets in custody | 274,472 | 133,726 | ||||||
Client deposits | 224,840 | 176,186 | ||||||
Less: Client brokerage assets and assets in custody included in assets under management | (346,682 | ) | (87,519 | ) | ||||
Total net client assets | $ | 2,172,943 | $ | 917,658 | ||||
| (1) | Client brokerage assets include non-discretionary brokerage and fee-based assets. |
The increase in net client assets was driven by the acquisition of Merrill Lynch and higher equity market values at December 31, 2009 compared to 2008 partially offset by outflows that primarily occurred in cash and money market assets due to increasing interest rate pressure.
Merrill Lynch Global Wealth Management
Effective January 1, 2009, as a result of the Merrill Lynch acquisition, we combined the Merrill Lynch wealth management business and our former Premier Banking & Investments business to form MLGWM . MLGWM provides a high-touch client experience through a network of approximately 15,000 client-facing financial advisors to our affluent customers with a personal wealth profile of at least $250,000 of investable assets. The addition of Merrill Lynch created one of the largest financial advisor networks in the world. Merrill Lynch added $10.3 billion in revenue and $1.6 billion in net income during 2009. Total client balances in MLGWM , which include deposits, AUM, client brokerage assets and other assets in custody, were $1.4 trillion at December 31, 2009.
MLGWM includes the impact of migrating customers and their related deposit and loan balances to or from Deposits and Home Loans & Insurance . As of the date of migration, the associated net interest income, noninterest income and noninterest expense are recorded in the segment to which the customers migrated. During 2009, total deposits of $43.4 billion were migrated to Deposits from MLGWM. Conversely, during 2008, total deposits of $20.5 billion were migrated from Deposits to MLGWM. During 2009 and 2008, total loans of $16.6 billion and $1.7 billion were migrated from MLGWM, of which $11.5 billion and $1.6 billion were migrated to Home Loans & Insurance. These changes in 2009 were mainly due to client segmentation threshold changes resulting from the Merrill Lynch acquisition.
| Bank of America 2009 | 39 |
Net income increased $271 million, or 22 percent, to $1.5 billion as increases in noninterest income and net interest income were partially offset by higher noninterest expense. Net interest income increased $1.4 billion, or 42 percent, to $4.6 billion driven by higher average deposit and loan balances due to the acquisition of Merrill Lynch partially offset by a lower net interest income allocation from ALM activities, the impact of migration to Deposits and Home Loans & Insurance , and spread compression on deposits. Noninterest income rose $6.8 billion to $7.8 billion due to an increase in investment and brokerage services income of $5.1 billion driven by the acquisition of Merrill Lynch. Provision for credit losses increased $58 million, or 10 percent, to $619 million primarily driven by increased credit costs related to the consumer real estate portfolio reflecting the weak housing market. Noninterest expense increased $7.6 billion to $9.4 billion driven by the acquisition of Merrill Lynch. In addition, noninterest expense was adversely impacted by higher FDIC insurance and special assessment costs.
U.S. Trust, Bank of America Private Wealth Management
U.S. Trust provides comprehensive wealth management solutions to wealthy and ultra-wealthy clients with investable assets of more than $3 million. In addition, U.S. Trust provides resources and customized solutions to meet clients' wealth structuring, investment management, trust and banking needs as well as specialty asset management services (oil and gas, real estate, farm and ranch, timberland, private businesses and tax advisory). Clients also benefit from access to resources available through the Corporation including capital markets products, large and complex financing solutions, and our extensive banking platform.
Net income decreased $490 million, or 74 percent, to $174 million driven by higher provision for credit losses and lower net interest income. Net interest income decreased $209 million, or 13 percent, to $1.4 billion due to a lower net interest income allocation from ALM activities partially offset by the shift of client assets from off-balance sheet (e.g., money market funds) to on-balance sheet products (e.g., deposits). Noninterest income decreased $116 million, or eight percent, to $1.3 billion driven by lower investment and brokerage services income due to lower valuations in the equity markets and a decline in transactional revenues offset by the addition of the Merrill Lynch trust business and lower losses related to ARS. Provision for credit losses increased $339 million to $442 million driven by higher net charge-offs, including a single large commercial charge-off, and higher reserve additions in the commercial and consumer real estate portfolios. Noninterest expense increased $114 million, or six percent, to $1.9 billion due to higher FDIC insurance and special assessment costs and the addition of the Merrill Lynch trust business which were partially offset by cost containment strategies and lower revenue-related expenses.
Columbia Management
Columbia is an asset management business serving the needs of both institutional clients and individual customers. Columbia provides asset management products and services including mutual funds and separate accounts. Columbia mutual fund offerings provide a broad array of investment strategies and products including equity, fixed income (taxable and nontaxable) and money market (taxable and nontaxable) funds. Columbia distributes its products and services to institutional clients and individuals directly through MLGWM, U.S. Trust, Global Banking and nonproprietary channels including other brokerage firms.
During 2009, the Corporation reached an agreement to sell the long-term asset management business of Columbia to Ameriprise Financial, Inc., for consideration of approximately $900 million to $1.2 billion subject to certain adjustments including, among other factors, AUM net flows. This includes the management of Columbia's equity and fixed
income mutual funds and separate accounts. The transaction is expected to close in the second quarter of 2010, and is subject to regulatory approvals and customary closing conditions, including fund board, fund shareholder and other required client approvals.
Columbia recorded a net loss of $7 million compared to a net loss of $469 million in 2008. Net revenue increased $539 million due to a reduction in losses of $917 million related to support provided to certain cash funds offset by lower investment and brokerage services income of $406 million. The decrease in investment and brokerage services income was driven by the impact of lower average equity market levels and net outflows primarily in the cash complex. Noninterest expense decreased $194 million driven by lower revenue-related expenses, such as lower sub-advisory, distribution and dealer support expenses, and reduced personnel-related expenses.
Cash Funds Support
Beginning in the second half of 2007, we provided support to certain cash funds managed within Columbia. The funds for which we provided support typically invested in high quality, short-term securities with a portfolio weighted-average maturity of 90 days or less, including securities issued by SIVs and senior debt holdings of financial services companies. Due to market disruptions, certain investments in SIVs and senior debt securities were downgraded by the ratings agencies and experienced a decline in fair value. We entered into capital commitments under which the Corporation provided cash to these funds in the event the net asset value per unit of a fund declined below certain thresholds. All capital commitments to these cash funds have been terminated. In 2009 and 2008, we recorded losses of $195 million and $1.1 billion related to these capital commitments.
Additionally, during 2009 and 2008, we purchased $1.8 billion and $1.7 billion of certain investments from the funds. As a result of these purchases, certain cash funds, including the Money Market Funds, managed within Columbia no longer have exposure to SIVs or other troubled assets. At December 31, 2009 and 2008, we held AFS debt securities with a fair value of $902 million and $698 million of which $423 million and $279 million were classified as nonperforming AFS debt securities and had $171 million and $272 million of related unrealized losses recorded in accumulated OCI. The decline in value of these securities was driven by the lack of market liquidity and the overall deterioration of the financial markets. These unrealized losses are recorded in accumulated OCI as we expect to recover the full principal amount of such investments and it is more-likely-than-not that we will not be required to sell the investments prior to recovery.
Other
Other includes the results of the Retirement & Philanthropic Services business, the Corporation's approximately 34 percent economic ownership interest in BlackRock and other miscellaneous items. Our investment in BlackRock is accounted for under the equity method of accounting with our proportionate share of income or loss recorded in equity investment income.
Net income increased $868 million to $891 million compared to 2008. The increase was driven by higher noninterest income offset by higher noninterest expense and lower net interest income. Net interest income decreased $406 million due to the funding cost on a management accounting basis for carrying the BlackRock investment. Noninterest income increased $2.4 billion to $2.6 billion due to the addition of the Retirement & Philanthropic Services business from Merrill Lynch and earnings from BlackRock which contributed $1.3 billion during 2009, including the $1.1 billion gain previously mentioned. Noninterest expense increased $624 million to $789 million primarily driven by the addition of the Retirement & Philanthropic Services business from Merrill Lynch.
| 40 | Bank of America 2009 |
All Other
| 2009 | 2008 | ||||||||||||||||||||||||
| (Dollars in millions) | Reported Basis (1) | Securitization Offset (2) | As Adjusted | Reported Basis (1) | Securitization Offset (2) | As Adjusted | |||||||||||||||||||
Net interest income (3) | $ | (6,922 | ) | $ | 9,250 | $ | 2,328 | $ | (8,019 | ) | $ | 8,701 | $ | 682 | |||||||||||
Noninterest income: | |||||||||||||||||||||||||
Card income (loss) | (895 | ) | 2,034 | 1,139 | 2,164 | (2,250 | ) | (86 | ) | ||||||||||||||||
Equity investment income | 9,020 | – | 9,020 | 265 | – | 265 | |||||||||||||||||||
Gains on sales of debt securities | 4,440 | – | 4,440 | 1,133 | – | 1,133 | |||||||||||||||||||
All other income (loss) | (6,735 | ) | 115 | (6,620 | ) | (711 | ) | 219 | (492 | ) | |||||||||||||||
Total noninterest income | 5,830 | 2,149 | 7,979 | 2,851 | (2,031 | ) | 820 | ||||||||||||||||||
Total revenue, net of interest expense | (1,092 | ) | 11,399 | 10,307 | (5,168 | ) | 6,670 | 1,502 | |||||||||||||||||
Provision for credit losses | (3,431 | ) | 11,399 | 7,968 | (3,769 | ) | 6,670 | 2,901 | |||||||||||||||||
Merger and restructuring charges (4) | 2,721 | – | 2,721 | 935 | – | 935 | |||||||||||||||||||
All other noninterest expense | 1,997 | – | 1,997 | 189 | – | 189 | |||||||||||||||||||
Income (loss) before income taxes | (2,379 | ) | – | (2,379 | ) | (2,523 | ) | – | (2,523 | ) | |||||||||||||||
Income tax benefit (3) | (2,857 | ) | – | (2,857 | ) | (1,283 | ) | – | (1,283 | ) | |||||||||||||||
Net income (loss) | $ | 478 | $ | – | $ | 478 | $ | (1,240 | ) | $ | – | $ | (1,240 | ) | |||||||||||
| (1) | Provision for credit losses represents the provision for credit losses in All Other combined with the Global Card Services securitization offset. |
| (2) | The securitization offset on net interest income is on a funds transfer pricing methodology consistent with the way funding costs are allocated to the businesses. |
| (3) | FTE basis |
| (4) | For more information on merger and restructuring charges, see Note 2 – Merger and Restructuring Activity to the Consolidated Financial Statements. |
| (Dollars in millions) | 2009 | 2008 | ||||
Balance Sheet | ||||||
Average | ||||||
Total loans and leases (1) | $ | 155,561 | $ | 135,789 | ||
Total assets (1 , 2) | 239,642 | 77,244 | ||||
Total deposits | 103,122 | 105,725 | ||||
Allocated equity (3) | 49,015 | 16,563 | ||||
Year end | ||||||
Total loans and leases (1) | $ | 152,944 | $ | 136,163 | ||
Total assets (1 , 2) | 137,382 | 79,420 | ||||
Total deposits | 78,618 | 86,888 | ||||
| (1) | Loan amounts are net of the securitization offset of $98.5 billion and $104.4 billion for 2009 and 2008 and $89.7 billion and $101.0 billion at December 31, 2009 and 2008. |
| (2) | Includes elimination of segments' excess asset allocations to match liabilities (i.e., deposits) of $511.0 billion and $413.1 billion for 2009 and 2008 and $561.6 billion and $439.2 billion at December 31, 2009 and 2008. |
| (3) | Increase in allocated equity was due to capital raises during 2009. |
Global Card Services is reported on a managed basis which includes a securitization impact adjustment which has the effect of assuming that loans that have been securitized were not sold and presents these loans in a manner similar to the way loans that have not been sold are presented. All Other's results include a corresponding securitization offset which removes the impact of these securitized loans in order to present the consolidated results on a GAAP basis (i.e., held basis). See the Global Card Services section beginning on page 29 for information on the Global Card Services managed results. The following All Other discussion focuses on the results on an as adjusted basis excluding the securitization offset. In addition to the securitization offset discussed above, All Other includes our Equity Investments businesses and Other .
Equity Investments includes Global Principal Investments, Corporate Investments and Strategic Investments. On January 1, 2009, Global
Principal Investments added Merrill Lynch's principal investments. The combined business is comprised of a diversified portfolio of investments in private equity, real estate and other alternative investments. These investments are made either directly in a company or held through a fund with related income recorded in equity investment income. Global Principal Investments has unfunded equity commitments amounting to $2.5 billion at December 31, 2009 related to certain of these investments. For more information on these commitments, see Note 14 – Commitments and Contingencies to the Consolidated Financial Statements.
Corporate Investments primarily includes investments in publicly traded debt and equity securities and funds which are accounted for as AFS marketable equity securities. Strategic Investments includes investments of $9.2 billion in CCB, $5.4 billion in Itaú Unibanco Holding S.A. (Itaú Unibanco), $2.5 billion in Grupo Financiero Santander, S.A. (Santander) and other investments. Our shares of Itaú Unibanco are accounted for as AFS marketable equity securities. Our investment in Santander is accounted for under the equity method of accounting.
In 2009, we sold 19.1 billion common shares representing our entire initial investment in CCB for $10.1 billion, resulting in a pre-tax gain of $7.3 billion. During 2008, under the terms of the CCB purchase option, we increased our ownership by purchasing approximately 25.6 billion common shares for $9.2 billion. We continue to hold the shares purchased in 2008.
These shares are accounted for at cost, are recorded in other assets and are non-transferable until August 2011. We remain a significant shareholder in CCB with an approximate 11 percent ownership interest and intend to continue the important long-term strategic alliance with CCB originally entered into in 2005. As part of this alliance, we expect to continue to provide advice and assistance to CCB.
| Bank of America 2009 | 41 |
The following table presents the components of All Other's equity investment income and reconciliation to the total consolidated equity investment income for 2009 and 2008 and also All Other's equity investments at December 31, 2009 and 2008.
Equity Investment Income
| (Dollars in millions) | 2009 | 2008 | ||||||
Global Principal Investments | $ | 1,222 | $ | (84 | ) | |||
Corporate Investments | (88 | ) | (520 | ) | ||||
Strategic and other investments | 7,886 | 869 | ||||||
Total equity investment income included in All Other | 9,020 | 265 | ||||||
Total equity investment income included in the business segments | 994 | 274 | ||||||
Total consolidated equity investment income | $ | 10,014 | $ | 539 | ||||
| Equity Investments | ||||||||
| December 31 | ||||||||
| 2009 | 2008 | |||||||
Global Principal Investments | $ | 14,071 | $ | 3,812 | ||||
Corporate Investments | 2,731 | 2,583 | ||||||
Strategic and other investments | 17,860 | 25,027 | ||||||
Total equity investments included in All Other | $ | 34,662 | $ | 31,422 | ||||
Other includes the residential mortgage portfolio associated with ALM activities, the residual impact of the cost allocation processes, merger and restructuring charges, intersegment eliminations and the results of certain businesses that are expected to be or have been sold or are in the process of being liquidated. Other also includes certain amounts associated with ALM activities, including the residual impact of funds transfer pricing allocation methodologies, amounts associated with the change in the value of derivatives used as economic hedges of interest rate and foreign exchange rate fluctuations, impact of foreign exchange rate fluctuations related to revaluation of foreign currency-denominated debt, fair value adjustments on certain structured notes, certain gains (losses) on sales of whole mortgage loans and gains (losses) on sales of debt securities. In addition, Other includes adjustments to net interest income and income tax expense to remove the FTE effect of items (primarily low-income housing tax credits) that are reported on a FTE basis in the business segments. Other also includes a trust services business which is a client-focused business providing trustee services and fund administration to various financial services companies.
First Republic results are also included in Other . First Republic, acquired as part of the Merrill Lynch acquisition, provides personalized, relationship-based banking services including private banking, private business banking, real estate lending, trust, brokerage and investment management. First Republic is a stand-alone bank that operates primarily on the west coast and in the northeast and caters to high-end customers. On October 21, 2009, we reached an agreement to sell First Republic to a number of investors, led by First Republic's existing management, Colony Capital, LLC and General Atlantic, LLC. The transaction is expected to close in the second quarter of 2010 subject to regulatory approval.
All Other recorded net income of $478 million in 2009 compared to a net loss of $1.2 billion in 2008 as higher total revenue driven by increases in noninterest income, net interest income and an income tax benefit were partially offset by increased provision for credit losses, merger and restructuring charges and all other noninterest expense.
Net interest income increased $1.6 billion to $2.3 billion primarily due to unallocated net interest income related to increased liquidity driven in
part by capital raises during 2009 and the addition of First Republic in 2009.
Noninterest income increased $7.2 billion to $8.0 billion driven by higher equity investment income of $8.8 billion, increased gains on sales of debt securities of $3.3 billion and increased card income of $1.2 billion. These items were partially offset by a decrease in all other income of $6.1 billion. The increase in equity investment income was driven by a $7.3 billion gain on the sale of a portion of our CCB investment and positive valuation adjustments on public and private investments within Global Principal Investments. The decrease in all other income was driven by the $4.9 billion negative credit valuation adjustments on certain Merrill Lynch structured notes due to an improvement in credit spreads during 2009. In addition, we recorded other-than-temporary impairments of $1.6 billion related to non-agency CMOs included in the ALM debt securities portfolio during the year.
Provision for credit losses increased $5.1 billion to $8.0 billion. This increase was primarily due to higher credit costs related to our ALM residential mortgage portfolio reflecting deterioration in the housing markets and the impacts of a weak economy.
Merger and restructuring charges increased $1.8 billion to $2.7 billion due to the Merrill Lynch and Countrywide acquisitions. The Merrill Lynch acquisition was accounted for in accordance with new accounting guidance for business combinations effective on January 1, 2009 requiring that acquisition-related transaction and restructuring costs be charged to expense. Previously these costs were recorded as an adjustment to goodwill. This change in accounting drove a portion of the increase. We recorded $1.8 billion of merger and restructuring charges during 2009 related to the Merrill Lynch acquisition, the majority of which related to severance and employee-related charges. The remaining merger and restructuring charges related to Countrywide and ABN AMRO North America Holding Company, parent of LaSalle Bank Corporation (LaSalle). For additional information on merger and restructuring charges and systems integrations, see Note 2 – Merger and Restructuring Activity to the Consolidated Financial Statements. All other noninterest expense increased $1.8 billion to $2.0 billion due to higher personnel costs and a $425 million charge to pay the U.S. government to terminate its asset guarantee term sheet.
Income tax benefit in 2009 increased $1.6 billion primarily as a result of the release of a portion of a valuation allowance that was provided for an acquired capital loss carryforward.
Obligations and Commitments
We have contractual obligations to make future payments on debt and lease agreements. Additionally, in the normal course of business, we enter into contractual arrangements whereby we commit to future purchases of products or services from unaffiliated parties. Obligations that are legally binding agreements whereby we agree to purchase products or services with a specific minimum quantity defined at a fixed, minimum or variable price over a specified period of time are defined as purchase obligations. Included in purchase obligations are commitments to purchase loans of $9.5 billion and vendor contracts of $9.1 billion. The most significant vendor contracts include communication services, processing services and software contracts. Other long-term liabilities include our contractual funding obligations related to the Qualified Pension Plans, Nonqualified Pension Plans and Postretirement Health and Life Plans (the Plans). Obligations to the Plans are based on the current and projected obligations of the Plans, performance of the Plans' assets and any participant contributions, if applicable. During 2009 and 2008, we contributed $414 million and $1.6 billion to the Plans, and we expect to make at least $346 million of contributions during 2010.
| 42 | Bank of America 2009 |
Table 9 presents total long-term debt and other obligations at December 31, 2009.
Table 9 Long-term Debt and Other Obligations
| December 31, 2009 | |||||||||||||||
| (Dollars in millions) | Due in 1 Year or Less | Due after 1 Year through 3 Years | Due after 3 Years through 5 Years | Due after 5 Years | Total | ||||||||||
Long-term debt and capital leases | $ | 99,144 | $ | 124,054 | $ | 72,103 | $ | 143,220 | $ | 438,521 | |||||
Operating lease obligations | 3,143 | 5,072 | 3,355 | 8,143 | 19,713 | ||||||||||
Purchase obligations | 11,957 | 3,667 | 1,627 | 2,119 | 19,370 | ||||||||||
Other long-term liabilities | 610 | 1,097 | 848 | 1,464 | 4,019 | ||||||||||
Total long-term debt and other obligations | $ | 114,854 | $ | 133,890 | $ | 77,933 | $ | 154,946 | $ | 481,623 | |||||
Debt, lease, equity and other obligations are more fully discussed in Note 13 – Long-term Debt and Note 14 – Commitments and Contingencies to the Consolidated Financial Statements. The Plans are more fully discussed in Note 17 – Employee Benefit Plans to the Consolidated Financial Statements.
We enter into commitments to extend credit such as loan commitments, standby letters of credit (SBLCs) and commercial letters of credit to meet the financing needs of our customers. For a summary of the total unfunded, or off-balance sheet, credit extension commitment amounts by expiration date, see the table in Note 14 – Commitments and Contingencies to the Consolidated Financial Statements.
Regulatory Initiatives
On November 12, 2009, the Federal Reserve issued the final rule related to changes to Regulation E and on May 22, 2009, the CARD Act was signed into law. For more information on the impact of these new regulations, see Regulatory Overview on page 17.
In December 2009, the Basel Committee on Banking Supervision released consultative documents on both capital and liquidity. In addition, we will begin Basel II parallel implementation during the second quarter of 2010. For more information, see Basel Regulatory Capital Requirements on page 52.
On January 21, 2010, the Federal Reserve, Office of the Comptroller of the Currency, FDIC and Office of Thrift Supervision (collectively, joint agencies) issued a final rule regarding risk-based capital and the impact of adoption of new consolidation rules issued by the FASB. The final rule eliminates the exclusion of certain asset-backed commercial paper (ABCP) program assets from risk-weighted assets and provides a reservation of authority to permit the joint agencies to require banks to treat structures that are not consolidated under the accounting standards as if they were consolidated for risk-based capital purposes commensurate with the risk relationship of the bank to the structure. In addition, the final rule allows for an optional delay and phase-in for a maximum of one year for the effect on risk-weighted assets and the regulatory limit on the inclusion of the allowance for loan and lease losses in Tier 2 capital related to the assets that must be consolidated as a result of the accounting change. The transitional relief does not apply to the leverage ratio or to assets in VIEs to which a bank provides implicit support. We have elected to forgo the phase-in period, and accordingly, we consolidated the amounts for regulatory capital purposes as of January 1, 2010. For more information on the impact of this guidance, see Impact of Adopting New Accounting Guidance on Consolidation on page 52.
On December 14, 2009, we announced our intention to increase lending to small- and medium-sized businesses to approximately $21 billion in 2010 compared to approximately $16 billion in 2009. This announcement is consistent with the U.S. Treasury's initiative, announced as part of the Financial Stability Plan on February 2, 2009, to help increase small
business owners' access to credit. As part of the initiative, the U.S. Treasury began making direct purchases of up to $15 billion of certain securities backed by Small Business Administration (SBA) loans to improve liquidity in the credit markets and purchasing new securities to ensure that financial institutions feel confident in extending new loans to small businesses. The program also temporarily raises guarantees to up to 90 percent in the SBA's loan program and temporarily eliminates certain SBA loan fees. We continue to lend to creditworthy small business customers through small business credit cards, loans and lines of credit products.
In response to the economic downturn, the FDIC implemented the Temporary Liquidity Guarantee Program (TLGP) to strengthen confidence and encourage liquidity in the banking system by allowing the FDIC to guarantee senior unsecured debt (e.g., promissory notes, unsubordinated unsecured notes and commercial paper) up to prescribed limits, issued by participating entities beginning on October 14, 2008, and continuing through October 31, 2009. We participated in this program; however, as announced in September 2009, due to improved market liquidity and our ability to issue debt without the FDIC guarantee, we, with the FDIC's agreement, exited the program and have stopped issuing FDIC-guaranteed debt. At December 31, 2009, we still had FDIC-guaranteed debt outstanding issued under the TLGP of $44.3 billion. The TLGP also offered the Transaction Account Guarantee Program (TAGP) that guaranteed noninterest-bearing deposit accounts held at participating FDIC-insured institutions on balances in excess of $250,000. We elected to opt out of the six-month extension of the TAGP which extends the program to June 30, 2010. We exited the TAGP effective December 31, 2009.
On September 21, 2009, the Corporation reached an agreement to terminate its term sheet with the U.S. government under which the U.S. government agreed in principle to provide protection against the possibility of unusually large losses on a pool of the Corporation's financial instruments that were acquired from Merrill Lynch. In connection with the termination of the term sheet, the Corporation paid a total of $425 million to the U.S. government to be allocated among the U.S. Treasury, the Federal Reserve and the FDIC.
In addition to exiting the TARP as discussed on page 18, terminating the U.S. Government's asset guarantee term sheet and exiting the TLGP, including the TAGP, we have exited or ceased participation in market disruption liquidity programs created by the U.S. government in response to the economic downturn of 2008. We have exited or repaid borrowings under the Term Auction Facility, U.S. Treasury Temporary Liquidity Guarantee Program for Money Market Funds, ABCP Money Market Fund Liquidity Facility, Commercial Paper Federal Funding Facility, Money Market Investor Funding Facility, Term Securities Lending Facility and Primary Dealer Credit Facility.
On November 17, 2009, the FDIC issued a final rule that required insured institutions to prepay on December 30, 2009 their estimated
| Bank of America 2009 | 43 |
quarterly risk-based assessments for the fourth quarter of 2009 and for all of 2010, 2011 and 2012. For the fourth quarter of 2009 and for all of 2010, the prepaid assessment rate was based on each institution's total base assessment rate for the third quarter of 2009, modified to assume that the assessment rate in effect on September 30, 2009 had been in effect for the entire third quarter of 2009. The prepaid assessment rates for 2011 and 2012 are equal to the modified third quarter 2009 total base assessment rate plus three bps adjusted quarterly for an estimated five percent annual growth rate in the assessment base through the end of 2012. As the prepayment related to future periods, it was recorded in prepaid assets for financial reporting purposes and will be recognized as expense over the coverage period.
On May 22, 2009, the FDIC adopted a rule designed to replenish the deposit insurance fund. This rule established a special assessment of five bps on each FDIC-insured depository institution's assets minus its Tier 1 capital with a maximum assessment not to exceed 10 bps of an institution's domestic deposits. This special assessment was calculated based on asset levels at June 30, 2009, and was collected on September 30, 2009. The Corporation recorded a net charge of $724 million in 2009 in connection with this assessment. Additionally, beginning April 1, 2009, the FDIC increased fees on deposits based on a revised risk-weighted methodology which increased the base assessment rates.
Pursuant to the Emergency Economic Stabilization Act of 2008 (EESA), the U.S. Treasury announced the creation of the Financial Stability Plan. This plan outlined a series of key initiatives including a new Capital Assistance Program (CAP) to help ensure that banking institutions have sufficient capital. We, as well as several other large financial institutions, are subject to the Supervisory Capital Assessment Program (SCAP) conducted by federal regulators. The objective of the SCAP is to assess losses that could occur under certain economic scenarios, including economic conditions more severe than anticipated. As a result of the SCAP, in May 2009, federal regulators determined that the Corporation required an additional $33.9 billion of Tier 1 common capital to sustain more severe economic circumstances assuming a more prolonged and deeper recession over a two-year period than the majority of both private and government economists projected. We achieved the increased capital requirement during the first half of 2009 through strategic transactions that increased common capital, including the expected reductions in preferred dividends and related reduction in deferred tax asset disallowances, by approximately $39.7 billion and significantly exceeded the SCAP buffer. This Tier 1 common capital increase resulted from the exchange of approximately $14.8 billion aggregate liquidation preference of non-government preferred shares into approximately 1.0 billion common shares, an at-the-market offering of 1.25 billion common shares for $13.5 billion, a $4.4 billion benefit (including associated tax effects) related to the sale of shares of CCB, a $3.2 billion benefit (net of tax and including an approximate $800 million reduction in goodwill and intangibles) related to the gain from the contribution of our merchant processing business to a joint venture, $1.6 billion due to reduced actual and forecasted preferred dividends throughout 2009 and 2010 related to the exchange of preferred for common shares and a $2.2 billion reduction in the deferred tax asset disallowance for Tier 1 common capital from the preceding items.
On March 4, 2009, the U.S. Treasury provided details related to the $75 billion Making Home Affordable program (MHA). The MHA is focused on reducing the number of foreclosures and making it easier for customers to refinance loans. The MHA consists of the Home Affordable Modification Program (HAMP) which provides guidelines on first lien loan modifications, and the Home Affordable Refinance Program (HARP) which provides guidelines for loan refinancing. The HAMP is designed to help at-risk homeowners avoid foreclosure by reducing payments. This program
provides incentives to lenders to modify all eligible loans that fall under the guidelines of this program. The HARP is available to approximately four to five million homeowners who have a proven payment history on an existing mortgage owned by the Federal National Mortgage Association (FNMA) or the Federal Home Loan Mortgage Corporation (FHLMC). The HARP is designed to help eligible homeowners refinance their mortgage loans to take advantage of current lower mortgage rates or to refinance adjustable-rate mortgages (ARM) into more stable fixed-rate mortgages.
As part of the MHA program, on April 28, 2009, the U.S. government announced intentions to create the second lien modification program (2MP) that will be designed to reduce the monthly payments on qualifying home equity loans and lines of credit under certain conditions, including completion of a HAMP modification on the first mortgage on the property. This program will provide incentives to lenders to modify all eligible loans that fall under the guidelines of this program. On January 26, 2010, we formally announced that we will participate in the 2MP once program details are finalized. We will modify eligible second liens regardless of whether the MHA modified first lien is serviced by Bank of America or another participating servicer.
Another addition to the HAMP is the recently announced Home Affordable Foreclosure Alternatives (HAFA) program to assist borrowers with non-retention options instead of foreclosure. The HAFA program provides incentives to lenders to assist all eligible borrowers that fall under the guidelines of this program. Our first goal is to work with the borrower to determine if a loan modification or other homeownership retention solution is available before pursuing non-retention options such as short sales. Short sales are an important option for homeowners who are facing financial difficulty and do not have a viable option to remain in the home. HAFA's short sale guidelines are designed to streamline and standardize the process and will be compatible with Bank of America's new cooperative short sale program.
As of January 2010, approximately 220,000 Bank of America customers were already in a trial-period modification under the MHA program. We will continue to help our customers address financial challenges through these government programs and our own home retention programs.
Managing Risk
Overview
The Corporation's risk management infrastructure is evolving to meet the challenges posed by the increased complexity of the financial services industry and markets, by our increased size and global footprint, and by the rapid and significant financial crisis of the past two years. We have redefined our risk framework, articulated a risk appetite approved by the Board of Directors (the Board), and begun the roll out and implementation of our risk plan. While many of these processes, and roles and responsibilities continue to evolve and mature, we will ensure that we continue to enhance our risk management process with a focus on clarity of roles and accountabilities, escalation of issues, aggregation of risk and data across the enterprise, and effective governance characterized by clarity and transparency.
Given our wide range of business activities as well as the competitive dynamics, the regulatory environment and the geographic span of such activities, risk taking is an inherent activity for the Corporation. Consequently, we take a comprehensive approach to risk management. Risk management planning is fully integrated with strategic, financial and customer/client planning so that goals and responsibilities are aligned across the organization. Risk is managed in a systematic manner by focusing on the Corporation as a whole and managing risk across the enterprise and within individual business units, products, services and transactions. We maintain a governance structure that delineates the
| 44 | Bank of America 2009 |
responsibilities for risk management activities, as well as governance and the oversight of those activities, by executive management and the Board.
Economic capital is assigned to each business segment using a risk-adjusted methodology incorporating each segment's stand-alone credit, market, interest rate and operational risk components, and is used to measure risk-adjusted returns. Executive management assesses, and the Board oversees, the risk-adjusted returns of each business through review and approval of strategic and financial operating plans. By allocating economic capital to and establishing a risk appetite for a line of business, we effectively manage the ability to take on risk. Businesses operate within their credit, market, compliance, and operational risk standards and limits in order to adhere to the risk appetite. These limits are based on analyses of risk and reward in each line of business, and executive management is responsible for tracking and reporting performance measurements as well as any exceptions to guidelines or limits. The Board monitors financial performance, execution of the strategic and financial operating plans, compliance with the risk appetite and the adequacy of internal controls through its committees.
Our business exposes us to strategic, credit, market, liquidity, compliance, operational and reputational risk. Strategic risk is the risk that adverse business decisions, ineffective or inappropriate business plans, or failure to respond to changes in the competitive environment, business cycles, customer preferences, product obsolescence, execution and/or other intrinsic risks of business will impact our ability to meet our objectives. Credit risk is the risk of loss arising from a borrower's or counterparty's inability to meet its obligations. Market risk is the risk that values of assets and liabilities or revenues will be adversely affected by changes in market conditions such as interest rate movements. Liquidity risk is the inability to accommodate liability maturities and deposit withdrawals, fund asset growth and meet contractual obligations through unconstrained access to funding at reasonable market rates. Compliance risk is the risk posed by the failure to manage regulatory, legal and ethical issues that could result in monetary damages, losses or harm to our reputation or image. Operational risk is the risk of loss resulting from inadequate or failed internal processes, people and systems or external events. Reputational risk, the risk that negative publicity will adversely affect the Corporation, is managed as a natural part of managing the other six types of risk. The following sections, Strategic Risk Management on page 47, Liquidity Risk and Capital Management beginning on page 47, Credit Risk Management beginning on page 54, Market Risk Management beginning on page 79, Compliance Risk Management on page 86, and Operational Risk Management beginning on page 86, address in more detail the specific procedures, measures and analyses of the major categories of risk that the Corporation manages.
On October 28, 2009, the Board approved the Risk Framework and Risk Appetite Statement for the Corporation. The Risk Framework is designed to be used by our associates to understand risk management activities, including their individual roles and accountabilities. The Risk Framework defines how risk management is integrated into our core business processes, and it defines the risk management governance structure, including management's involvement. The risk management responsibilities of the lines of business, Governance and Control functions, and Corporate Audit are also clearly defined. The Risk Framework reflects how the Board-approved risk appetite influences business and risk strategy. The management process (i.e., identify and measure risk, mitigate and control risk, monitor and test risk, and report and review risk) was enhanced for execution across all business activities. The Risk Framework supports the accountability of the Corporation and its associates to ensure the integrity of assets and the quality of earnings. The Risk Appetite Statement defines the parameters under which we will take
risk to maximize our long-term results by ensuring the integrity of our assets and the quality of our earnings. Our intent is for our risk appetite to reflect a "through the cycle" view which will be reviewed and assessed annually.
Risk Management Processes and Methods
To ensure that our corporate goals and objectives, risk appetite, and business and risk strategies are achieved, we utilize a risk management process that is applied in executing all business activities. All functions and roles fall into one of three categories where risk must be managed. These are lines of business, Governance and Control (Global Risk Management or other support groups) and Corporate Audit.
The lines of business are responsible for identifying and managing all existing, reputational and emerging risks in their business units, since this is where most of our risk-taking occurs. Line of business management makes and executes the business plan and is closest to the changing nature of risks and, therefore, we believe is best able to implement procedures and controls that align to policies and limits. Risk self-assessments conducted by the business are used to identify risks and calibrate the severity of potential risk issues. These assessments are reviewed by the lines of business and executive management, including senior Risk executives. To the extent appropriate, the assessments are reviewed by the Board or its committees to ensure appropriate risk management and oversight, and to identify enterprise-wide issues. Our management processes, structures and policies aid us in complying with laws and regulations and provide clear lines for decision-making and accountability. Wherever practical, we attempt to house decision-making authority as close to the transaction as possible while retaining supervisory control functions from both inside and outside of the lines of business.
The Governance and Control functions include our Risk Management, Finance, Treasury, Technology and Operations, Human Resources, and Legal functions. These groups are independent of the lines of business and are organized with both line of business-aligned and enterprise-wide functions. The Governance and Control functions are accountable for setting policies, standards and limits according to the Risk Appetite Statement, providing risk reporting and monitoring, and ensuring compliance. For example, in Global Risk Management, a senior risk executive is assigned to each of the lines of business and is responsible for the oversight of all the risks associated with that line of business and ensuring compliance with policies, standards and limits. Enterprise-level risk executives have responsibility to develop and implement the framework for policies and practices to assess and manage enterprise-wide credit, market, compliance and operational risks.
Corporate Audit provides an independent assessment of our management and internal control systems through testing of key processes and controls across the organization. Corporate Audit activities are designed to provide reasonable assurance that resources are adequately protected; significant financial, managerial and operating information is materially complete, accurate and reliable; and employees' actions are in compliance with the Corporation's policies, standards, procedures, and applicable laws and regulations.
We use a risk management process, applied across the execution of all business activities, that is designed to identify and measure, mitigate and control, monitor and test, and report and review risks. This process enables us to review risks in an integrated and comprehensive manner and make strategic and business decisions based on that comprehensive view. Corporate goals and objectives and risk appetite are established by executive management, approved by the Board, and are inputs to setting business and risk strategy which guide the execution of business activities. Governance, continuous feedback, and independent testing and validation provide structured controls, reporting and audit of the execution
| Bank of America 2009 | 45 |
of risk processes and business activities. Examples of tools, methods and processes used include: self-assessments conducted by the lines of business in concert with independent risk assessments by Governance and Control (part of "identify and measure"); a system of controls and supervision which provides assurance that associates act in accordance with laws, regulations, policies and procedures (part of "mitigate and control"); independent testing of control and mitigation plans by Credit Review and Corporate Audit (part of "monitor and test"); and a summary risk report which includes key risk metrics that measure the performance of the Corporation against risk limits and the Risk Appetite Statement (part of "report and review").
The formal processes used to manage risk represent only one portion of our overall risk management process. Corporate culture and the actions of our associates are also critical to effective risk management. Through our Code of Ethics, we set a high standard for our associates. The Code of Ethics provides a framework for all of our associates to conduct themselves with the highest integrity in the delivery of our products or services to our customers. We instill a risk-conscious culture through communications, training, policies, procedures, and organizational roles and responsibilities. Additionally, we continue to strengthen the linkage between the associate performance management process and individual compensation to encourage associates to work toward enterprise-wide risk goals.
Board Oversight
The Board oversees management of the Corporation's businesses and affairs. In its oversight of the Corporation, the Board's goal is to set the tone for the highest ethical standards and performance of our management, associates and the Corporation as a whole. The Board strongly believes that good corporate governance practices are important for successful business performance. Our corporate governance practices are designed to align the interests of the Board and management with those of our stockholders and to promote honesty and integrity throughout the Corporation. Over the past year, we have enhanced our corporate governance practices in many important ways, and we continue to monitor best practices to promote a high level of performance from the Board, management and our associates. The Board has adopted Corporate Governance Guidelines that embody long-standing practices of the Corporation as well as current corporate governance best practices.
In 2009, the Board established a special Board committee with five non-management members (the "Special Governance Committee") to review and recommend changes in all aspects of the Board's activities. In recognition of the increased complexity of our company following the major acquisitions of Merrill Lynch and Countrywide, and the challenges of the current business environment, the Board has strengthened its membership by appointing new directors who are independent of management and demonstrate significant banking, financial and investment banking expertise. In addition, the Board has assessed and further developed its structures and processes through which it fulfills its oversight role by the following: modifying committee membership and leadership to best leverage the abilities and backgrounds of the Board members; recasting the Asset Quality Committee as a more targeted and focused Credit Committee and establishing the Enterprise Risk Committee such that these two committees, together with the Audit Committee, work in complement to ensure that key aspects of risk, capital and liquidity management are specifically overseen by committees with clear and affirmative oversight responsibilities set forth in their committee charters; working with management and outside regulatory experts to redesign
management reports to the Board and committees; periodically reviewing the composition of the Board in light of the Corporation's business and structure to identify and nominate director candidates who possess relevant experience, qualifications, attributes and skills to the Board; and enhancing the director orientation process to include, among other changes, increased interaction with executive management and increased focus on key risks.
At the Corporation, the Audit, Credit and Enterprise Risk Committees are charged with a majority of the risk oversight responsibilities on behalf of the Board. In 2009, as noted above, the Board recast the Asset Quality Committee as a more targeted and focused Credit Committee and established a new Enterprise Risk Committee. The Credit Committee oversees, among other things, the management of our credit exposures on an enterprise-wide basis, our response to trends affecting those exposures, the adequacy of the allowance for credit losses and our credit related policies. The Enterprise Risk Committee, among other things, oversees our management of and policies and procedures with respect to material risks on an enterprise-wide basis, including market risk, interest rate risk, liquidity risk and reputational risk. It also oversees our capital management and liquidity planning. The Audit Committee retains oversight responsibility for operational risk, the integrity of our consolidated financial statements, compliance, legal risk and overall policies and practices relating to risk management. In addition to the three risk oversight committees, the Compensation and Benefits Committee oversees the Corporation's compensation practices in order that they do not encourage unnecessary and excessive risk taking by our associates.
The Audit, Credit and Enterprise Risk Committees work in tandem to provide enterprise-wide oversight of the Corporation's management and handling of risk. Each of these three committees reports regularly to the Board on risk-related matters within its responsibilities and together this provides the Board with integrated insight about our management of strategic, credit, market, liquidity, compliance, operational and reputational risks.
Starting in 2009, the Board formalized its process of approving the Corporation's articulation of its risk appetite, which is used internally to help the directors and management understand more clearly the Corporation's tolerance for risk in each of the major risk categories, the way those risks are measured and the key controls available that influence the Corporation's level of risk-taking. The Board intends to undertake this process annually going forward. The Board also approves, at a high level, following proposal by management, the Corporation's framework for managing risk.
At meetings of the Board and the Audit, Credit and Enterprise Risk Committees, directors receive updates from management regarding enterprise risk management, including our performance against the identified risk appetite. The Chief Risk Officer, who is responsible for instituting risk management practices that are consistent with our overall business strategy and risk appetite, and the General Counsel, who manages legal risk, both report directly to the Chief Executive Officer and lead management's risk and legal risk discussions at Board and committee meetings. In addition, the Corporate General Auditor, who is responsible for assessing the company's control environment over significant financial, managerial, and operating information, is independent of management and reports directly to the Audit Committee. The Corporate General Auditor also administratively reports to our Chief Executive Officer. Outside of formal meetings, Board members have regular access to senior executives, including the Chief Risk Officer and the General Counsel.
| 46 | Bank of America 2009 |
Strategic Risk Management
Strategic risk is embedded in every line of business and is part of the other major risk categories (credit, market, liquidity, compliance and operational). It is the risk that results from adverse business decisions, ineffective or inappropriate business plans, or failure to respond to changes in the competitive environment, business cycles, customer preferences, product obsolescence, regulatory environment, business strategy execution, and/or other inherent risks of the business including reputational risk. In the financial services industry, strategic risk is high due to changing customer and regulatory environments. The Corporation's appetite for strategic risk is continually assessed within the context of the strategic plan, with strategic risks selectively and carefully taken to maintain relevance in the evolving marketplace. Strategic risk is managed in the context of our overall financial condition and assessed, managed and acted on by the Chief Executive Officer and executive management team. Significant strategic actions, such as material acquisitions or capital actions, are reviewed and approved by the Board.
Using a plan developed by management, executive management and the Board approve a strategic plan every two to three years. Annually, executive management develops a financial operating plan and the Board reviews and approves the plan. Executive management, with Board oversight, ensures that the plans are consistent with the Corporation's strategic plan, core operating tenets and risk appetite. The following are assessed in their reviews: forecasted earnings and returns on capital; the current risk profile and changes required to support the plan; current capital and liquidity requirements and changes required to support the plan; stress testing results; and other qualitative factors such as market growth rates and peer analysis. Executive management, with Board oversight, performs similar analyses throughout the year, and will define changes to the financial forecast or the risk, capital or liquidity positions as deemed appropriate to balance and optimize between achieving the targeted risk appetite and shareholder returns and maintaining the targeted financial strength.
We use proprietary models to measure the capital requirements for credit, country, market, operational and strategic risks. The economic capital assigned to each line of business is based on its unique risk exposures. With oversight by the Board, executive management assesses the risk-adjusted returns of each business in approving strategic and financial operating plans. The businesses use economic capital to define business strategies, price products and transactions, and evaluate client profitability.
Liquidity Risk and Capital Management
Funding and Liquidity Risk Management
We define liquidity risk as the potential inability to meet our contractual and contingent financial obligations, on- or off-balance sheet, as they come due. Our primary liquidity objective is to ensure adequate funding for our businesses throughout market cycles, including during periods of financial stress. To achieve that objective we analyze and monitor our liquidity risk, maintain excess liquidity and access diverse funding sources including our stable deposit base. We define excess liquidity as readily available assets, limited to cash and high-quality liquid unencumbered securities, that we can use to meet our funding requirements as those obligations arise.
Global funding and liquidity risk management activities are centralized within Corporate Treasury. We believe that a centralized approach to funding and liquidity risk management enhances our ability to monitor liquidity requirements, maximizes access to funding sources, minimizes borrowing costs and facilitates timely responses to liquidity events.
The Board approves the Corporation's liquidity policy and contingency funding plan, including establishing liquidity risk tolerance levels. The Asset and Liability Market Risk Committee (ALMRC), in conjunction with the Board and its committees, monitors our liquidity position and reviews the impact of strategic decisions on our liquidity. ALMRC is responsible for managing liquidity risks and ensuring exposures remain within the established tolerance levels. ALMRC delegates additional oversight responsibilities to the Risk Oversight Committee (ROC), which reports to ALMRC. ROC reviews and monitors our liquidity position, cash flow forecasts, stress testing scenarios and results, and implements our liquidity limits and guidelines. For more information, refer to Board Oversight on page 46.
Under this governance framework, we have developed the following funding and liquidity risk management practices:
| • | Maintain excess liquidity at the parent company and selected subsidiaries, including our bank and broker/dealer subsidiaries |
| • | Determine what amounts of excess liquidity are appropriate for these entities based on analysis of debt maturities and other potential cash outflows, including those that we may experience during stressed market conditions |
| • | Diversify funding sources, considering our asset profile and legal entity structure |
| • | Perform contingency planning |
Global Excess Liquidity Sources and Other Unencumbered Assets
We maintain excess liquidity available to the parent company and selected subsidiaries in the form of cash and high-quality, liquid, unencumbered securities that together serve as our primary means of liquidity risk mitigation. We call these assets our "Global Excess Liquidity Sources," and we limit the composition of high-quality, liquid, unencumbered securities to U.S. government securities, U.S. agency securities, U.S. agency MBS and a select group of non-U.S. government securities. We believe we can quickly obtain cash for these securities, even in stressed market conditions, through repurchase agreements or outright sales. We hold these assets in entities that allow us to meet the liquidity requirements of our global businesses and we consider the impact of potential regulatory, tax, legal and other restrictions that could limit the transferability of funds among entities.
Our Global Excess Liquidity Sources totaled $214 billion at December 31, 2009 and were maintained as presented in the table below.
Table 10 Global Excess Liquidity Sources
December 31, 2009
| (Dollars in billions) | |||
Parent company | $ | 99 | |
Bank subsidiaries | 89 | ||
Broker/dealers | 26 | ||
Total global excess liquidity sources | $ | 214 | |
As noted above, the excess liquidity available to the parent company is held in cash and high-quality, liquid, unencumbered securities and totaled $99 billion at December 31, 2009. Typically, parent company cash is deposited overnight with Bank of America, N.A.
Our bank subsidiaries' excess liquidity sources at December 31, 2009 consisted of $89 billion in cash on deposit at the Federal Reserve and high-quality, liquid, unencumbered securities. These amounts are distinct from the cash deposited by the parent company, as previously described. In addition to their excess liquidity sources, our bank sub -
| Bank of America 2009 | 47 |
sidiaries hold significant amounts of other unencumbered securities that we believe they could also use to generate liquidity, such as investment grade ABS and municipal bonds. Another way our bank subsidiaries can generate incremental liquidity is by pledging a range of other unencumbered loans and securities to certain FHLBs and the Federal Reserve Discount Window. The cash we could have obtained at December 31, 2009 by borrowing against this pool of specifically identified eligible assets was approximately $187 billion. We have established operational procedures to enable us to borrow against these assets, including regularly monitoring our total pool of eligible loan and securities collateral. Due to regulatory restrictions, liquidity generated by the bank subsidiaries may only be used to fund obligations within the bank subsidiaries and may not be transferred to the parent company or other nonbank subsidiaries.
Our broker/dealer subsidiaries' excess liquidity sources at December 31, 2009 consisted of $26 billion in cash and high-quality, liquid, unencumbered securities. Our broker/dealers also held significant amounts of other unencumbered securities we believe they could utilize to generate additional liquidity, including investment grade corporate bonds, ABS and equities. Liquidity held in a broker/dealer subsidiary may only be available to meet the liquidity requirements of that entity and may not be transferred to the parent company or other subsidiaries.
Time to Required Funding and Stress Modeling
We use a variety of metrics to determine the appropriate amounts of excess liquidity to maintain at the parent company and our bank and broker/dealer subsidiaries. The primary metric we use to evaluate the appropriate level of excess liquidity at the parent company is "Time to Required Funding." This debt coverage measure indicates the number of months that the parent company can continue to meet its unsecured contractual obligations as they come due using only its Global Excess Liquidity Sources without issuing any new debt or accessing any additional liquidity sources. We define unsecured contractual obligations for purposes of this metric as senior or subordinated debt maturities issued or guaranteed by Bank of America Corporation or Merrill Lynch & Co., Inc., including certain unsecured debt instruments, primarily structured notes, which we may be required to settle for cash prior to maturity. ALMRC has established a minimum target for "Time to Required Funding" of 21 months. "Time to Required Funding" was 25 months at December 31, 2009.
We also utilize liquidity stress models to assist us in determining the appropriate amounts of excess liquidity to maintain at the parent company and our bank and broker/dealer subsidiaries. We use these models to analyze our potential contractual and contingent cash outflows and liquidity requirements under a range of scenarios with varying levels of severity and time horizons. These scenarios incorporate market-wide and Corporation-specific events, including potential credit rating downgrades for the parent company and our subsidiaries. We consider and utilize scenarios based on historical experience, regulatory guidance, and both expected and unexpected future events.
We consider all sources of funds that we could access during each stress scenario and focus particularly on matching available sources with corresponding liquidity requirements by legal entity. We also use the stress modeling results to manage our asset-liability profile and establish limits and guidelines on certain funding sources and businesses.
Diversified Funding Sources
We fund our assets primarily with a mix of deposits and secured and unsecured liabilities through a globally coordinated funding strategy. We
diversify our funding globally across products, programs, markets, currencies and investor bases.
We fund a substantial portion of our lending activities through our deposit base which was $992 billion at December 31, 2009. Deposits are primarily generated by our Deposits, Global Banking and GWIM segments. These deposits are diversified by clients, product types and geography. Domestic deposits may be insured by the FDIC. We consider a substantial portion of our deposits to be a stable, low-cost and consistent source of funding. We believe this deposit funding is generally less sensitive to interest rate changes, market volatility or changes in our credit ratings than wholesale funding sources.
Certain consumer lending activities, primarily in our banking subsidiaries, may be funded through securitizations. Included in these consumer lending activities are the extension of mortgage, credit card, auto loans, home equity loans and lines of credit. If securitization markets are not available to us on favorable terms, we typically finance these loans with deposits or with wholesale borrowings. For additional information on securitizations see Note 8 – Securitizations to the Consolidated Financial Statements.
Our trading activities are primarily funded on a secured basis through repurchase and securities lending agreements. Due to the underlying collateral, we believe this financing is more cost-efficient and less sensitive to changes in our credit ratings than unsecured financing. Repurchase agreements are generally short-term and often occur overnight. Disruptions in secured financing markets for financial institutions have occurred in prior market cycles which resulted in adverse changes in terms or significant reductions in the availability of such financing. We manage the liquidity risks arising from secured funding by sourcing funding globally from a diverse group of counterparties, providing a range of securities collateral and pursuing longer durations when we finance lower-quality assets.
Unsecured debt, both short- and long-term, is also an important source of funding. We may issue unsecured debt through syndicated U.S. registered offerings, U.S. registered and unregistered medium-term note programs, non-U.S. medium-term note programs, non-U.S. private placements, U.S. and non-U.S. commercial paper and through other methods. We distribute a significant portion of our debt offerings through our retail and institutional sales forces to a large, diversified global investor base. Maintaining relationships with our investors is an important aspect of our funding strategy. We may also make markets in our debt instruments to provide liquidity for investors.
We issue the majority of our unsecured debt at the parent company and Bank of America, N.A. During 2009, we issued $30.2 billion and $10.5 billion of long-term senior unsecured debt at the parent company and Bank of America N.A. The primary benefits of this centralized financing strategy include greater control, reduced funding costs, wider name recognition by investors and greater flexibility to meet the variable funding requirements of subsidiaries. Where regulations, time zone differences, or other business considerations make parent company funding impractical, certain other subsidiaries may issue their own debt.
We issue unsecured debt in a variety of maturities and currencies to achieve cost-efficient funding and to maintain an appropriate maturity profile. While the cost and availability of unsecured funding may be negatively impacted by general market conditions or by matters specific to the financial services industry or Bank of America, we seek to mitigate refinancing risk by actively managing the amount of our borrowings that we anticipate will mature within any month or quarter.
At December 31, 2009, our long-term debt was issued in the currencies presented in the following table.
| 48 | Bank of America 2009 |
Table 11 Long-term Debt By Major Currency
December 31, 2009
| (Dollars in millions) | |||
U.S. Dollar | $ | 281,692 | |
Euros | 99,917 | ||
Japanese Yen | 19,903 | ||
British Pound | 16,460 | ||
Australian Dollar | 7,973 | ||
Canadian Dollar | 4,894 | ||
Swiss Franc | 2,666 | ||
Other | 5,016 | ||
Total long-term debt | $ | 438,521 | |
We use derivative transactions to manage the duration, interest rate and currency risks of our borrowings, considering the characteristics of the assets they are funding. For further details on our ALM activities, refer to Interest Rate Risk Management for Nontrading Activities beginning on page 83.
We also diversify our funding sources by issuing various types of debt instruments including structured notes. Structured notes are debt obligations that pay investors with returns linked to other debt or equity securities, indices, currencies or commodities. We typically hedge the returns we are obligated to pay on these notes with derivative positions and/or in the underlying instruments so that from a funding perspective, the cost is similar to our other unsecured long-term debt. We could be required to immediately settle certain structured note obligations for cash or other securities under certain circumstances, which we consider for liquidity planning purposes. We believe, however, that a portion of such borrowings will remain outstanding beyond the earliest put or redemption date. At December 31, 2009, we had outstanding structured notes of $57 billion.
Substantially all of our senior and subordinated debt obligations contain no provisions that could trigger a requirement for an early repayment, require additional collateral support, result in changes to terms, accelerate maturity, or create additional financial obligations upon an adverse change in our credit ratings, financial ratios, earnings, cash flows or stock price.
The U.S. government and joint agencies have introduced various programs to stabilize and provide liquidity to the U.S. financial markets since 2007. We have participated in certain of these initiatives and we repaid our borrowings under U.S. government secured financing programs during 2009. We also participated in the FDIC's TLGP which allowed us to issue senior unsecured debt that it guaranteed in return for a fee based on the amount and maturity of the debt. We issued $21.8 billion and $19.9 billion of FDIC-guaranteed long-term debt in 2009 and 2008. We have also issued short-term notes under the program. At December 31, 2009, we had $41.7 billion outstanding under the program. We no longer issue debt under this program and all of our debt issued under TLGP will mature by June 30, 2012. Under this program, our debt received the highest long-term ratings from the major credit ratings agencies which resulted in a lower total cost of issuance than if we had issued non-FDIC guaranteed long-term debt. The associated FDIC fee for the 2009 issuances was $554 million and is being amortized into expense over the stated term of
the debt. For additional information on debt funding see Note 13 – Long-term Debt to the Consolidated Financial Statements.
Contingency Planning
The Corporation maintains contingency funding plans that outline our potential responses to liquidity stress events at various levels of severity. These policies and plans are based on stress scenarios and include potential funding strategies, communication and notification procedures that we would implement in the event we experienced stressed liquidity conditions. We periodically review and test the contingency funding plans to validate efficacy and assess readiness.
Our U.S. bank subsidiaries can access contingency funding through the Federal Reserve Discount Window. Certain non-U.S. subsidiaries have access to central bank facilities in the jurisdictions in which they operate. While we do not rely on these sources in our liquidity modeling, we maintain the policies, procedures and governance processes that would enable us to access these sources if necessary.
Credit Ratings
Our borrowing costs and ability to raise funds are directly impacted by our credit ratings. In addition, credit ratings may be important to customers or counterparties when we compete in certain markets and when we seek to engage in certain transactions including over-the-counter derivatives. It is our objective to maintain high quality credit ratings.
Credit ratings and outlooks are opinions subject to ongoing review by the ratings agencies and may change from time to time based on our financial performance, industry dynamics and other factors. During 2009, the ratings agencies took numerous actions to adjust our credit ratings and outlooks, many of which were negative. The ratings agencies have indicated that our credit ratings currently reflect their expectation that, if necessary, we would receive significant support from the U.S. government. In February 2010, Standard & Poor's affirmed our current credit ratings but revised the outlook to negative from stable based on their belief that it is less certain whether the U.S. government would be willing to provide extraordinary support. Other factors that influence our credit ratings include the ratings agencies' assessment of the general operating environment, our relative positions in the markets in which we compete, reputation, liquidity position, the level and volatility of earnings, corporate governance and risk management policies, capital position and capital management practices.
The credit ratings of Merrill Lynch & Co., Inc. from the three major credit ratings agencies are the same as those of Bank of America Corporation. The major credit ratings agencies have indicated that the primary drivers of Merrill Lynch's credit ratings are Bank of America's credit ratings.
A reduction in our credit ratings or the ratings of certain asset-backed securitizations could potentially have an adverse effect on our access to credit markets, the related cost of funds and our businesses. If Bank of America Corporation or Bank of America, N.A. commercial paper or short-term credit ratings were downgraded by one level, our incremental cost of funds and potential lost funding could be material.
The credit ratings of Bank of America Corporation and Bank of America, N.A. as of February 26, 2010 are reflected in the table below.
Table 12 Credit Ratings
| Outlook | Bank of America Corporation | Bank of America, N.A. | ||||||||||||||||||
Long-term Senior Debt | Subordinated Debt | Trust Preferred | Preferred Stock | Short-term Debt | Long-term Senior Debt | Long-term Deposits | Short-term Debt | |||||||||||||
Moody's Investors Service | Stable | A2 | A3 | Baa3 | Ba3 | P-1 | Aa3 | Aa3 | P-1 | |||||||||||
Standard & Poor's | Negative | A | A- | BB | BB | A-1 | A+ | A+ | A-1 | |||||||||||
Fitch Ratings | Stable | A+ | A | BB | BB- | F1+ | A+ | AA- | F1+ | |||||||||||
| Bank of America 2009 | 49 |
Regulatory Capital
At December 31, 2009, the Corporation operated its banking activities primarily under two charters: Bank of America, N.A. and FIA Card Services, N.A. With the acquisition of Merrill Lynch on January 1, 2009, we acquired Merrill Lynch Bank USA and Merrill Lynch Bank & Trust Co., FSB. Effective July 1, 2009, Merrill Lynch Bank USA merged into Bank of America, N.A, with Bank of America, N.A. as the surviving entity. Effective November 2, 2009, Merrill Lynch Bank & Trust Co., FSB merged into Bank of America, N.A., with Bank of America, N.A. as the surviving entity. Further, with the acquisition of Countrywide on July 1, 2008, we acquired Countrywide Bank, FSB, and effective April 27, 2009, Countrywide Bank, FSB converted to a national bank with the name Countrywide Bank, N.A. and immediately thereafter merged with and into Bank of America, N.A., with Bank of America, N.A. as the surviving entity.
Certain corporate sponsored trust companies which issue trust preferred securities (Trust Securities) are not consolidated under applicable
accounting guidance. In accordance with Federal Reserve guidance, Trust Securities qualify as Tier 1 capital with revised quantitative limits that will be effective on March 31, 2011. Such limits restrict certain types of capital to 15 percent of total core capital elements for internationally active bank holding companies. In addition, the Federal Reserve revised the qualitative standards for capital instruments included in regulatory capital. Internationally active bank holding companies are those with consolidated assets greater than $250 billion or on-balance sheet exposure greater than $10 billion. At December 31, 2009, our restricted core capital elements comprised 11.8 percent of total core capital elements.
Table 13 provides a reconciliation of the Corporation's total shareholders' equity at December 31, 2009 and 2008 to Tier 1 common capital, Tier 1 capital and total capital as defined by the regulations issued by the joint agencies. See Note 16 – Regulatory Requirements and Restrictions to the Consolidated Financial Statements for more information on our regulatory capital.
Table 13 Reconciliation of Tier 1 Common Capital, Tier 1 Capital and Total Capital
| December 31 | ||||||||
| (Dollars in millions) | 2009 | 2008 | ||||||
Total common shareholders' equity | $ | 194,236 | $ | 139,351 | ||||
Goodwill | (86,314 | ) | (81,934 | ) | ||||
Nonqualifying intangible assets (1) | (8,299 | ) | (4,195 | ) | ||||
Net unrealized losses on AFS debt and marketable equity securities and net losses on derivatives | 1,034 | 5,479 | ||||||
Unamortized net periodic benefit costs recorded in accumulated OCI, net-of-tax | 4,092 | 4,642 | ||||||
Exclusion of fair value adjustment related to the Merrill Lynch structured notes (2) | 3,010 | – | ||||||
Common Equivalent Securities | 19,290 | – | ||||||
Disallowed deferred tax asset | (7,080 | ) | – | |||||
Other | 425 | (4 | ) | |||||
Total Tier 1 common capital | 120,394 | 63,339 | ||||||
Preferred stock | 17,964 | 37,701 | ||||||
Trust preferred securities | 21,448 | 18,105 | ||||||
Noncontrolling interest | 582 | 1,669 | ||||||
Total Tier 1 capital | 160,388 | 120,814 | ||||||
Long-term debt qualifying as Tier 2 capital | 43,284 | 31,312 | ||||||
Allowance for loan and lease losses | 37,200 | 23,071 | ||||||
Reserve for unfunded lending commitments | 1,487 | 421 | ||||||
Other (3) | (16,282 | ) | (3,957 | ) | ||||
Total capital | $ | 226,077 | $ | 171,661 | ||||
| (1) | Nonqualifying intangible assets include core deposit intangibles, affinity relationships, customer relationships and other intangibles. |
| (2) | Represents loss on Merrill Lynch structured notes, net-of-tax, that is excluded from Tier 1 common capital, Tier 1 capital and total capital for regulatory purposes. |
| (3) | Balance includes a reduction of $18.7 billion and $6.7 billion related to allowance for loan and lease losses exceeding 1.25 percent of risk-weighted assets in 2009 and 2008. Balance also includes 45 percent of the pre-tax unrealized fair value adjustments on AFS marketable equity securities. |
At December 31, 2009, the Corporation's Tier 1 common capital, Tier 1 capital, total capital and Tier 1 leverage ratios were 7.81 percent, 10.40 percent, 14.66 percent and 6.91 percent, respectively.
The Corporation calculates Tier 1 common capital as Tier 1 capital including CES less preferred stock, qualifying trust preferred securities, hybrid securities and qualifying noncontrolling interest. CES is included in Tier 1 common capital based upon applicable regulatory guidance and our expectation that the underlying Common Equivalent Stock would convert into common stock following shareholder approval of additional authorized shares. Shareholders approved the increase in the number of authorized shares of common stock at the special meeting of shareholders held on February 23, 2010 and the Common Equivalent Stock converted to common stock on February 24, 2010. Tier 1 common capital increased to $120.4 billion at December 31, 2009 compared to $63.3 billion at December 31, 2008. The Tier 1 common capital ratio increased 301 bps to 7.81 percent. This increase was driven primarily by the second quarter at-the-market common stock issuance and the preferred to common stock exchanges which together represented a benefit of 185 bps and the issuance of CES which together provided a benefit of 138 bps to the Tier 1 common capital ratio. In addition, Tier 1 common capital benefited from the common stock that was issued in connection with the
Merrill Lynch acquisition partially offset by an increase in risk-weighted assets due to the acquisition.
Enterprise-wide Stress Testing
As a part of our core risk management practices, the Corporation conducts enterprise-wide stress tests on a periodic basis to better understand earnings, capital and liquidity sensitivities to certain economic scenarios, including economic conditions that are more severe than anticipated. These enterprise-wide stress tests provide an understanding of the potential impacts to our risk profile, capital and liquidity. Scenario(s) are selected by a group comprised of senior line of business, risk and finance executives. Impacts to each line of business from each scenario are then analyzed and determined, primarily leveraging the models and processes utilized in everyday management routines. Impacts are assessed along with potential mitigating actions that may be taken in each scenario. Analysis from such stress scenarios is compiled for and reviewed through our ROC, ALMRC, and the Enterprise Risk Committee of the Board and serves to inform and be incorporated, along with other core business processes, into decision making by management and the Board. The Corporation continues to invest in and improve stress testing capabilities as a core business process.
| 50 | Bank of America 2009 |
Off-Balance Sheet Liquidity Arrangements with Special Purpose Entities
In the ordinary course of business, we support our customers' financing needs by facilitating their access to the commercial paper market. In addition, we utilize certain financing arrangements to meet our balance sheet management, funding and liquidity needs. These activities utilize special purpose entities (SPEs), typically in the form of corporations, limited liability companies, or trusts, which raise funds by issuing short-term commercial paper or other debt or equity instruments to third party investors. These SPEs typically hold various types of financial assets whose cash flows are the primary source of repayment for the liabilities of the SPEs. Investors have recourse to the assets in the SPE and often benefit from other credit enhancements, such as overcollateralization in the form of excess assets in the SPE, liquidity facilities and other arrangements. As a result, the SPEs can typically obtain a favorable credit rating from the ratings agencies, resulting in lower financing costs for us and our customers.
We have liquidity agreements, SBLCs and other arrangements with SPEs, as described below, under which we are obligated to provide funding in the event of a market disruption or other specified event or otherwise provide credit support to the entities. We also fund selected assets via derivative contracts with third party SPEs under which we may be
required to purchase the assets at par value or the third party SPE's cost to acquire the assets. We manage our credit risk and any market risk on these liquidity arrangements by subjecting them to our normal underwriting and risk management processes. Our credit ratings and changes thereto may affect the borrowing cost and liquidity of these SPEs. In addition, significant changes in counterparty asset valuation and credit standing may also affect the ability of the SPEs to issue commercial paper. The contractual or notional amount of these commitments as presented in Table 14 represents our maximum possible funding obligation and is not, in management's view, representative of expected losses or funding requirements.
The table below presents our liquidity exposure to unconsolidated SPEs, which include VIEs and QSPEs. VIEs are SPEs that lack sufficient equity at risk or whose equity investors do not have a controlling financial interest. QSPEs are SPEs whose activities are strictly limited to holding and servicing financial assets. As a result of our adoption of new accounting guidance on consolidation on January 1, 2010 as discussed in the following section, we consolidated all multi-seller conduits, asset acquisition conduits and credit card securitization trusts. In addition, we consolidated certain home equity securitization trusts, municipal bond trusts and credit-linked note and other vehicles.
Table 14 Off-Balance Sheet Special Purpose Entities Liquidity Exposure
| December 31, 2009 | |||||||||
| (Dollars in millions) | VIEs | QSPEs | Total | ||||||
Commercial paper conduits: | |||||||||
Multi-seller conduits | $ | 25,135 | $ | – | $ | 25,135 | |||
Asset acquisition conduits | 1,232 | – | 1,232 | ||||||
Home equity securitizations | – | 14,125 | 14,125 | ||||||
Municipal bond trusts | 3,292 | 6,492 | 9,784 | ||||||
Collateralized debt obligation vehicles | 3,283 | – | 3,283 | ||||||
Credit-linked note and other vehicles | 1,995 | – | 1,995 | ||||||
Customer-sponsored conduits | 368 | – | 368 | ||||||
Credit card securitizations | – | 2,288 | 2,288 | ||||||
Total liquidity exposure | $ | 35,305 | $ | 22,905 | $ | 58,210 | |||
| December 31, 2008 | |||||||||
| VIEs | QSPEs | Total | |||||||
Commercial paper conduits: | |||||||||
Multi-seller conduits | $ | 41,635 | $ | – | $ | 41,635 | |||
Asset acquisition conduits | 2,622 | – | 2,622 | ||||||
Other corporate conduits | – | 1,578 | 1,578 | ||||||
Home equity securitizations | – | 13,064 | 13,064 | ||||||
Municipal bond trusts | 3,872 | 2,921 | 6,793 | ||||||
Collateralized debt obligation vehicles | 542 | – | 542 | ||||||
Customer-sponsored conduits | 980 | – | 980 | ||||||
Credit card securitizations | – | 946 | 946 | ||||||
Total liquidity exposure | $ | 49,651 | $ | 18,509 | $ | 68,160 | |||
At December 31, 2009, our total liquidity exposure to SPEs was $58.2 billion, a decrease of $10.0 billion from December 31, 2008. The decrease was attributable to decreases in commercial paper conduits due to maturities and liquidations partially offset by the acquisition of Merrill Lynch. Legacy Merrill Lynch related exposures as of December 31, 2009 were $4.9 billion in municipal bond trusts, $3.3 billion in CDO vehicles and $2.0 billion in credit-linked note and other vehicles.
For more information on commercial paper conduits, municipal bond trusts, CDO vehicles, credit-linked note and other vehicles, see Note 9 – Variable Interest Entities to the Consolidated Financial Statements. For more information on home equity and credit card securitizations, see Note 8 – Securitizations to the Consolidated Financial Statements.
Customer-sponsored conduits are established by our customers to provide them with direct access to the commercial paper market. We are typically one of several liquidity providers for a customer's conduit. We do not provide SBLCs or other forms of credit enhancement to these conduits. Assets of these conduits consist primarily of auto loans and student loans. The liquidity commitments benefit from structural protections which vary depending upon the program, but given these protections, we view the exposures as investment grade quality. These commitments are included in Note 14 – Commitments and Contingencies to the Consolidated Financial Statements. As we typically provide less than 20 percent of the total liquidity commitments to these conduits and do not provide other forms of support, we have concluded that we do not hold a
| Bank of America 2009 | 51 |
significant variable interest in the conduits and they are not included in our discussion of VIEs in Note 9 – Variable Interest Entities to the Consolidated Financial Statements.
Impact of Adopting New Accounting Guidance on Consolidation
On June 12, 2009, the FASB issued new guidance on sale accounting criteria for transfers of financial assets, including transfers to QSPEs and consolidation of VIEs. As described more fully in Note 8 – Securitizations to the Consolidated Financial Statements, the Corporation routinely transfers mortgage loans, credit card receivables and other financial instruments to SPEs that meet the definition of a QSPE which are not currently subject to consolidation by the transferor. Among other things, this new guidance eliminates the concept of a QSPE and as a result, existing QSPEs generally will be subject to consolidation under the new guidance.
This new guidance also significantly changes the criteria by which an enterprise determines whether it must consolidate a VIE, as described more fully in Note 9 – Variable Interest Entities to the Consolidated Financial Statements. A VIE is an entity, typically an SPE, which has insufficient equity at risk or which is not controlled through voting rights held by
equity investors. Currently, a VIE is consolidated by the enterprise that will absorb a majority of the expected losses or expected residual returns created by the assets of the VIE. This new guidance requires that a VIE be consolidated by the enterprise that has both the power to direct the activities that most significantly impact the VIE's economic performance and the obligation to absorb losses or the right to receive benefits that could potentially be significant to the VIE. This new guidance also requires that an enterprise continually reassesses, based on current facts and circumstances, whether it should consolidate the VIEs with which it is involved.
The table below shows the impact on a preliminary basis of this new accounting guidance in terms of incremental GAAP assets and risk-weighted assets for those VIEs and QSPEs that we consolidated on January 1, 2010. The assets and liabilities of the newly consolidated credit card securitization trusts, multi-seller commercial paper conduits, home equity lines of credit and certain other VIEs are recorded at their respective carrying values. The Corporation has elected to account for the assets and liabilities of the newly consolidated asset acquisition commercial paper conduits, municipal bond trusts and certain other VIEs under the fair value option.
Table 15 Preliminary Incremental GAAP and Risk-Weighted Assets Impact
| (Dollars in billions) | Preliminary Incremental GAAP Assets | Estimated Incremental Risk-Weighted Assets | ||||
Type of VIE/QSPE | ||||||
Credit card securitization trusts ( 1 ) | $ | 70 | $ | 8 | ||
Asset-backed commercial paper conduits ( 2 ) | 15 | 11 | ||||
Municipal bond trusts | 5 | 1 | ||||
Home equity lines of credit | 5 | 5 | ||||
Other | 5 | – | ||||
Total | $ | 100 | $ | 25 | ||
| (1) | The Corporation undertook certain actions during 2009 related to its off-balance sheet credit card securitization trusts. As a result of these actions, we included approximately $63.6 billion of incremental risk-weighted assets in its risk-based capital ratios as of December 31, 2009. |
| (2) | Regulatory capital requirements changed effective January 1, 2010 for all ABCP conduits. The increase in risk-weighted assets in this table reflects the impact of these changes on all ABCP conduits, including those that were consolidated prior to January 1, 2010. |
In addition to recording the incremental assets and liabilities on the Corporation's Consolidated Balance Sheet, we recorded an after-tax charge of approximately $6 billion to retained earnings on January 1, 2010 as the cumulative effect of adoption of these new accounting standards. The charge relates primarily to the addition of $11 billion of allowance for loan losses for the newly consolidated assets, principally credit card related.
On January 21, 2010, the joint agencies issued a final rule regarding risk-based capital and the impact of adoption of the new consolidation guidance issued by the FASB. The final rule allows for a phase-in period for a maximum of one year for the effect on risk-weighted assets and the regulatory limit on the inclusion of the allowance for loan and lease losses in Tier 2 capital related to the assets that are consolidated. Our current estimate of the incremental impact is a decrease in our Tier 1 and Tier 1 common capital ratios of 65 to 75 bps. However, the final capital impact will be affected by certain factors, including, the final determination of the cumulative effect of adoption of this new accounting guidance on retained earnings, and limitations of deferred tax assets for risk-based capital purposes. The Corporation has elected to forgo the phase-in period and consolidate the amounts for regulatory capital purposes as of January 1, 2010. For more information, refer to the Regulatory Initiatives section on page 43.
Basel Regulatory Capital Requirements
In June 2004, the Basel II Accord was published with the intent of more closely aligning regulatory capital requirements with underlying risks, similar to economic capital. While economic capital is measured to cover unexpected losses, the Corporation also manages regulatory capital to adhere to regulatory standards of capital adequacy.
The Basel II Final Rule (Basel II Rules), which was published on December 7, 2007, establishes requirements for the U.S. implementation and provided detailed capital requirements for credit and operational risk under Pillar 1, supervisory requirements under Pillar 2 and disclosure requirements under Pillar 3. The Corporation will begin Basel II parallel implementation during the second quarter of 2010.
Financial institutions are required to successfully complete a minimum parallel qualification period before receiving regulatory approval to report regulatory capital using the Basel II methodology. During the parallel period, the resulting capital calculations under both the current (Basel I) rules and the Basel II Rules will be reported to the financial institutions regulatory supervisors for at least four consecutive quarterly periods. Once the parallel period is successfully completed, the financial institution will utilize Basel II as their methodology for calculating regulatory capital. A three-year transitional floor period will follow after which use of Basel I will be discontinued.
In July 2009, the Basel Committee on Banking Supervision released a consultative document entitled "Revisions to the Basel II Market Risk
| 52 | Bank of America 2009 |
Framework" that would significantly increase the capital requirements for trading book activities if adopted as proposed. The proposal recommended implementation by December 31, 2010, but regulatory agencies are currently evaluating the proposed rulemaking and related impacts before establishing final rules. As a result, we cannot determine the implementation date or the final capital impact.
In December 2009, the Basel Committee on Banking Supervision issued a consultative document entitled "Strengthening the Resilience of the Banking Sector." If adopted as proposed, this could increase significantly the aggregate equity that bank holding companies are required to hold by disqualifying certain instruments that previously have qualified as Tier 1 capital. In addition, it would increase the level of risk-weighted assets. The proposal could also increase the capital charges imposed on certain assets potentially making certain businesses more expensive to conduct. Regulatory agencies have not opined on the proposal for implementation. We continue to assess the potential impact of the proposal.
Common Share Issuances and Repurchases
In January 2009, the Corporation issued 1.4 billion shares of common stock in connection with its acquisition of Merrill Lynch. For additional information regarding the Merrill Lynch acquisition, see Note 2 – Merger
and Restructuring Activity to the Consolidated Financial Statements. In addition, during the first quarter of 2009, we issued warrants to purchase approximately 199.1 million shares of common stock in connection with preferred stock issuances to the U.S. government. For more information, see the following preferred stock discussion. During the second quarter of 2009, we issued 1.25 billion shares of common stock at an average price of $10.77 per share through an at-the-market issuance program resulting in gross proceeds of approximately $13.5 billion. In addition, we issued approximately 7.4 million shares under employee stock plans.
In connection with the TARP repayment approval, the Corporation agreed to increase equity by $3.0 billion through asset sales to be approved by the Federal Reserve and contracted for by June 30, 2010. To the extent those asset sales are not completed by the end of 2010, the Corporation must raise a commensurate amount of common equity. We also agreed to raise up to approximately $1.7 billion through the issuance in 2010 of restricted stock in lieu of a portion of incentive cash compensation to certain of the Corporation's associates as part of their 2009 year-end incentive payments.
For more information regarding our common share issuances, see Note 15 – Shareholders' Equity and Earnings Per Common Share to the Consolidated Financial Statements.
Common Stock Dividends
The following table provides a summary of our declared quarterly cash dividends on common stock during 2009 and through February 26, 2010.
Table 16 Common Stock Dividend Summary
| Declaration Date | Record Date | Payment Date | Dividend Per Share | ||||
| January 27, 2010 | March 5, 2010 | March 26, 2010 | $ | 0.01 | |||
| October 28, 2009 | December 4, 2009 | December 24, 2009 | 0.01 | ||||
| July 21, 2009 | September 4, 2009 | September 25, 2009 | 0.01 | ||||
| April 29, 2009 | June 5, 2009 | June 26, 2009 | 0.01 | ||||
| January 16, 2009 | March 6, 2009 | March 27, 2009 | 0.01 | ||||
Preferred Stock Issuances and Exchanges
During the second quarter of 2009, we completed an offer to exchange up to approximately 200 million shares of common stock at an average price of $12.70 for outstanding depositary shares of portions of certain series of preferred stock. In addition, we also entered into agreements with certain holders of other non-government perpetual preferred shares to exchange their holdings of approximately $10.9 billion aggregate liquidation preference of perpetual preferred stock into approximately 800 million shares of common stock. In total, the exchange offer and these privately negotiated exchanges covered the exchange of approximately $14.8 billion aggregate liquidation preference of perpetual preferred stock into approximately 1.0 billion shares of common stock. During the second quarter of 2009, we recorded an increase to retained earnings and net income applicable to common shareholders of approximately $580 million related to these exchanges. This represents the net of a $2.6 billion benefit due to the excess of the carrying value of our non-convertible preferred stock over the fair value of the common stock exchanged. This was partially offset by a $2.0 billion inducement to convertible preferred shareholders. The inducement represented the excess of the fair value of the common stock exchanged, which was accounted for as an induced conversion of convertible preferred stock, over the fair value of the common stock that would have been issued under the original conversion terms.
On December 2, 2009, we received approval from the U.S. Treasury and Federal Reserve to repay the U.S. government's $45.0 billion preferred stock investment provided under TARP. In accordance with the approval, on December 9, 2009, we repurchased all outstanding shares of Cumulative Perpetual Preferred Stock Series N, Series Q and Series R
issued to the U.S. Treasury as part of the TARP. While participating in the TARP we recorded $7.4 billion in dividends and accretion on the TARP Preferred Stock and repayment will save us approximately $3.6 billion in annual dividends and accretion. We did not repurchase the related common stock warrants issued to the U.S. Treasury in connection with its TARP investment. The U.S. Treasury recently announced its intention to auction these warrants during March 2010. For more detail on the TARP Preferred Stock, refer to Note 15 – Shareholders' Equity and Earnings Per Common Share to the Consolidated Financial Statements.
The Corporation repurchased the TARP Preferred Stock through the use of $25.7 billion in excess liquidity and $19.3 billion in proceeds from the sale of 1.3 billion units of CES valued at $15.00 per unit. The CES consisted of depositary shares representing interests in shares of Common Equivalent Junior Preferred Stock Series S (Common Equivalent Stock) and warrants (Contingent Warrants) to purchase an aggregate 60 million shares of the Corporation's common stock. Each depositary share represented a 1/1000 th interest in a share of Common Equivalent Stock and each Contingent Warrant granted the holder the right to purchase 0.0467 of a share of a common stock for $.01 per share. Each depositary share entitled the holder, through the depository, to a proportional fractional interest in all rights and preferences of the Common Equivalent Stock, including conversion, dividend, liquidation and voting rights.
The Corporation held a special meeting of stockholders on February 23, 2010 at which we obtained stockholder approval of an amendment to our amended and restated certificate of incorporation to increase the number of authorized shares of our common stock, and following effectiveness of the amendment, on February 24, 2010, the Common Equivalent Stock converted in full into our common stock and
| Bank of America 2009 | 53 |
the Contingent Warrants automatically expired without becoming exercisable, and the CES ceased to exist.
Credit Risk Management
The economic recession accelerated in late 2008 and continued to deepen into the first half of 2009 but has shown some signs of stabilization and possible improvement over the second half of the year. Consumers continued to be under financial stress as unemployment and underemployment remained at elevated levels and individuals spent longer periods without work. These factors combined with further reductions in spending by consumers and businesses, continued home price declines and turmoil in sectors of the financial markets continued to negatively impact both the consumer and commercial loan portfolios. During 2009, these conditions drove increases in net charge-offs and nonperforming loans and foreclosed properties as well as higher commercial criticized utilized exposure and reserve increases across most portfolios. The depth, breadth and duration of the economic downturn, as well as the resulting impact on the credit quality of the loan portfolios remain unclear into 2010.
We continue to refine our credit standards to meet the changing economic environment. In our consumer businesses, we have implemented a number of initiatives to mitigate losses. These include increased use of judgmental lending and adjustment of underwriting, and account and line management standards and strategies, including reducing unfunded lines where appropriate. Additionally, we have increased collections, loan modification and customer assistance infrastructures to enhance customer support. In 2009, we provided home ownership retention opportunities to approximately 460,000 customers. This included completion of 260,000 customer loan modifications with total unpaid balances of approximately $55 billion and approximately 200,000 customers who were in trial-period modifications under the government's Making Home Affordable program. As of January 2010, approximately 220,000 customers were in trial period modifications and more than 12,700 were in permanent modifications. Of the 260,000 modifications done during 2009, in terms of both the volume of modifications and the unpaid principal balance associated with the underlying loans most are in the portfolio serviced for investors and is not on our balance sheet. During 2008, Bank of America and Countrywide completed 230,000 loan modifications. The most common types of modifications include rate reductions, capitalization of past due amounts or a combination of rate reduction and capitalization of past due amounts, which are 17 percent, 21 percent and 40 percent, respectively, of modifications completed in 2009. We also provide rate and payment extensions, principal forbearance or forgiveness, and other actions. These modification types are generally considered TDRs except for certain short-term modifications where we expect to collect the full contractual principal and interest.
A number of initiatives have also been implemented in our small business commercial – domestic portfolio including changes to underwriting thresholds augmented by a judgmental decision-making process by experienced underwriters including increasing minimum FICO scores and lowering initial line assignments. We have also increased the intensity of our existing customer line management strategies.
To mitigate losses in the commercial businesses, we have increased the frequency and intensity of portfolio monitoring, hedging activity and our efforts in managing an exposure when we begin to see signs of deterioration. Our lines of business and risk management personnel use a variety of tools to continually monitor the ability of a borrower or counterparty to perform under its obligations. It is our practice to transfer the management of deteriorating commercial exposures to independent Special Asset officers as a credit approaches criticized levels. Our experi -
ence has shown that this discipline generates an objective assessment of the borrower's financial health and the value of our exposure, and maximizes our recovery upon resolution. As part of our underwriting process we have increased scrutiny around stress analysis and required pricing and structure to reflect current market dynamics. Given the volatility of the financial markets, we increased the frequency of various tests designed to understand what the volatility could mean to our underlying credit risk. Given the potential for single name risk associated with any disruption in the financial markets, we use a real-time counterparty event management process to monitor key counterparties.
Additionally, we account for certain large corporate loans and loan commitments (including issued but unfunded letters of credit which are considered utilized for credit risk management purposes) that exceed our single name credit risk concentration guidelines under the fair value option. These loans and loan commitments are then actively managed and hedged, principally by purchasing credit default protection. By including the credit risk of the borrower in the fair value adjustments, any credit spread deterioration or improvement is recorded in other income immediately as part of the fair value adjustment. As a result, the allowance for loan and lease losses and the reserve for unfunded lending commitments are not used to capture credit losses inherent in any nonperforming or impaired loans and unfunded commitments carried at fair value. See the Commercial Loans Carried at Fair Value section on page 69 for more information on the performance of these loans and loan commitments and see Note 20 – Fair Value Measurements to the Consolidated Financial Statements for additional information on our fair value option elections.
The acquisition of Merrill Lynch contributed to both our consumer and commercial loans and commitments. Acquired consumer loans consisted of residential mortgages, home equity loans and lines of credit and direct/indirect loans (principally securities-based lending margin loans). Commercial exposures were comprised of both investment and non-investment grade loans and included exposures to CMBS, monolines and leveraged finance. Consistent with other acquisitions, we incorporated the acquired assets into our overall credit risk management processes.
Consumer Portfolio Credit Risk Management
Credit risk management for the consumer portfolio begins with initial underwriting and continues throughout a borrower's credit cycle. Statistical techniques in conjunction with experiential judgment are used in all aspects of portfolio management including underwriting, product pricing, risk appetite, setting credit limits, operating processes and metrics to quantify and balance risks and returns. Statistical models are built using detailed behavioral information from external sources such as credit bureaus and/or internal historical experience. These models are a component of our consumer credit risk management process and are used, in part, to help determine both new and existing credit decisions, portfolio management strategies including authorizations and line management, collection practices and strategies, determination of the allowance for loan and lease losses, and economic capital allocations for credit risk.
For information on our accounting policies regarding delinquencies, nonperforming status and charge-offs for the consumer portfolio, see Note 1 – Summary of Significant Accounting Principles to the Consolidated Financial Statements.
Consumer Credit Portfolio
Weakness in the economy and housing markets, elevated unemployment and underemployment and tighter credit conditions resulted in deterioration across most of our consumer portfolios during 2009. However,
| 54 | Bank of America 2009 |
during the last half of the year, the unsecured consumer portfolios within Global Card Services experienced lower levels of delinquency and by the fourth quarter consumer credit began to stabilize and in some cases improve. As part of our ongoing risk mitigation and consumer client support initiatives, we have been working with borrowers to modify their loans to terms that better align with their current ability to pay. Under certain circumstances, we identify these as TDRs which are modifications where an economic concession is granted to a borrower experiencing financial difficulty. For more information on TDRs and portfolio impacts, see Nonperforming Consumer Loans and Foreclosed Properties Activity beginning on page 62 and Note 6 – Outstanding Loans and Leases to the Consolidated Financial Statements.
Table 17 presents our consumer loans and leases and our managed credit card portfolio, and related credit quality information. Nonperforming loans do not include consumer credit card, consumer loans secured by personal property or unsecured consumer loans that are past due as these loans are generally charged off no later than the end of the month in which the account becomes 180 days past due. Real estate-secured past due loans, repurchased pursuant to our servicing agreement with Government National Mortgage Association (GNMA) are not reported as nonperforming as repayments are insured by the Federal Housing Administration (FHA). Additionally, nonperforming loans and accruing balances past due 90 days or more do not include the Countrywide purchased impaired loans even though the customer may be contractually past due. Loans that were acquired from Countrywide that were considered impaired were written down to fair value upon acquisition. In addition to being included in the "Outstandings" column in the following table, these
loans are also shown separately, net of purchase accounting adjustments, for increased transparency in the "Countrywide Purchased Impaired Loan Portfolio" column. For additional information, see Note 6 – Outstanding Loans and Leases to the Consolidated Financial Statements. Under certain circumstances, loans that were originally classified as discontinued real estate loans upon acquisition have been subsequently modified and are now included in the residential mortgage portfolio shown below. The impact of the Countrywide portfolio on certain credit statistics is reported where appropriate. Refer to the Countrywide Purchased Impaired Loan Portfolio discussion beginning on page 59 for more information.
Loans that were acquired from Merrill Lynch were recorded at fair value including those that were considered impaired upon acquisition. The Merrill Lynch consumer purchased impaired loan portfolio did not materially alter the reported credit quality statistics of the consumer portfolios and is, therefore, excluded from the "Countrywide Purchased Impaired Loan Portfolio" column and discussion that follows. In addition, the nonperforming loans and delinquency statistics presented below include the Merrill Lynch purchased impaired loan portfolio based on the customer's performance under the contractual terms of the loan. At December 31, 2009, consumer loans included $47.2 billion from Merrill Lynch of which $2.0 billion of residential mortgage and $146 million of home equity loans were included in the Merrill Lynch purchased impaired loan portfolio. There were no reported net charge-offs on these loans during 2009 as the initial fair value at acquisition date already considered the estimated credit losses.
Table 17 Consumer Loans and Leases
| December 31 | ||||||||||||||||||||||||||||||
| Outstandings | Nonperforming (1) | Accruing Past Due 90 Days or More (2) | Countrywide Purchased Impaired Loan Portfolio | |||||||||||||||||||||||||||
| (Dollars in millions) | 2009 | 2008 | 2009 | 2008 | 2009 | 2008 | 2009 | 2008 | ||||||||||||||||||||||
Held basis | ||||||||||||||||||||||||||||||
Residential mortgage (3) | $ | 242,129 | $ | 248,063 | $ | 16,596 | $ | 7,057 | $ | 11,680 | $ | 372 | $ | 11,077 | $ | 10,013 | ||||||||||||||
Home equity | 149,126 | 152,483 | 3,804 | 2,637 | – | – | 13,214 | 14,099 | ||||||||||||||||||||||
Discontinued real estate (4) | 14,854 | 19,981 | 249 | 77 | – | – | 13,250 | 18,097 | ||||||||||||||||||||||
Credit card – domestic | 49,453 | 64,128 | n/a | n/a | 2,158 | 2,197 | n/a | n/a | ||||||||||||||||||||||
Credit card – foreign | 21,656 | 17,146 | n/a | n/a | 500 | 368 | n/a | n/a | ||||||||||||||||||||||
Direct/Indirect consumer (5) | 97,236 | 83,436 | 86 | 26 | 1,488 | 1,370 | n/a | n/a | ||||||||||||||||||||||
Other consumer (6) | 3,110 | 3,442 | 104 | 91 | 3 | 4 | n/a | n/a | ||||||||||||||||||||||
Total held | $ | 577,564 | $ | 588,679 | $ | 20,839 | $ | 9,888 | $ | 15,829 | $ | 4,311 | $ | 37,541 | $ | 42,209 | ||||||||||||||
Supplemental managed basis data | ||||||||||||||||||||||||||||||
Credit card – domestic | $ | 129,642 | $ | 154,151 | n/a | n/a | $ | 5,408 | $ | 5,033 | n/a | n/a | ||||||||||||||||||
Credit card – foreign | 31,182 | 28,083 | n/a | n/a | 799 | 717 | n/a | n/a | ||||||||||||||||||||||
Total credit card – managed | $ | 160,824 | $ | 182,234 | n/a | n/a | $ | 6,207 | $ | 5,750 | n/a | n/a | ||||||||||||||||||
| (1) | Nonperforming held consumer loans and leases as a percentage of outstanding consumer loans and leases were 3.61 percent (3.86 percent excluding the Countrywide purchased impaired loan portfolio) and 1.68 percent (1.81 percent excluding the Countrywide purchased impaired loan portfolio) at December 31, 2009 and 2008. |
| (2) | Accruing held consumer loans and leases past due 90 days or more as a percentage of outstanding consumer loans and leases were 2.74 percent (2.93 percent excluding Countrywide purchased impaired loan portfolio) and 0.73 percent (0.79 percent excluding the Countrywide purchased impaired loan portfolio) at December 31, 2009 and 2008. Residential mortgages accruing past due 90 days or more represent repurchases of insured or guaranteed loans. See Residential Mortgage discussion for more detail. |
| (3) | Outstandings include foreign residential mortgages of $552 million at December 31, 2009 mainly from the Merrill Lynch acquisition. We did not have any foreign residential mortgage loans at December 31, 2008. |
| (4) | Outstandings include $13.4 billion and $18.2 billion of pay option loans and $1.5 billion and $1.8 billion of subprime loans at December 31, 2009 and 2008. We no longer originate these products. |
| (5) | Outstandings include dealer financial services loans of $41.6 billion and $40.1 billion, consumer lending loans of $19.7 billion and $28.2 billion, securities-based lending margin loans of $12.9 billion and $0, and foreign consumer loans of $8.0 billion and $1.8 billion at December 31, 2009 and 2008, respectively. |
| (6 ) | Outstandings include consumer finance loans of $2.3 billion and $2.6 billion, and other foreign consumer loans of $709 million and $618 million at December 31, 2009 and 2008. |
| n/a | = not applicable |
| Bank of America 2009 | 55 |
Table 18 presents net charge-offs and related ratios for our consumer loans and leases and net losses and related ratios for our managed credit card portfolio for 2009 and 2008. The reported net charge-off ratios for residential mortgage, home equity and discontinued real estate
benefit from the addition of the Countrywide purchased impaired loan portfolio as the initial fair value adjustments recorded on those loans upon acquisition already included the estimated credit losses.
Table 18 Consumer Net Charge-offs/Net Losses and Related Ratios
| Net Charge-offs/Losses | Net Charge-off/Loss Ratios (1, 2) | |||||||||||||
| (Dollars in millions) | 2009 | 2008 | 2009 | 2008 | ||||||||||
Held basis | ||||||||||||||
Residential mortgage | $ | 4,350 | $ | 925 | 1.74 | % | 0.36 | % | ||||||
Home equity | 7,050 | 3,496 | 4.56 | 2.59 | ||||||||||
Discontinued real estate | 101 | 16 | 0.58 | 0.15 | ||||||||||
Credit card – domestic | 6,547 | 4,161 | 12.50 | 6.57 | ||||||||||
Credit card – foreign | 1,239 | 551 | 6.30 | 3.34 | ||||||||||
Direct/Indirect consumer | 5,463 | 3,114 | 5.46 | 3.77 | ||||||||||
Other consumer | 428 | 399 | 12.94 | 10.46 | ||||||||||
Total held | $ | 25,178 | $ | 12,662 | 4.22 | 2.21 | ||||||||
Supplemental managed basis data | ||||||||||||||
Credit card – domestic | $ | 16,962 | $ | 10,054 | 12.07 | 6.60 | ||||||||
Credit card – foreign | 2,223 | 1,328 | 7.43 | 4.17 | ||||||||||
Total credit card – managed | $ | 19,185 | $ | 11,382 | 11.25 | 6.18 | ||||||||
| (1) | Net charge-off/loss ratios are calculated as held net charge-offs or managed net losses divided by average outstanding held or managed loans and leases. |
| (2) | Net charge-off ratios excluding the Countrywide purchased impaired loan portfolio were 1.82 percent and 0.36 percent for residential mortgage, 5.00 percent and 2.73 percent for home equity, 5.57 percent and 1.33 percent for discontinued real estate, and 4.52 percent and 2.29 percent for the total held portfolio for 2009 and 2008. These are the only product classifications materially impacted by the Countrywide purchased impaired loan portfolio for 2009 and 2008. For all loan and lease categories, the dollar amounts of the net charge-offs were unchanged. |
We believe that the presentation of information adjusted to exclude the impacts of the Countrywide purchased impaired loan portfolio is more representative of the ongoing operations and credit quality of the business. As a result, in the following discussions of the residential mortgage, home equity and discontinued real estate portfolios, we supplement certain reported statistics with information that is adjusted to exclude the impacts of the Countrywide purchased impaired loan portfolio. In addition, beginning on page 59, we separately disclose information on the Countrywide purchased impaired loan portfolio.
Residential Mortgage
The residential mortgage portfolio, which excludes the discontinued real estate portfolio acquired with Countrywide, makes up the largest percentage of our consumer loan portfolio at 42 percent of consumer loans and leases (43 percent excluding the Countrywide purchased impaired loan portfolio) at December 31, 2009. Approximately 15 percent of the residential portfolio is in GWIM and represents residential mortgages that are originated for the home purchase and refinancing needs of our affluent customers. The remaining portion of the portfolio is mostly in All Other and is comprised of both purchased loans as well as residential loans originated for our customers which are used in our overall ALM activities.
Outstanding loans and leases decreased $5.9 billion at December 31, 2009 compared to December 31, 2008 due to lower balance sheet retention of new originations, paydowns and charge-offs as well as sales and conversions of loans into retained MBS. These decreases were offset, in part, by the acquisition of Merrill Lynch and GNMA repurchases. Merrill Lynch added $21.7 billion of residential mortgage outstandings as of December 31, 2009. At December 31, 2009 and 2008, loans past due 90 days or more and still accruing interest of $11.7 billion and $372 million were related to repurchases pursuant to our servicing agreements with GNMA where repayments are insured by the FHA. The increase was driven by the repurchase of delinquent loans from securitizations during the year as we repurchase these loans for economic reasons, with no significant detrimental impact to our risk exposure. Excluding these repurchases, the accruing loans past due 90 days or more as a percentage of consumer loans and leases would have
been 0.72 percent (0.77 percent excluding the Countrywide purchased impaired loan portfolio) and 0.67 percent (0.72 percent excluding the Countrywide purchased impaired loan portfolio) at December 31, 2009 and 2008.
Nonperforming residential mortgage loans increased $9.5 billion compared to December 31, 2008 due to the impacts of the weak housing markets and economic conditions and in part due to TDRs. For more information on TDRs, refer to the Nonperforming Consumer Loans and Foreclosed Properties Activity discussion on page 62 and Note 6 – Outstanding Loans and Leases to the Consolidated Financial Statements. At December 31, 2009, $9.6 billion or approximately 58 percent, of the nonperforming residential mortgage loans were greater than 180 days past due and had been written down to their fair values. Net charge-offs increased $3.4 billion to $4.4 billion in 2009, or 1.74 percent (1.82 percent excluding the Countrywide purchased impaired portfolio), of total average residential mortgage loans compared to 0.36 percent (0.36 percent excluding the Countrywide purchased impaired portfolio) for 2008. These increases reflect the impacts of the weak housing markets and the weak economy. See the Countrywide Purchased Impaired Loan Portfolio discussion beginning on page 59 for more information.
We mitigate a portion of our credit risk through synthetic securitizations which are cash collateralized and provide mezzanine risk protection of $2.5 billion which will reimburse us in the event that losses exceed 10 bps of the original pool balance. For further information regarding these synthetic securitizations, see Note 6 – Outstanding Loans and Leases to the Consolidated Financial Statements. The reported net charge-offs for residential mortgages do not include the benefits of amounts reimbursable under cash collateralized synthetic securitizations. Adjusting for the benefit of this credit protection, the residential mortgage net charge-off ratio in 2009 would have been reduced by 25 bps and four bps in 2008. Synthetic securitizations and the protection provided by GSEs together provided risk mitigation for approximately 32 percent and 48 percent of our residential mortgage portfolio at December 31, 2009 and 2008. Our regulatory risk-weighted assets are reduced as a result of these risk protection transactions because we transferred a portion of our credit risk to unaffiliated parties. At December 31, 2009 and 2008, these
| 56 | Bank of America 2009 |
transactions had the cumulative effect of reducing our risk-weighted assets by $16.8 billion and $34.0 billion, and strengthened our Tier 1 capital ratio by 11 bps and 24 bps and our Tier 1 common capital ratio by eight bps and 12 bps.
Below is a discussion of certain risk characteristics of the residential mortgage portfolio, excluding the Countrywide purchased impaired loan portfolio, which contributed to higher losses. These characteristics include loans with high refreshed LTVs, loans which were originated at the peak of home prices in 2006 and 2007, loans to borrowers located in the states of California and Florida where we have concentrations and where significant declines in home prices have been experienced, as well as interest-only loans. Although the disclosures below address each of these risk characteristics separately, there is significant overlap in loans with these characteristics, which contributed to a disproportionate share of the losses in the portfolio. Excluding the Countrywide purchased impaired portfolio, residential mortgage loans with all of these higher risk characteristics comprised seven percent of the total residential mortgage portfolio at December 31, 2009, but have accounted for 31 percent of the residential mortgage net charge-offs in 2009.
Residential mortgage loans with a greater than 90 percent but less than 100 percent refreshed LTV represented 11 percent of the residential mortgage portfolio and loans with a refreshed LTV greater than 100 percent represented 26 percent at December 31, 2009. Of the loans with a refreshed LTV greater than 100 percent, 90 percent were performing at December 31, 2009. Loans with a refreshed LTV greater than 100 per -
cent reflect loans where the outstanding book balance of the loan is greater than the most recent valuation of the property securing the loan. The majority of these loans have a refreshed LTV greater than 100 percent due primarily to home price deterioration from the weakened economy. Loans with refreshed FICO scores below 620 represented 16 percent of the residential mortgage portfolio.
The 2006 and 2007 vintage loans, which represented 42 percent of our residential mortgage portfolio at December 31, 2009, continued to season and have higher refreshed LTVs and accounted for 69 percent of nonperforming residential mortgage loans at December 31, 2009 and approximately 75 percent of residential mortgage net charge-offs during 2009.
The table below presents outstandings, nonperforming loans and net charge-offs by certain state concentrations for the residential mortgage portfolio. California and Florida combined represented 43 percent of the total residential mortgage portfolio and 47 percent of nonperforming residential mortgage loans at December 31, 2009, but accounted for 58 percent of the residential mortgage net charge-offs for 2009. The Los Angeles-Long Beach-Santa Ana Metropolitan Statistical Area (MSA) within California represented 12 percent and 13 percent of the total residential mortgage portfolio at December 31, 2009 and 2008. Additionally, 37 percent and 24 percent of loans in California and Florida are in reference pools of synthetic securitizations, as described above, which provide mezzanine risk protection.
Table 19 Residential Mortgage State Concentrations
| December 31 | Year Ended December 31 | |||||||||||||||||||||
| Outstandings | Nonperforming | Net Charge-offs | ||||||||||||||||||||
| (Dollars in millions) | 2009 | 2008 | 2009 | 2008 | 2009 | 2008 | ||||||||||||||||
California | $ | 82,329 | $ | 84,847 | $ | 5,967 | $ | 2,028 | $ | 1,726 | $ | 411 | ||||||||||
Florida | 16,518 | 15,787 | 1,912 | 1,012 | 796 | 154 | ||||||||||||||||
New York | 16,278 | 15,539 | 632 | 255 | 66 | 5 | ||||||||||||||||
Texas | 10,737 | 10,804 | 534 | 315 | 59 | 20 | ||||||||||||||||
Virginia | 7,812 | 9,696 | 450 | 229 | 89 | 32 | ||||||||||||||||
Other U.S./Foreign | 97,378 | 101,377 | 7,101 | 3,218 | 1,614 | 303 | ||||||||||||||||
Total residential mortgage loans (excluding the Countrywide purchased | $ | 231,052 | $ | 238,050 | $ | 16,596 | $ | 7,057 | $ | 4,350 | $ | 925 | ||||||||||
Total Countrywide purchased impaired residential mortgage loan portfolio (1) | 11,077 | 10,013 | ||||||||||||||||||||
Total residential mortgage loan portfolio | $ | 242,129 | $ | 248,063 | ||||||||||||||||||
| (1) | Represents acquired loans from Countrywide that were considered impaired and written down to fair value upon acquisition date. See page 59 for the discussion of the characteristics of the purchased impaired loans. |
Of the residential mortgage portfolio, $84.2 billion, or 35 percent, at December 31, 2009 are interest-only loans of which 89 percent were performing. Nonperforming balances on interest-only residential mortgage loans were $9.1 billion, or 55 percent, of total nonperforming residential mortgages. Additionally, net charge-offs on the interest-only portion of the portfolio represented 58 percent of the total residential mortgage net charge-offs for 2009.
The Community Reinvestment Act (CRA) encourages banks to meet the credit needs of their communities for housing and other purposes, particularly in neighborhoods with low or moderate incomes. At December 31, 2009, our CRA portfolio comprised six percent of the total residential mortgage loan balances but comprised 17 percent of nonperforming residential mortgage loans. This portfolio also comprised 20 percent of residential mortgage net charge-offs during 2009. While approximately 32 percent of our residential mortgage portfolio carries risk mitigation protection, only a small portion of our CRA portfolio is covered by this protection.
We have sold and continue to sell mortgage and other loans, including mortgage loans, to third-party buyers and to FNMA and FHLMC under agreements that contain representations and warranties related to, among other things, the process for selecting the loans for inclusion in a sale and compliance with applicable criteria established by the buyer. Such agreements contain provisions under which we may be required to either repurchase the loans or indemnify or provide other recourse to the buyer or insurer if there is a breach of the representations and warranties that materially and adversely affects the interests of the buyer or pursuant to such other standard established by the terms of such agreements. We have experienced and continue to experience increasing repurchase and similar demands from, and disputes with buyers and insurers. We expect to contest such demands that we do not believe are valid. In the event that we are required to repurchase loans that have been the subject of repurchase demands or otherwise provide indemnification or other recourse, this could significantly increase our losses and thereby affect our future earnings. For further information regarding representations and warranties, see Note 8 – Securitizations to the Consolidated Financial Statements, and Item 1A., Risk Factors.
| Bank of America 2009 | 57 |
Home Equity
The home equity portfolio is comprised of home equity lines of credit, home equity loans and reverse mortgages. At December 31, 2009, approximately 87 percent of the home equity portfolio was included in Home Loans & Insurance , while the remainder of the portfolio was primarily in GWIM. Outstanding balances in the home equity portfolio decreased $3.4 billion at December 31, 2009 compared to December 31, 2008 due to charge-offs and management of credit lines in the legacy portfolio partially offset by the acquisition of Merrill Lynch. Of the loans in the home equity portfolio at December 31, 2009 and 2008, approximately $26.0 billion, or 18 percent, and $23.2 billion, or 15 percent, were in first lien positions (19 percent and 17 percent excluding the Countrywide purchased impaired home equity loan portfolio). For more information on the Countrywide purchased impaired home equity loan portfolio, see the Countrywide Purchased Impaired Loan Portfolio discussion beginning on page 59.
Home equity unused lines of credit totaled $92.7 billion at December 31, 2009 compared to $107.4 billion at December 31, 2008. This decrease was driven primarily by higher customer account net utilization and lower attrition as well as line management initiatives on deteriorating accounts with declining equity positions partially offset by the Merrill Lynch acquisition. The home equity line of credit utilization rate was 56 percent at December 31, 2009 compared to 52 percent at December 31, 2008.
Nonperforming home equity loans increased $1.2 billion compared to December 31, 2008 due to the weak housing market and economic conditions and in part to TDRs. For more information on TDRs, refer to the Nonperforming Consumer Loans and Foreclosed Properties Activity discussion on page 62 and Note 6 – Outstanding Loans and Leases to the Consolidated Financial Statements . At December 31, 2009, $721 million, or approximately 20 percent, of the nonperforming home equity loans were greater than 180 days past due and had been written down to their fair values. Net charge-offs increased $3.6 billion to $7.1 billion for 2009, or 4.56 percent (5.00 percent excluding the Countrywide purchased impaired loan portfolio) of total average home equity loans compared to 2.59 percent (2.73 percent excluding the Countrywide purchased impaired loan portfolio) in 2008. These increases were driven by continued weakness in the housing markets and the economy.
There are certain risk characteristics of the home equity portfolio, excluding the Countrywide purchased impaired loan portfolio, which have contributed to higher losses. These characteristics include loans with high refreshed CLTVs, loans originated at the peak of home prices in 2006 and 2007 and loans in geographic areas that have experienced the most significant declines in home prices. Home price declines coupled with the fact that most home equity loans are secured by second lien
positions have significantly reduced and, in some cases, eliminated all collateral value after consideration of the first lien position. Although the disclosures below address each of these risk characteristics separately, there is significant overlap in loans with these characteristics, which has contributed to a disproportionate share of losses in the portfolio. Excluding the Countrywide purchased impaired portfolio, home equity loans with all of these higher risk characteristics comprised 11 percent of the total home equity portfolio at December 31, 2009, but have accounted for 38 percent of the home equity net charge-offs for 2009.
Home equity loans with greater than 90 percent but less than 100 percent refreshed CLTVs comprised 12 percent of the home equity portfolio while loans with refreshed CLTVs greater than 100 percent comprised 31 percent of the home equity portfolio at December 31, 2009. Net charge-offs on loans with a refreshed CLTV greater than 100 percent represented 82 percent of net charge-offs for 2009. Of those loans with a refreshed CLTV greater than 100 percent, 95 percent were performing at December 31, 2009. Home equity loans and lines of credit with a refreshed CLTV greater than 100 percent reflect loans where the balance and available line of credit of the combined loans are equal to or greater than the most recent valuation of the property securing the loan. The majority of these high refreshed CLTV ratios are due to the weakened economy and home price declines. In addition, loans with a refreshed FICO score below 620 represented 13 percent of the home equity loans at December 31, 2009. Of the total home equity portfolio, 68 percent at December 31, 2009 were interest-only loans.
The 2006 and 2007 vintage loans, which represent 49 percent of our home equity portfolio, continued to season and have higher refreshed CLTVs and accounted for 62 percent of nonperforming home equity loans at December 31, 2009 and approximately 72 percent of net charge-offs for 2009. Additionally, legacy Bank of America discontinued the program of purchasing non-franchise originated home equity loans in the second quarter of 2007. These purchased loans represented only two percent of the home equity portfolio but accounted for 10 percent of home equity net charge-offs for 2009.
The table below presents outstandings, nonperforming loans and net charge-offs by certain state concentrations for the home equity portfolio. California and Florida combined represented 41 percent of the total home equity portfolio and 50 percent of nonperforming home equity loans at December 31, 2009, but accounted for 60 percent of the home equity net charge-offs for 2009. In the New York area, the New York-Northern New Jersey-Long Island MSA made up 11 percent of outstanding home equity loans at December 31, 2009 but comprised only six percent of net charge-offs for 2009. The Los Angeles-Long Beach-Santa Ana MSA within California made up 11 percent of outstanding home equity loans at December 31, 2009 and 13 percent of net charge-offs for 2009.
Table 20 Home Equity State Concentrations
| December 31 | Year Ended December 31 | |||||||||||||||||||||
| Outstandings | Nonperforming | Net Charge-offs | ||||||||||||||||||||
| (Dollars in millions) | 2009 | 2008 | 2009 | 2008 | 2009 | 2008 | ||||||||||||||||
California | $ | 38,573 | $ | 38,015 | $ | 1,178 | $ | 857 | $ | 2,669 | $ | 1,464 | ||||||||||
Florida | 16,735 | 17,893 | 731 | 597 | 1,583 | 788 | ||||||||||||||||
New York | 8,752 | 8,602 | 274 | 176 | 262 | 96 | ||||||||||||||||
New Jersey | 8,732 | 8,929 | 192 | 126 | 225 | 96 | ||||||||||||||||
Massachusetts | 6,155 | 6,008 | 90 | 48 | 93 | 56 | ||||||||||||||||
Other U.S./Foreign | 56,965 | 58,937 | 1,339 | 833 | 2,218 | 996 | ||||||||||||||||
Total home equity loans (excluding the Countrywide purchased | $ | 135,912 | $ | 138,384 | $ | 3,804 | $ | 2,637 | $ | 7,050 | $ | 3,496 | ||||||||||
Total Countrywide purchased impaired home equity portfolio (1) | 13,214 | 14,099 | ||||||||||||||||||||
Total home equity portfolio | $ | 149,126 | $ | 152,483 | ||||||||||||||||||
| (1) | Represents acquired loans from Countrywide that were considered impaired and written down to fair value at the acquisition date. See page 59 for the discussion of the characteristics of the purchased impaired loans. |
| 58 | Bank of America 2009 |
Discontinued Real Estate
The discontinued real estate portfolio, totaling $14.9 billion at December 31, 2009, consisted of pay option and subprime loans obtained in the Countrywide acquisition. Upon acquisition, the majority of the discontinued real estate portfolio was considered impaired and written down to fair value. At December 31, 2009, the Countrywide purchased impaired loan portfolio comprised $13.3 billion, or 89 percent, of the $14.9 billion discontinued real estate portfolio. This portfolio is included in All Other and is managed as part of our overall ALM activities. See the Countrywide Purchased Impaired Loan Portfolio discussion below for more information on the discontinued real estate portfolio.
At December 31, 2009, the purchased non-impaired discontinued real estate portfolio was $1.6 billion. Loans with greater than 90 percent refreshed LTVs and CLTVs comprised 25 percent of this portfolio and those with refreshed FICO scores below 620 represented 39 percent of the portfolio. California represented 37 percent of the portfolio and 30 percent of the nonperforming loans while Florida represented nine percent of the portfolio and 16 percent of the nonperforming loans at December 31, 2009. The Los Angeles-Long Beach-Santa Ana MSA within California made up 15 percent of outstanding discontinued real estate loans at December 31, 2009.
Countrywide Purchased Impaired Loan Portfolio
Loans acquired with evidence of credit quality deterioration since origination and for which it is probable at purchase that we will be unable to collect all contractually required payments are accounted for under the accounting guidance for purchased impaired loans, which addresses accounting for differences between contractual and expected cash flows to be collected from the Corporation's initial investment in loans if those differences are attributable, at least in part, to credit quality. Evidence of credit quality deterioration as of the acquisition date may include statistics such as past due status, refreshed FICO scores and refreshed LTVs. Purchased impaired loans are recorded at fair value and the applicable accounting guidance prohibits carrying over or creation of valuation allowances in the initial accounting. The Merrill Lynch purchased impaired consumer loan portfolio did not materially alter the reported credit quality statistics of the consumer portfolios. As such, the Merrill Lynch consumer purchased impaired loans are excluded from the following discussion and credit statistics.
Certain acquired loans of Countrywide that were considered impaired were written down to fair value at the acquisition date. As of December 31, 2009, the carrying value was $37.5 billion and the unpaid principal balance of these loans was $47.7 billion. Based on the unpaid
principal balance, $30.6 billion have experienced no charge-offs and of these loans 82 percent, or $25.1 billion are current based on their contractual terms. Of the $5.5 billion that are not current, approximately 51 percent, or $2.8 billion are in early stage delinquency. During 2009, had the acquired portfolios not been accounted for as impaired, we would have recorded additional net charge-offs of $7.4 billion. During 2009, the Countrywide purchased impaired loan portfolio experienced further credit deterioration due to weakness in the housing markets and the impacts of a weak economy. As such, in 2009, we recorded $3.3 billion of provision for credit losses which was comprised of $3.0 billion for home equity loans and $316 million for discontinued real estate loans compared to $750 million in 2008. In addition, we wrote down Countrywide purchased impaired loans by $179 million during 2009 as losses on certain pools of impaired loans exceeded the original purchase accounting adjustment. The remaining purchase accounting credit adjustment of $487 million and the allowance of $3.9 billion results in a total credit adjustment of $4.4 billion remaining on all pools of Countrywide purchased impaired loans at December 31, 2009. For further information on the purchased impaired loan portfolio, see Note 6 – Outstanding Loans and Leases to the Consolidated Financial Statements.
The following discussion provides additional information on the Countrywide purchased impaired residential mortgage, home equity and discontinued real estate loan portfolios. Since these loans were written down to fair value upon acquisition, we are reporting this information separately. In certain cases, we supplement the reported statistics on these portfolios with information that is presented as if the acquired loans had not been accounted for as impaired upon acquisition.
Residential Mortgage
The Countrywide purchased impaired residential mortgage portfolio outstandings were $11.1 billion at December 31, 2009 and comprised 30 percent of the total Countrywide purchased impaired loan portfolio. Those loans with a refreshed FICO score below 620 represented 33 percent of the Countrywide purchased impaired residential mortgage portfolio at December 31, 2009. Refreshed LTVs greater than 90 percent after consideration of purchase accounting adjustments and refreshed LTVs greater than 90 percent based on the unpaid principal balance represented 65 percent and 80 percent of the purchased impaired residential mortgage portfolio. The table below presents outstandings net of purchase accounting adjustments and net charge-offs had the portfolio not been accounted for as impaired upon acquisition by certain state concentrations.
Table 21 Countrywide Purchased Impaired Loan Portfolio – Residential Mortgage State Concentrations
| Outstandings (1) | Purchased Impaired Portfolio Net Charge-offs (1, 2) | |||||||||||||
| December 31 | Year Ended December 31 | |||||||||||||
| (Dollars in millions) | 2009 | 2008 | 2009 | 2008 | ||||||||||
California | $ | 6,142 | $ | 5,633 | $ | 496 | $ | 177 | ||||||
Florida | 843 | 776 | 143 | 103 | ||||||||||
Virginia | 617 | 556 | 30 | 14 | ||||||||||
Maryland | 278 | 253 | 13 | 6 | ||||||||||
Texas | 166 | 148 | 5 | 5 | ||||||||||
Other U.S./Foreign | 3,031 | 2,647 | 237 | 133 | ||||||||||
Total Countrywide purchased impaired residential mortgage loan portfolio | $ | 11,077 | $ | 10,013 | $ | 924 | $ | 438 | ||||||
| (1) | Those loans that were originally classified as discontinued real estate loans upon acquisition and have been subsequently modified are now included in the residential mortgage outstandings shown above. Charge-offs on these loans prior to modification are excluded from the amounts shown above and shown as discontinued real estate charge-offs consistent with the product classification of the loan at the time of charge-off. |
| (2) | Represents additional net charge-offs had the portfolio not been accounted for as impaired upon acquisition. |
| Bank of America 2009 | 59 |
Home Equity
The Countrywide purchased impaired home equity outstandings were $13.2 billion at December 31, 2009 and comprised 35 percent of the total Countrywide purchased impaired loan portfolio. Those loans with a refreshed FICO score below 620 represented 21 percent of the Countrywide purchased impaired home equity portfolio at December 31, 2009. Refreshed CLTVs greater than 90 percent represented 90 percent of the
purchased impaired home equity portfolio after consideration of purchase accounting adjustments and 89 percent of the purchased impaired home equity portfolio based on the unpaid principal balance at December 31, 2009. The table below presents outstandings net of purchase accounting adjustments and net charge-offs had the portfolio not been accounted for as impaired upon acquisition, by certain state concentrations.
Table 22 Countrywide Purchased Impaired Portfolio – Home Equity State Concentrations
| Outstandings | Purchased Impaired Portfolio Net Charge-offs (1) | |||||||||||||
| December 31 | Year Ended December 31 | |||||||||||||
| (Dollars in millions) | 2009 | 2008 | 2009 | 2008 | ||||||||||
California | $ | 4,311 | $ | 5,110 | $ | 1,769 | $ | 744 | ||||||
Florida | 765 | 910 | 320 | 186 | ||||||||||
Virginia | 550 | 529 | 77 | 42 | ||||||||||
Arizona | 542 | 626 | 203 | 79 | ||||||||||
Colorado | 416 | 402 | 48 | 22 | ||||||||||
Other U.S./Foreign | 6,630 | 6,522 | 1,057 | 421 | ||||||||||
Total Countrywide purchased impaired home equity portfolio | $ | 13,214 | $ | 14,099 | $ | 3,474 | $ | 1,494 | ||||||
| (1) | Represents additional net charge-offs had the portfolio not been accounted for as impaired upon acquisition. |
Discontinued Real Estate
The Countrywide purchased impaired discontinued real estate outstandings were $13.3 billion at December 31, 2009 and comprised 35 percent of the total Countrywide purchased impaired loan portfolio. Those loans with a refreshed FICO score below 620 represented 51 percent of the Countrywide purchased impaired discontinued real estate portfolio at December 31, 2009. Refreshed LTVs and CLTVs greater than 90 percent represented 52 percent of the purchased impaired discontinued real
estate portfolio after consideration of purchase accounting adjustments. Refreshed LTVs and CLTVs greater than 90 percent based on the unpaid principal balance represented 80 percent of the purchased impaired discontinued real estate portfolio at December 31, 2009. The table below presents outstandings net of purchase accounting adjustments and net charge-offs had the portfolio not been accounted for as impaired upon acquisition, by certain state concentrations.
Table 23 Countrywide Purchased Impaired Loan Portfolio – Discontinued Real Estate State Concentrations
| Outstandings (1) | Purchased Impaired Portfolio Net Charge-offs (1, 2) | |||||||||||||
| December 31 | Year Ended December 31 | |||||||||||||
| (Dollars in millions) | 2009 | 2008 | 2009 | 2008 | ||||||||||
California | $ | 7,148 | $ | 9,987 | $ | 1,845 | $ | 1,010 | ||||||
Florida | 1,315 | 1,831 | 393 | 275 | ||||||||||
Arizona | 430 | 666 | 151 | 61 | ||||||||||
Washington | 421 | 492 | 30 | 8 | ||||||||||
Virginia | 399 | 580 | 76 | 48 | ||||||||||
Other U.S./Foreign | 3,537 | 4,541 | 517 | 297 | ||||||||||
Total Countrywide purchased impaired discontinued real estate loan portfolio | $ | 13,250 | $ | 18,097 | $ | 3,012 | $ | 1,699 | ||||||
| (1) | Those loans that were originally classified as discontinued real estate loans upon acquisition and have been subsequently modified are now excluded from amounts shown above. Charge-offs on these loans prior to modification are included in the amounts shown above consistent with the product classification of the loan at the time of charge-off. |
| (2) | Represents additional net charge-offs had the portfolio not been accounted for as impaired upon acquisition. |
Pay option ARMs have interest rates that adjust monthly and minimum required payments that adjust annually (subject to resetting of the loan if minimum payments are made and deferred interest limits are reached). Annual payment adjustments are subject to a 7.5 percent maximum change. To ensure that contractual loan payments are adequate to repay a loan, the fully amortizing loan payment amount is re-established after the initial five or 10-year period and again every five years thereafter. These payment adjustments are not subject to the 7.5 percent limit and may be substantial due to changes in interest rates and the addition of unpaid interest to the loan balance. Payment advantage ARMs have interest rates that are fixed for an initial period of five years. Payments are subject to reset if the minimum payments are made and deferred interest limits are reached. If interest deferrals cause the loan's principal balance
to reach a certain level within the first 10 years of the loans, the payment is reset to the interest-only payment; then at the 10-year point, the fully amortizing payment is required.
The difference between the frequency of changes in the loans' interest rates and payments along with a limitation on changes in the minimum monthly payments to 7.5 percent per year can result in payments that are not sufficient to pay all of the monthly interest charges (i.e., negative amortization). Unpaid interest charges are added to the loan balance until the loan balance increases to a specified limit, which is no more than 115 percent of the original loan amount, at which time a new monthly payment amount adequate to repay the loan over its remaining contractual life is established.
| 60 | Bank of America 2009 |
At December 31, 2009, the unpaid principal balance of pay option loans was $17.0 billion, with a carrying amount of $13.4 billion, including $12.5 billion of loans that were impaired upon acquisition. The total unpaid principal balance of pay option loans with accumulated negative amortization was $15.2 billion and accumulated negative amortization from the original loan balance was $1.0 billion. The percentage of borrowers electing to make only the minimum payment on option ARMs was 65 percent at December 31, 2009. We continue to evaluate our exposure to payment resets on the acquired negatively amortizing loans and have taken into consideration several assumptions regarding this evaluation (e.g., prepayment rates). We also continue to evaluate the potential for resets on the Countrywide purchased impaired pay option portfolio. Based on our expectations, 21 percent, eight percent and two percent of the pay option loan portfolio is expected to reset in 2010, 2011, and 2012, respectively. Approximately three percent are expected to reset thereafter, and approximately 66 percent are expected to repay prior to being reset.
We manage these purchased impaired portfolios, including consideration for the home retention programs to modify troubled mortgages, consistent with our other consumer real estate practices.
Credit Card – Domestic
The consumer domestic credit card portfolio is managed in Global Card Services . Outstandings in the held domestic credit card loan portfolio decreased $14.7 billion at December 31, 2009 compared to December 31, 2008 due to lower originations and transactional volume, the conversion of certain credit card loans into held-to-maturity debt securities and charge-offs partially offset by lower payment rates and new
draws on previously securitized accounts. For more information on this conversion, see Note 8 – Securitiza tions to the Consolidated Financial Statements. Net charge-offs increased $2.4 billion in 2009 to $6.5 billion reflecting the weak economy including elevated unemployment underemployment and higher bankruptcies. However, held domestic loans 30 days or more past due and still accruing interest decreased $668 million from December 31, 2008 driven by improvement in the last three quarters of 2009. Due to the decline in outstandings, the percentage of balances 30 days or more past due and still accruing interest increased to 7.90 percent from 7.13 percent at December 31, 2008.
Managed domestic credit card outstandings decreased $24.5 billion to $129.6 billion at December 31, 2009 compared to December 31, 2008 due to lower originations and transactional volume and credit losses partially offset by lower payment rates. The $6.9 billion increase in managed net losses to $17.0 billion was driven by the same factors as described in the held discussion above. Managed loans that were 30 days or more past due and still accruing interest decreased $856 million to $9.9 billion compared to $10.7 billion at December 31, 2008. Similar to the held discussion above, the percentage of balances 30 days or more past due and still accruing interest increased to 7.61 percent from 6.96 percent at December 31, 2008 due to the decline in outstandings.
Managed consumer credit card unused lines of credit for domestic credit card totaled $438.5 billion at December 31, 2009 compared to $713.0 billion at December 31, 2008. The $274.5 billion decrease was driven primarily by account management initiatives on higher risk customers in higher risk states and inactive accounts.
The table below presents asset quality indicators by certain state concentrations for the managed credit card – domestic portfolio.
Table 24 Credit Card – Domestic State Concentrations – Managed Basis
| December 31 | Year Ended December 31 | |||||||||||||||||||||
| Outstandings | Accruing Past Due 90 Days or More | Net Losses | ||||||||||||||||||||
| (Dollars in millions) | 2009 | 2008 | 2009 | 2008 | 2009 | 2008 | ||||||||||||||||
California | $ | 20,048 | $ | 24,191 | $ | 1,097 | $ | 997 | $ | 3,558 | $ | 1,916 | ||||||||||
Florida | 10,858 | 13,210 | 676 | 642 | 2,178 | 1,223 | ||||||||||||||||
Texas | 8,653 | 10,262 | 345 | 293 | 960 | 634 | ||||||||||||||||
New York | 7,839 | 9,368 | 295 | 263 | 855 | 531 | ||||||||||||||||
New Jersey | 5,168 | 6,113 | 189 | 172 | 559 | 316 | ||||||||||||||||
Other U.S. | 77,076 | 91,007 | 2,806 | 2,666 | 8,852 | 5,434 | ||||||||||||||||
Total credit card – domestic loan portfolio | $ | 129,642 | $ | 154,151 | $ | 5,408 | $ | 5,033 | $ | 16,962 | $ | 10,054 | ||||||||||
Credit Card – Foreign
The consumer foreign credit card portfolio is managed in Global Card Services . Outstandings in the held foreign credit card loan portfolio increased $4.5 billion to $21.7 billion at December 31, 2009 compared to December 31, 2008 primarily due to the strengthening of certain foreign currencies, particularly the British pound against the U.S. dollar. Net charge-offs for the held foreign portfolio increased $688 million to $1.2 billion in 2009, or 6.30 percent of total average held credit card – foreign loans compared to 3.34 percent in 2008. The increase was driven primarily by weak economic conditions and higher unemployment also being experienced in Europe and Canada, including a higher level of bankruptcies/insolvencies.
Managed foreign credit card outstandings increased $3.1 billion to $31.2 billion at December 31, 2009 compared to December 31, 2008 primarily due to the strengthening of certain foreign currencies, partic -
ularly the British pound against the U.S. dollar. Managed consumer foreign loans that were accruing past due 90 days or more increased to $799 million, or 2.56 percent, compared to $717 million, or 2.55 percent, at December 31, 2008. The dollar increase was primarily due to the strengthening of foreign currencies, especially the British pound against the U.S. dollar, further exacerbated by continuing weakness in the European and Canadian economies. Net losses for the managed foreign portfolio increased $895 million to $2.2 billion for 2009, or 7.43 percent of total average managed credit card – foreign loans compared to 4.17 percent in 2008. The increase in managed net losses was driven by the same factors as described in the held discussion above.
Managed consumer credit card unused lines of credit for foreign credit card totaled $69.0 billion at December 31, 2009 compared to $80.6 billion at December 31, 2008. The $11.6 billion decrease was driven primarily by account management initiatives mainly on inactive accounts.
| Bank of America 2009 | 61 |
Direct/Indirect Consumer
At December 31, 2009, approximately 45 percent of the direct/indirect portfolio was included in Global Banking (dealer financial services – automotive, marine and recreational vehicle loans), 22 percent was included in Global Card Services (consumer personal loans and other non-real estate secured), 24 percent in GWIM (principally other non-real estate secured and unsecured personal loans and securities-based lending margin loans) and the remainder in Deposits (student loans).
Outstanding loans and leases increased $13.8 billion to $97.2 billion at December 31, 2009 compared to December 31, 2008 primarily due to the acquisition of Merrill Lynch which included both domestic and foreign securities-based lending margin loans, partially offset by lower outstandings in the Global Card Services consumer lending portfolio. Net charge-offs increased $2.3 billion to $5.5 billion for 2009, or 5.46 per -
cent of total average direct/indirect loans compared to 3.77 percent for 2008. The dollar increase was concentrated in the Global Card Services consumer lending portfolio, driven by the effects of a weak economy including higher bankruptcies. Net charge-off ratios in the consumer lending portfolio have also been impacted by a significant slowdown in new loan production due, in part, to a tightening of underwriting criteria. Net charge-off ratios in the consumer lending portfolio were 17.75 percent during 2009, compared to 7.98 percent during 2008. The weak economy resulted in higher charge-offs in the dealer financial services portfolio. Loans that were past due 30 days or more and still accruing interest declined compared to December 31, 2008 driven by the consumer lending portfolio.
The table below presents asset quality indicators by certain state concentrations for the direct/indirect consumer loan portfolio.
Table 25 Direct/Indirect State Concentrations
| December 31 | Year Ended December 31 | |||||||||||||||||||||
| Outstandings | Accruing Past Due 90 Days or More | Net Charge-offs | ||||||||||||||||||||
| (Dollars in millions) | 2009 | 2008 | 2009 | 2008 | 2009 | 2008 | ||||||||||||||||
California | $ | 11,664 | $ | 10,555 | $ | 228 | $ | 247 | $ | 1,055 | $ | 601 | ||||||||||
Texas | 8,743 | 7,738 | 105 | 88 | 382 | 222 | ||||||||||||||||
Florida | 7,559 | 7,376 | 130 | 145 | 597 | 334 | ||||||||||||||||
New York | 5,111 | 4,938 | 73 | 69 | 272 | 162 | ||||||||||||||||
Georgia | 3,165 | 3,212 | 52 | 48 | 205 | 115 | ||||||||||||||||
Other U.S./Foreign | 60,994 | 49,617 | 900 | 773 | 2,952 | 1,680 | ||||||||||||||||
Total direct/indirect loans | $ | 97,236 | $ | 83,436 | $ | 1,488 | $ | 1,370 | $ | 5,463 | $ | 3,114 | ||||||||||
Other Consumer
At December 31, 2009, approximately 73 percent of the other consumer portfolio was associated with portfolios from certain consumer finance businesses that we have previously exited and are included in All Other . The remainder consisted of the foreign consumer loan portfolio which is mostly included in Global Card Services and deposit overdrafts which are recorded in Deposits .
Nonperforming Consumer Loans and Foreclosed Properties Activity
Table 26 presents nonperforming consumer loans and foreclosed properties activity during 2009 and 2008. Nonperforming loans held for sale are excluded from nonperforming loans as they are recorded at either fair value or the lower of cost or fair value. Nonperforming loans do not include consumer credit card, consumer loans secured by personal property or unsecured consumer loans that are past due as these loans are generally charged off no later than the end of the month in which the account becomes 180 days past due. Real estate-secured past due loans repurchased pursuant to our servicing agreements with GNMA are not reported as nonperforming as repayments are insured by the FHA. Additionally, nonperforming loans do not include the Countrywide purchased impaired portfolio. For further information regarding nonperforming loans, see Note 1 – Summary of Significant Accounting Principles to the Consolidated Financial Statements. Total net additions to nonperforming loans in 2009 were $11.0 billion compared to $6.4 billion in 2008. The net additions to nonperforming loans in 2009 were driven primarily by the residential mortgage and home equity portfolios reflecting weak housing markets and economy, seasoning of vintages originated in periods of higher growth and performing loans that were accelerated into nonperforming loan status upon modification into a TDR. Nonperforming consumer real estate related TDRs as a percentage of total nonperforming consumer loans and foreclosed properties were 21 percent at
December 31, 2009 compared to five percent at December 31, 2008 due primarily to increased modification volume during the year.
The outstanding balance of a real estate secured loan that is in excess of the estimated property value, less costs to sell, is charged off no later than the end of the month in which the account becomes 180 days past due unless repayment of the loan is insured by the FHA. Property values are refreshed at least quarterly with additional charge-offs taken as needed. At December 31, 2009, $10.7 billion, or approximately 60 percent, of the nonperforming residential mortgage loans and foreclosed properties, comprised of $9.6 billion of nonperforming loans and $1.1 billion of foreclosed properties, were greater than 180 days past due and had been written down to their fair values and $790 million, or approximately 20 percent, of the nonperforming home equity loans and foreclosed properties, comprised of $721 million of nonperforming loans and $69 million of foreclosed properties, were greater than 180 days past due and had been written down to their fair values.
In 2009, approximately 16 percent and six percent of the net increase in nonperforming loans were from Countrywide purchased non-impaired loans and Merrill Lynch loans that deteriorated subsequent to acquisition. While we witnessed increased levels of nonperforming loans transferred to foreclosed properties due to the lifting of various foreclosure moratoriums during 2009, the net reductions to foreclosed properties of $78 million were driven by sales of foreclosed properties and write-downs.
Restructured Loans
As discussed above, nonperforming loans also include certain loans that have been modified in TDRs where economic concessions have been granted to borrowers who have experienced or are expected to experience financial difficulties. These concessions typically result from the Corporation's loss mitigation activities and could include reductions in the interest rate, payment extensions, forgiveness of principal, forbearance or other actions. Certain TDRs are classified as nonperforming at the time of
| 62 | Bank of America 2009 |
restructure and may only be returned to performing status after considering the borrower's sustained repayment performance for a reasonable period, generally six months. Nonperforming TDRs, excluding those loans modified in the purchased impaired portfolio, are included in Table 26.
The pace of modifications slowed during the second half of 2009 due to the MHA and other programs where the loan goes through a trial period prior to formal modification. For more information on our modification programs, see Regulatory Initiatives beginning on page 43.
At December 31, 2009, residential mortgage TDRs were $5.3 billion, an increase of $4.7 billion compared to December 31, 2008. Nonperforming TDRs increased $2.7 billion during 2009 to $2.9 billion. Nonperforming residential mortgage TDRs comprised approximately 17 percent and three percent of total residential mortgage nonperforming loans and foreclosed properties at December 31, 2009 and 2008. Residential mortgage TDRs that were performing in accordance with their modified terms and excluded from nonperforming loans in Table 26 were $2.3 billion, an increase of $2.0 billion compared to December 31, 2008.
At December 31, 2009, home equity TDRs were $2.3 billion, an increase of $2.0 billion compared to December 31, 2008. Nonperforming TDRs increased $1.4 billion during 2009 to $1.7 billion. Nonperforming home equity TDRs comprised 44 percent and 11 percent of total home
equity nonperforming loans and foreclosed properties at December 31, 2009 and 2008. Home equity TDRs that were performing in accordance with their modified terms and excluded from nonperforming loans in Table 26 were $639 million compared to $1 million at December 31, 2008.
Discontinued real estate TDRs totaled $78 million at December 31, 2009. This was an increase of $7 million from December 31, 2008. Of these loans, $43 million were nonperforming while the remaining $35 million were classified as performing at December 31, 2009.
We also work with customers that are experiencing financial difficulty by renegotiating consumer credit card and consumer lending loans, while ensuring that we remain within Federal Financial Institutions Examination Council (FFIEC) guidelines. These renegotiated loans are excluded from Table 26 as we do not classify consumer non-real estate unsecured loans as nonperforming. For further information regarding these restructured and renegotiated loans, see Note 6 – Outstanding Loans and Leases to the Consolidated Financial Statements.
Certain modifications of loans in the purchased impaired loan portfolio result in removal of the loan from the purchased impaired portfolio pool and subsequent classification as a TDR. These modified loans are excluded from Table 26. For more information on TDRs, renegotiated and modified loans, refer to Note 6 – Outstanding Loans and Leases to the Consolidated Financial Statements.
Table 26 Nonperforming Consumer Loans and Foreclosed Properties Activity (1)
| (Dollars in millions) | 2009 | 2008 | ||||||
Nonperforming loans | ||||||||
Balance, January 1 | $ | 9,888 | $ | 3,442 | ||||
Additions to nonperforming loans: | ||||||||
New nonaccrual loans and leases (2) | 28,011 | 13,421 | ||||||
Reductions in nonperforming loans: | ||||||||
Paydowns and payoffs | (1,459 | ) | (527 | ) | ||||
Returns to performing status (3) | (4,540 | ) | (1,844 | ) | ||||
Charge-offs (4) | (9,442 | ) | (3,729 | ) | ||||
Transfers to foreclosed properties | (1,618 | ) | (875 | ) | ||||
Transfers to loans held-for-sale | (1 | ) | – | |||||
Total net additions to nonperforming loans | 10,951 | 6,446 | ||||||
Total nonperforming loans, December 31 (5) | 20,839 | 9,888 | ||||||
Foreclosed properties | ||||||||
Balance, January 1 | 1,506 | 276 | ||||||
Additions to foreclosed properties: | ||||||||
New foreclosed properties (6, 7) | 1,976 | 2,530 | ||||||
Reductions in foreclosed properties: | ||||||||
Sales | (1,687 | ) | (1,077 | ) | ||||
Write-downs | (367 | ) | (223 | ) | ||||
Total net additions (reductions) to foreclosed properties | (78 | ) | 1,230 | |||||
Total foreclosed properties, December 31 | 1,428 | 1,506 | ||||||
Nonperforming consumer loans and foreclosed properties, December 31 | $ | 22,267 | $ | 11,394 | ||||
Nonperforming consumer loans as a percentage of outstanding consumer loans and leases | 3.61 | % | 1.68 | % | ||||
Nonperforming consumer loans and foreclosed properties as a percentage of outstanding consumer loans and foreclosed properties | 3.85 | 1.93 | ||||||
| (1) | Balances do not include nonperforming LHFS of $2.9 billion and $3.2 billion in 2009 and 2008. |
| (2) | 2009 includes $465 million of nonperforming loans acquired from Merrill Lynch. |
| (3) | Consumer loans may be restored to performing status when all principal and interest is current and full repayment of the remaining contractual principal and interest is expected, or when the loan otherwise becomes well-secured and is in the process of collection. Certain TDRs are classified as nonperforming at the time of restructure and may only be returned to performing status after considering the borrower's sustained repayment performance for a reasonable period, generally six months. |
| (4) | Our policy is not to classify consumer credit card and consumer loans not secured by real estate as nonperforming; therefore, the charge-offs on these loans have no impact on nonperforming activity. |
| (5) | Approximately half of the 2009 and 2008 nonperforming loans are greater than 180 days past due and have been charged off to approximately 68 percent and 71 percent of original cost. |
| (6) | Our policy is to record any losses in the value of foreclosed properties as a reduction in the allowance for credit losses during the first 90 days after transfer of a loan into foreclosed properties. Thereafter, all losses in value are recorded as noninterest expense. New foreclosed properties in the table above are net of $818 million and $436 million of charge-offs in 2009 and 2008 taken during the first 90 days after transfer. |
| (7) | 2009 includes $21 million of foreclosed properties acquired from Merrill Lynch. 2008 includes $952 million of foreclosed properties acquired from Countrywide. |
| Bank of America 2009 | 63 |
Commercial Portfolio Credit Risk Management
Credit risk management for the commercial portfolio begins with an assessment of the credit risk profile of the borrower or counterparty based on an analysis of its financial position. As part of the overall credit risk assessment, our commercial credit exposures are assigned a risk rating and are subject to approval based on defined credit approval standards. Subsequent to loan origination, risk ratings are monitored on an ongoing basis, and if necessary, adjusted to reflect changes in the financial condition, cash flow, risk profile or outlook of a borrower or counterparty. In making credit decisions, we consider risk rating, collateral, country, industry and single name concentration limits while also balancing the total borrower or counterparty relationship. Our lines of business and risk management personnel use a variety of tools to continuously monitor the ability of a borrower or counterparty to perform under its obligations. We use risk rating aggregations to measure and evaluate concentrations within portfolios. In addition, risk ratings are a factor in determining the level of assigned economic capital and the allowance for credit losses.
For information on our accounting policies regarding delinquencies, nonperforming status and charge-offs for the commercial portfolio, see Note 1 – Summary of Significant Accounting Principles to the Consolidated Financial Statements.
Management of Commercial Credit Risk Concentrations
Commercial credit risk is evaluated and managed with a goal that concentrations of credit exposure do not result in undesirable levels of risk. We review, measure and manage concentrations of credit exposure by industry, product, geography and customer relationship. Distribution of loans and leases by loan size is an additional measure of portfolio risk diversification. We also review, measure and manage commercial real estate loans by geographic location and property type. In addition, within our international portfolio, we evaluate borrowings by region and by country. Tables 31, 34, 38, 39 and 40 summarize our concentrations. Additionally, we utilize syndication of exposure to third parties, loan sales, hedging and other risk mitigation techniques to manage the size and risk profile of the loan portfolio.
As part of our ongoing risk mitigation initiatives, we attempt to work with clients to modify their loans to terms that better align with their current ability to pay. In situations where an economic concession has been granted to a borrower experiencing financial difficulty, we identify these loans as TDRs.
We account for certain large corporate loans and loan commitments (including issued but unfunded letters of credit which are considered utilized for credit risk management purposes) that exceed our single name credit risk concentration guidelines under the fair value option. Lending commitments, both funded and unfunded, are actively managed and
monitored, and as appropriate, credit risk for these lending relationships may be mitigated through the use of credit derivatives, with the Corporation's credit view and market perspectives determining the size and timing of the hedging activity. In addition, credit protection is purchased to cover the funded portion as well as the unfunded portion of certain other credit exposures. To lessen the cost of obtaining our desired credit protection levels, credit exposure may be added within an industry, borrower or counterparty group by selling protection. These credit derivatives do not meet the requirements for treatment as accounting hedges. They are carried at fair value with changes in fair value recorded in other income.
Commercial Credit Portfolio
During 2009, continued housing value declines and economic stress impacted our commercial portfolios which experienced higher levels of losses. Broad-based economic pressures, including further reductions in spending by consumers and businesses, have also impacted commercial credit quality indicators. Loan balances continued to decline in 2009 as businesses aggressively managed their working capital and production capacity by maintaining low inventories, deferring capital spending and rationalizing staff and physical locations. Additionally, borrowers increasingly accessed the capital markets for financing while reducing their use of bank credit facilities. Risk mitigation strategies further contributed to the decline in loan balances.
Increases in nonperforming loans were largely driven by continued deterioration in the commercial real estate and commercial – domestic portfolios. Nonperforming loans and utilized reservable criticized exposures increased from 2008 levels; however, during the second half of 2009 the pace of increase slowed for nonperforming loans while reservable criticized exposure declined in the fourth quarter.
The loans and leases net charge-off ratios increased across all commercial portfolios. The increase in commercial real estate net charge-offs during 2009 compared to 2008 was driven by both the non-homebuilder and homebuilder portfolios, although homebuilder portfolio net charge-offs declined in the second half of 2009 compared to the first half of 2009. The increases in commercial – domestic and commercial – foreign net charge-offs were diverse in terms of borrowers and industries.
The acquisition of Merrill Lynch increased our concentrations to certain industries and countries. For more detail on the Merrill Lynch impact, see the Industry Concentrations discussion beginning on page 70 and the Foreign Portfolio discussion beginning on page 74. There were also increased concentrations within both investment and non-investment grade exposures including monolines, and certain leveraged finance and CMBS positions.
| 64 | Bank of America 2009 |
Table 27 presents our commercial loans and leases, and related credit quality information at December 31, 2009 and 2008. Loans that were acquired from Merrill Lynch that were considered impaired were written down to fair value upon acquisition. In addition to being included in the "Outstandings" column below, these loans are also shown separately, net of purchase accounting adjustments, for increased transparency, in the "Merrill Lynch Purchased Impaired Loan Portfolio" column. Nonperforming loans and accruing balances 90 days or more past due do not include Merrill Lynch purchased impaired loans even though the customer may be contractually past due. The portion of the Merrill Lynch port -
folio that was not impaired at acquisition was recorded at fair value in accordance with fair value accounting. This adjustment to fair value incorporates the interest rate, creditworthiness of the borrower and market liquidity compared to the contractual terms of the non-impaired loans at the date of acquisition. For more information, see Note 2 – Merger and Restructuring Activity and Note 6 – Outstanding Loans and Leases to the Consolidated Financial Statements. The acquisition of Countrywide and related purchased impaired loan portfolio did not impact the commercial portfolios.
Table 27 Commercial Loans and Leases
| December 31 | |||||||||||||||||||||||||||
| Outstandings | Nonperforming (1) | Accruing Past Due 90 Days or More (2) | Merrill Lynch Purchased Impaired Loan Portfolio | ||||||||||||||||||||||||
| (Dollars in millions) | 2009 | 2008 | 2009 | 2008 | 2009 | 2008 | 2009 | ||||||||||||||||||||
Commercial loans and leases | |||||||||||||||||||||||||||
Commercial – domestic (3) | $ | 181,377 | $ | 200,088 | $ | 4,925 | $ | 2,040 | $ | 213 | $ | 381 | $ | 100 | |||||||||||||
Commercial real estate (4) | 69,447 | 64,701 | 7,286 | 3,906 | 80 | 52 | 305 | ||||||||||||||||||||
Commercial lease financing | 22,199 | 22,400 | 115 | 56 | 32 | 23 | – | ||||||||||||||||||||
Commercial – foreign | 27,079 | 31,020 | 177 | 290 | 67 | 7 | 361 | ||||||||||||||||||||
| 300,102 | 318,209 | 12,503 | 6,292 | 392 | 463 | 766 | |||||||||||||||||||||
Small business commercial – domestic (5) | 17,526 | 19,145 | 200 | 205 | 624 | 640 | – | ||||||||||||||||||||
Total commercial loans excluding loans measured at fair value | 317,628 | 337,354 | 12,703 | 6,497 | 1,016 | 1,103 | 766 | ||||||||||||||||||||
Total measured at fair value (6) | 4,936 | 5,413 | 15 | – | 87 | – | – | ||||||||||||||||||||
Total commercial loans and leases | $ | 322,564 | $ | 342,767 | $ | 12,718 | $ | 6,497 | $ | 1,103 | $ | 1,103 | $ | 766 | |||||||||||||
| (1) | Nonperforming commercial loans and leases as a percentage of outstanding commercial loans and leases excluding loans measured at fair value were 4.00 percent (4.01 percent excluding the purchased impaired loan portfolio) and 1.93 percent at December 31, 2009 and 2008. |
| (2 ) | Accruing commercial loans and leases past due 90 days or more as a percentage of outstanding commercial loans and leases excluding loans measured at fair value were 0.32 percent and 0.33 percent at December 31, 2009 and 2008. The December 31, 2009 ratio remained unchanged excluding the purchased impaired loan portfolio. |
| (3) | Excludes small business commercial – domestic loans. |
| (4) | Includes domestic commercial real estate loans of $66.5 billion and $63.7 billion, and foreign commercial real estate loans of $3.0 billion and $979 million at December 31, 2009 and 2008. |
| (5) | Small business commercial – domestic including card related products. |
| (6) | Certain commercial loans are accounted for under the fair value option and include commercial – domestic loans of $3.0 billion and $3.5 billion, commercial – foreign loans of $1.9 billion and $1.7 billion and commercial real estate loans of $90 million and $203 million at December 31, 2009 and 2008. See Note 20 – Fair Value Measurements to the Consolidated Financial Statements for additional discussion of fair value for certain financial instruments. |
Table 28 presents net charge-offs and related ratios for our commercial loans and leases for 2009 and 2008. The reported net charge-off ratios for commercial – domestic, commercial real estate and commercial – foreign were impacted by the addition of the Merrill Lynch purchased
impaired loan portfolio as the initial fair value adjustments recorded on those loans upon acquisition would have already included the estimated credit losses.
Table 28 Commercial Net Charge-offs and Related Ratios
| Net Charge-offs | Net Charge-off Ratios (1, 2, 3) | |||||||||||||
| (Dollars in millions) | 2009 | 2008 | 2009 | 2008 | ||||||||||
Commercial loans and leases | ||||||||||||||
Commercial – domestic (4) | $ | 2,190 | $ | 519 | 1.09 | % | 0.26 | % | ||||||
Commercial real estate | 2,702 | 887 | 3.69 | 1.41 | ||||||||||
Commercial lease financing | 195 | 60 | 0.89 | 0.27 | ||||||||||
Commercial – foreign | 537 | 173 | 1.76 | 0.55 | ||||||||||
| 5,624 | 1,639 | 1.72 | 0.52 | |||||||||||
Small business commercial – domestic | 2,886 | 1,930 | 15.68 | 9.80 | ||||||||||
Total commercial | $ | 8,510 | $ | 3,569 | 2.47 | 1.07 | ||||||||
| (1) | Net charge-off ratios are calculated as net charge-offs divided by average outstanding loans and leases excluding loans accounted for under the fair value option. |
| (2) | Net charge-off ratios excluding the Merrill Lynch purchased impaired loan portfolio were 1.06 percent for commercial – domestic, 3.60 percent for commercial real estate, 1.49 percent for commercial – foreign, and 2.41 percent for the total commercial portfolio in 2009. These are the only product classifications impacted by the Merrill Lynch purchased impaired loan portfolio in 2009. |
| (3) | Although the Merrill Lynch purchased impaired portfolio was recorded at fair value at acquisition on January 1, 2009, actual credit losses have exceeded the initial purchase accounting estimates. Included above are net charge-offs related to the Merrill Lynch purchased impaired portfolio in 2009 of $55 million for commercial – domestic, $88 million for commercial real estate and $90 million for commercial – foreign. |
| (4) | Excludes small business commercial – domestic. |
| Bank of America 2009 | 65 |
Table 29 presents commercial credit exposure by type for utilized, unfunded and total binding committed credit exposure. Commercial utilized credit exposure includes funded loans, standby letters of credit, financial guarantees, bankers' acceptances and commercial letters of credit for which the bank is legally bound to advance funds under prescribed conditions, during a specified period. Although funds have not been advanced, these exposure types are considered utilized for credit risk management purposes. Total commercial committed credit exposure decreased by $10.1 billion, or one percent, at December 31, 2009 compared to December 31, 2008. The decrease was largely driven by reductions in loans and leases partially offset by an increase in derivatives due to the acquisition of Merrill Lynch.
Total commercial utilized credit exposure decreased to $494.4 billion at December 31, 2009 compared to $498.7 billion at December 31,
2008. Funded loans and leases declined due to limited demand for acquisition financing and capital expenditures in the large corporate and middle-market portfolios and as clients utilized the improved capital markets more extensively for their funding needs. With the economic outlook remaining uncertain, businesses are aggressively managing working capital and production capacity, maintaining low inventories and deferring capital spending. The increase in derivative assets was driven by the acquisition of Merrill Lynch substantially offset during 2009 by maturing transactions, mark-to-market adjustments from changing interest and foreign exchange rates, as well as narrower credit spreads.
The loans and leases funded utilization rate was 57 percent at December 31, 2009 compared to 58 percent at December 31, 2008.
Table 29 Commercial Credit Exposure by Type
| December 31 | ||||||||||||||||||||||
| Commercial Utilized (1, 2) | Commercial Unfunded (1, 3, 4) | Total Commercial Committed (1) | ||||||||||||||||||||
| (Dollars in millions) | 2009 | 2008 | 2009 | 2008 | 2009 | 2008 | ||||||||||||||||
Loans and leases | $ | 322,564 | $ | 342,767 | $ | 293,519 | $ | 300,856 | $ | 616,083 | $ | 643,623 | ||||||||||
Derivative assets (5) | 80,689 | 62,252 | – | – | 80,689 | 62,252 | ||||||||||||||||
Standby letters of credit and financial guarantees | 70,238 | 72,840 | 6,008 | 4,740 | 76,246 | 77,580 | ||||||||||||||||
Assets held-for-sale (6) | 13,473 | 14,206 | 781 | 183 | 14,254 | 14,389 | ||||||||||||||||
Bankers' acceptances | 3,658 | 3,382 | 16 | 13 | 3,674 | 3,395 | ||||||||||||||||
Commercial letters of credit | 2,958 | 2,974 | 569 | 791 | 3,527 | 3,765 | ||||||||||||||||
Foreclosed properties and other | 797 | 328 | – | – | 797 | 328 | ||||||||||||||||
Total commercial credit exposure | $ | 494,377 | $ | 498,749 | $ | 300,893 | $ | 306,583 | $ | 795,270 | $ | 805,332 | ||||||||||
| (1) | At December 31, 2009, total commercial utilized, total commercial unfunded and total commercial committed exposure include $88.5 billion, $25.7 billion and $114.2 billion, respectively, related to Merrill Lynch. |
| (2) | Total commercial utilized exposure at December 31, 2009 and 2008 includes loans and issued letters of credit accounted for under the fair value option and is comprised of loans outstanding of $4.9 billion and $5.4 billion, and letters of credit with a notional amount of $1.7 billion and $1.4 billion. |
| (3) | Total commercial unfunded exposure at December 31, 2009 and 2008 includes loan commitments accounted for under the fair value option with a notional amount of $25.3 billion and $15.5 billion. |
| (4) | Excludes unused business card lines which are not legally binding. |
| (5) | Derivative assets are carried at fair value, reflect the effects of legally enforceable master netting agreements, and have been reduced by cash collateral of $58.4 billion and $34.8 billion at December 31, 2009 and 2008. Not reflected in utilized and committed exposure is additional derivative collateral held of $16.2 billion and $13.4 billion which consists primarily of other marketable securities at December 31, 2009 and 2008. |
| (6) | Total commercial committed assets held-for-sale exposure consists of $9.0 billion and $12.1 billion of commercial LHFS exposure (e.g., commercial mortgage and leveraged finance) and $5.3 billion and $2.3 billion of assets held-for-sale exposure at December 31, 2009 and 2008. |
Table 30 presents commercial utilized reservable criticized exposure by product type. Criticized exposure corresponds to the Special Mention, Substandard and Doubtful asset categories defined by regulatory authorities. In addition to reservable loans and leases, excluding those accounted for under the fair value option, exposure includes SBLCs, financial guarantees, bankers' acceptances and commercial letters of credit for which we are legally bound to advance funds under prescribed conditions, during a specified period. Although funds have not been advanced, these exposure types are considered utilized for credit risk management purposes. Total commercial utilized reservable criticized
exposure rose by $21.7 billion primarily due to increases in commercial real estate and commercial – domestic. Commercial real estate increased $10.0 billion primarily due to the non-homebuilder portfolio which has been impacted by the weak economy partially offset by a decrease in the homebuilder portfolio. The $9.3 billion increase in commercial – domestic reflects deterioration across various lines of business and industries, primarily in Global Banking. At December 31, 2009, approximately 85 percent of the loans within criticized reservable utilized exposure are secured.
Table 30 Commercial Utilized Reservable Criticized Exposure
| December 31 | ||||||||||||||
| 2009 | 2008 | |||||||||||||
| (Dollars in millions) | Amount | Percent (1) | Amount | Percent (1) | ||||||||||
Commercial – domestic (2) | $ | 28,259 | 11.66 | % | $ | 18,963 | 7.20 | % | ||||||
Commercial real estate | 23,804 | 32.13 | 13,830 | 19.73 | ||||||||||
Commercial lease financing | 2,229 | 10.04 | 1,352 | 6.03 | ||||||||||
Commercial – foreign | 2,605 | 7.12 | 1,459 | 3.65 | ||||||||||
| 56,897 | 15.17 | 35,604 | 8.99 | |||||||||||
Small business commercial – domestic | 1,789 | 10.18 | 1,333 | 6.94 | ||||||||||
Total commercial utilized reservable criticized exposure | $ | 58,686 | 14.94 | $ | 36,937 | 8.90 | ||||||||
| (1) | Percentages are calculated as commercial utilized reservable criticized exposure divided by total commercial utilized reservable exposure for each exposure category. |
| (2) | Excludes small business commercial – domestic exposure. |
| 66 | Bank of America 2009 |
Commercial – Domestic (excluding Small Business)
At December 31, 2009, approximately 81 percent of the commercial – domestic loan portfolio, excluding small business, was included in Global Banking (business banking, middle-market and large multinational corporate loans and leases) and Global Markets (acquisition, bridge financing and institutional investor services). The remaining 19 percent was mostly in GWIM (business-purpose loans for wealthy individuals). Outstanding commercial – domestic loans, excluding loans accounted for under the fair value option, decreased driven primarily by reduced customer demand within Global Banking, partially offset by the acquisition of Merrill Lynch. Nonperforming commercial – domestic loans increased $2.9 billion compared to December 31, 2008. Net charge-offs increased $1.7 billion in 2009 compared to 2008. The increases in nonperforming loans and net charge-offs were broad-based in terms of borrowers and industries. The acquisition of Merrill Lynch accounts for a portion of the increase in nonperforming loans and reservable criticized exposure.
Commercial Real Estate
The commercial real estate portfolio is predominantly managed in Global Banking and consists of loans made primarily to public and private developers, homebuilders and commercial real estate firms. Outstanding loans and leases, excluding loans accounted for under the fair value option, increased $4.7 billion at December 31, 2009 compared to December 31, 2008, primarily due to the acquisition of Merrill Lynch partially offset by
portfolio attrition and losses. The portfolio remains diversified across property types and geographic regions. California and Florida represent the two largest state concentrations at 21 percent and seven percent for loans and leases at December 31, 2009. For more information on geographic or property concentrations, refer to Table 31.
For the year, nonperforming commercial real estate loans increased $3.4 billion and utilized reservable criticized exposure increased $10.0 billion from December 31, 2008 across most property types and was attributable to the continuing impact of the housing slowdown, elevated unemployment and deteriorating vacancy and rental rates across most non-homebuilder property types and geographies during 2009. The increase in nonperforming loans was driven by the retail, office, multi-use, and land and land development portfolios. The increase in utilized reservable criticized exposure was driven by the office, retail and multi-family rental property types, offset by a $1.9 billion decrease in the homebuilder portfolio. For 2009, net charge-offs were up $1.8 billion compared to 2008 driven by increases in net charge-offs in both the non-homebuilder and the homebuilder portfolios.
The following table presents outstanding commercial real estate loans by geographic region and property type. Commercial real estate primarily includes commercial loans and leases secured by non owner-occupied real estate which are dependent on the sale or lease of the real estate as the primary source of repayment.
Table 31 Outstanding Commercial Real Estate Loans
| December 31 | ||||||
| (Dollars in millions) | 2009 | 2008 | ||||
By Geographic Region (1) | ||||||
California | $ | 14,273 | $ | 11,270 | ||
Northeast | 11,661 | 9,747 | ||||
Southwest | 8,183 | 6,698 | ||||
Southeast | 6,830 | 7,365 | ||||
Midwest | 6,505 | 7,447 | ||||
Florida | 4,568 | 5,146 | ||||
Illinois | 4,375 | 5,451 | ||||
Midsouth | 3,332 | 3,475 | ||||
Northwest | 3,097 | 3,022 | ||||
Geographically diversified (2) | 3,238 | 2,563 | ||||
Non-U.S. | 2,994 | 979 | ||||
Other (3) | 481 | 1,741 | ||||
Total outstanding commercial real estate loans (4) | $ | 69,537 | $ | 64,904 | ||
By Property Type | ||||||
Office | $ | 12,511 | $ | 10,388 | ||
Multi-family rental | 11,169 | 8,177 | ||||
Shopping centers/retail | 9,519 | 9,293 | ||||
Homebuilder (5) | 7,250 | 10,987 | ||||
Hotels/motels | 6,946 | 2,513 | ||||
Multi-use | 5,924 | 3,444 | ||||
Industrial/warehouse | 5,852 | 6,070 | ||||
Land and land development | 3,215 | 3,856 | ||||
Other (6) | 7,151 | 10,176 | ||||
Total outstanding commercial real estate loans (4) | $ | 69,537 | $ | 64,904 | ||
| (1) | Distribution is based on geographic location of collateral. |
| (2) | The geographically diversified category is comprised primarily of unsecured outstandings to real estate investment trusts and national home builders whose portfolios of properties span multiple geographic regions. |
| (3) | Primarily includes properties in the states of Colorado, Utah, Hawaii, Wyoming and Montana. |
| (4) | Includes commercial real estate loans accounted for under the fair value option of $90 million and $203 million at December 31, 2009 and 2008. |
| (5) | Homebuilder includes condominiums and residential land. |
| (6) | Represents loans to borrowers whose primary business is commercial real estate, but the exposure is not secured by the listed property types or is unsecured. |
During 2009, deterioration within the commercial real estate portfolio shifted from the homebuilder portfolio to the non-homebuilder portfolio. Non-homebuilder credit quality indicators and appraised values weakened in 2009 due to deteriorating property fundamentals and increased loss severities, whereas homebuilder credit quality indicators, while remaining elevated, began to stabilize. The non-homebuilder portfolio remains most
at risk as occupancy and rental rates continued to deteriorate due to the current economic environment and restrained business hiring and capital investment. We have adopted a number of proactive risk mitigation initiatives to reduce utilized and potential exposure in the commercial real estate portfolios.
| Bank of America 2009 | 67 |
The following table presents commercial real estate credit quality data by non-homebuilder and homebuilder property types. Commercial real estate primarily includes commercial loans secured by non owner-occu -
pied real estate which is dependent on the sale or lease of the real estate as the primary source of repayment.
Table 32 Commercial Real Estate Credit Quality Data
| December 31 | Year Ended December 31 | |||||||||||||||||||||||||||||
| Nonperforming Loans and Foreclosed Properties (1) | Utilized Reservable Criticized Exposure (2) | Net Charge-offs | Net Charge-off Ratios (3) | |||||||||||||||||||||||||||
| (Dollars in millions) | 2009 | 2008 | 2009 | 2008 | 2009 | 2008 | 2009 | 2008 | ||||||||||||||||||||||
Commercial real estate – non-homebuilder | ||||||||||||||||||||||||||||||
Office | $ | 729 | $ | 95 | $ | 3,822 | $ | 801 | $ | 249 | $ | – | 2.01 | % | – | % | ||||||||||||||
Multi-family rental | 546 | 232 | 2,496 | 822 | 217 | 13 | 1.96 | 0.18 | ||||||||||||||||||||||
Shopping centers/retail | 1,157 | 204 | 3,469 | 1,442 | 239 | 10 | 2.30 | 0.11 | ||||||||||||||||||||||
Hotels/motels | 160 | 9 | 1,140 | 67 | 5 | 4 | 0.08 | 0.09 | ||||||||||||||||||||||
Industrial/warehouse | 442 | 91 | 1,757 | 464 | 82 | – | 1.34 | – | ||||||||||||||||||||||
Multi-use | 416 | 17 | 1,578 | 409 | 146 | 24 | 2.58 | 0.38 | ||||||||||||||||||||||
Land and land development | 968 | 455 | 1,657 | 1,281 | 286 | – | 8.00 | – | ||||||||||||||||||||||
Other (4) | 417 | 88 | 2,210 | 973 | 140 | 22 | 1.72 | 0.42 | ||||||||||||||||||||||
Total non-homebuilder | 4,835 | 1,191 | 18,129 | 6,259 | 1,364 | 73 | 2.13 | 0.15 | ||||||||||||||||||||||
Commercial real estate – homebuilder (5) | 3,228 | 3,036 | 5,675 | 7,571 | 1,338 | 814 | 14.41 | 6.25 | ||||||||||||||||||||||
Total commercial real estate | $ | 8,063 | $ | 4,227 | $ | 23,804 | $ | 13,830 | $ | 2,702 | $ | 887 | 3.69 | 1.41 | ||||||||||||||||
| (1) | Includes commercial foreclosed properties of $777 million and $321 million at December 31, 2009 and 2008. |
| (2) | Utilized reservable criticized exposure corresponds to the Special Mention, Substandard and Doubtful asset categories defined by regulatory authorities. This is defined as loans, excluding those accounted for under the fair value option, SBLCs and bankers' acceptances. |
| (3) | Net charge-off ratios are calculated as net charge-offs divided by average outstanding loans excluding loans accounted for under the fair value option during the year for each loan and lease category. |
| (4) | Represents loans to borrowers whose primary business is commercial real estate, but the exposure is not secured by the listed property types or is unsecured. |
| (5) | Homebuilder includes condominiums and residential land. |
At December 31, 2009, we had total committed non-homebuilder exposure of $84.4 billion compared to $84.1 billion at December 31, 2008. The increase was due to the Merrill Lynch acquisition, largely offset by repayments and net charge-offs. Non-homebuilder nonperforming loans and foreclosed properties were $4.8 billion, or 7.73 percent of total non-homebuilder loans and foreclosed properties at December 31, 2009 compared to $1.2 billion, or 2.21 percent at December 31, 2008, with the increase driven by deterioration in the shopping center/retail, office, and land and land development portfolios.
Non-homebuilder utilized reservable criticized exposure increased $11.9 billion to $18.1 billion, or 27.27 percent of total non-homebuilder utilized reservable exposure at December 31, 2009 compared to $6.3 billion, or 10.66 percent, at December 31, 2008. The increase was driven primarily by office, shopping center/retail and multi-family rental property types which have been the most adversely affected by high unemployment and the slowdown in consumer spending.
For the non-homebuilder portfolio, net charge-offs increased $1.3 billion for 2009 compared to 2008 with the increase concentrated in non-homebuilder land and land development, office, shopping center/retail and multi-family rental property types.
Within our total non-homebuilder exposure, at December 31, 2009, we had total committed non-homebuilder construction and land development exposure of $24.5 billion compared to $27.8 billion at December 31, 2008. Non-homebuilder construction and land development exposure is mostly secured and diversified across property types and geographies. Assets in the non-homebuilder construction and land development portfolio face significant challenges in the current rental market. Weak rental demand and cash flows and declining property valuations have resulted in increased levels of reservable criticized exposure and nonperforming loans and foreclosed properties. Nonperforming loans and foreclosed properties and utilized reservable criticized exposure for
the non-homebuilder construction and land development portfolio increased $2.0 billion and $6.1 billion from December 31, 2008 to $2.6 billion and $8.9 billion at December 31, 2009.
At December 31, 2009, we had committed homebuilder exposure of $10.4 billion compared to $16.2 billion at December 31, 2008 of which $7.3 billion and $11.0 billion were funded secured loans. The decline in homebuilder committed exposure was driven by repayments, charge-offs, reduced new home construction and continued risk mitigation initiatives. Homebuilder nonperforming loans and foreclosed properties stabilized due to the slowdown in the rate of home price declines. Homebuilder utilized reservable criticized exposure decreased by $1.9 billion driven by higher net charge-offs. The nonperforming loans, leases and foreclosed properties and the utilized reservable criticized ratios for the homebuilder portfolio were 42.16 percent and 74.44 percent at December 31, 2009 compared to 27.07 percent and 66.33 percent at December 31, 2008. Lower loan balances and exposures in 2009 drove a portion of the increase in the ratios. Net charge-offs for the homebuilder portfolio increased $524 million in 2009 from 2008.
Commercial – Foreign
The commercial – foreign loan portfolio is managed primarily in Global Banking . Outstanding loans, excluding loans accounted for under the fair value option, decreased due to repayments as borrowers accessed the capital markets to refinance bank debt and aggressively managed working capital and investment spending, partially offset by the acquisition of Merrill Lynch. Reduced merger and acquisition activity was also a factor contributing to modest new loan origination. Net charge-offs increased primarily due to deterioration in the portfolio, particularly in financial services, consumer dependent and housing-related sectors. For additional information on the commercial – foreign portfolio, refer to the Foreign Portfolio discussion beginning on page 74.
| 68 | Bank of America 2009 |
Small Business Commercial – Domestic
The small business commercial – domestic loan portfolio is comprised of business card and small business loans primarily managed in Global Card Services . In 2009, small business commercial – domestic net charge-offs increased $956 million from 2008. The portfolio deterioration was primarily driven by the impacts of a weakened economy. Approximately 77 percent of the small business commercial – domestic net charge-offs for 2009 were credit card related products, compared to 75 percent in 2008.
Commercial Loans Carried at Fair Value
The portfolio of commercial loans accounted for under the fair value option is managed in Global Markets . The $477 million decrease in the fair value loan portfolio in 2009 was driven primarily by reduced corporate borrowings under bank credit facilities. We recorded net gains of $515 million resulting from changes in the fair value of the loan portfolio during 2009 compared to net losses of $780 million for 2008. These gains and losses were primarily attributable to changes in instrument-specific credit risk and were predominantly offset by net gains or net losses from hedging activities.
In addition, unfunded lending commitments and letters of credit had an aggregate fair value of $950 million and $1.1 billion at December 31, 2009 and 2008 and were recorded in accrued expenses and other liabilities. The associated aggregate notional amount of unfunded lending commitments and letters of credit accounted for under the fair value
option was $27.0 billion and $16.9 billion at December 31, 2009 and 2008 with the increase driven by the acquisition of Merrill Lynch. Net gains resulting from changes in fair value of commitments and letters of credit of $1.4 billion were recorded during 2009 compared to net losses of $473 million for 2008. These gains and losses were primarily attributable to changes in instrument-specific credit risk.
Nonperforming Commercial Loans, Leases and Foreclosed Properties Activity
The following table presents the additions and reductions to nonperforming loans, leases and foreclosed properties in the commercial portfolio during 2009 and 2008. The $16.2 billion in new nonaccrual loans and leases for 2009 was primarily attributable to increases within non-homebuilder commercial real estate property types such as shopping centers/retail, office, land and land development, and multi-use and within commercial – domestic excluding small business, where the increases were broad-based across industries and lines of business. Approximately 90 percent of commercial nonperforming loans, leases and foreclosed properties are secured and approximately 35 percent are contractually current. In addition, commercial nonperforming loans are carried at approximately 75 percent of their unpaid principal balance before consideration of the allowance for loan and lease losses as the carrying value of these loans has been reduced to the estimated net realizable value.
Table 33 Nonperforming Commercial Loans, Leases and Foreclosed Properties Activity (1, 2)
| (Dollars in millions) | 2009 | 2008 | ||||||
Nonperforming loans and leases Balance, January 1 | $ | 6,497 | $ | 2,155 | ||||
Additions to nonperforming loans and leases: | ||||||||
Merrill Lynch balance, January 1, 2009 | 402 | – | ||||||
New nonaccrual loans and leases | 16,190 | 8,110 | ||||||
Advances | 339 | 154 | ||||||
Reductions in nonperforming loans and leases: | ||||||||
Paydowns and payoffs | (3,075 | ) | (1,467 | ) | ||||
Sales | (630 | ) | (45 | ) | ||||
Returns to performing status (3) | (461 | ) | (125 | ) | ||||
Charge-offs (4) | (5,626 | ) | (1,900 | ) | ||||
Transfers to foreclosed properties | (857 | ) | (372 | ) | ||||
Transfers to loans held-for-sale | (76 | ) | (13 | ) | ||||
Total net additions to nonperforming loans and leases | 6,206 | 4,342 | ||||||
Total nonperforming loans and leases, December 31 | 12,703 | 6,497 | ||||||
Foreclosed properties Balance, January 1 | 321 | 75 | ||||||
Additions to foreclosed properties: | ||||||||
New foreclosed properties | 857 | 372 | ||||||
Reductions in foreclosed properties: | ||||||||
Sales | (310 | ) | (110 | ) | ||||
Write-downs | (91 | ) | (16 | ) | ||||
Total net additions to foreclosed properties | 456 | 246 | ||||||
Total foreclosed properties, December 31 | 777 | 321 | ||||||
Nonperforming commercial loans, leases and foreclosed properties, December 31 | $ | 13,480 | $ | 6,818 | ||||
Nonperforming commercial loans and leases as a percentage of outstanding commercial loans and leases (5) | 4.00 | % | 1.93 | % | ||||
Nonperforming commercial loans, leases and foreclosed properties as a percentage of outstanding
commercial loans, | 4.24 | 2.02 | ||||||
| (1) | Balances do not include nonperforming LHFS of $4.5 billion and $852 million at December 31, 2009 and 2008. |
| (2) | Includes small business commercial – domestic activity. |
| (3) | Commercial loans and leases may be restored to performing status when all principal and interest is current and full repayment of the remaining contractual principal and interest is expected, or when the loan otherwise becomes well-secured and is in the process of collection. TDRs are generally classified as performing after a sustained period of demonstrated payment performance. |
| (4) | Business card loans are not classified as nonperforming; therefore, the charge-offs on these loans have no impact on nonperforming activity. |
| (5) | Outstanding commercial loans and leases exclude loans accounted for under the fair value option. |
| Bank of America 2009 | 69 |
At December 31, 2009, the total commercial TDR balance was $577 million. Nonperforming TDRs increased $442 million while performing TDRs increased $78 million during 2009. Nonperforming TDRs of $486 million are included in Table 33.
Industry Concentrations
Table 34 presents commercial committed and commercial utilized credit exposure by industry and the total net credit default protection purchased to cover the funded and the unfunded portion of certain credit exposure. Our commercial credit exposure is diversified across a broad range of industries.
Industry limits are used internally to manage industry concentrations and are based on committed exposure and capital usage that are allocated on an industry-by-industry basis. A risk management framework is in place to set and approve industry limits, as well as to provide ongoing monitoring. The Credit Risk Committee (CRC) oversees industry limits governance.
Total commercial committed exposure decreased $10.1 billion in 2009 across most industries. Those industries that experienced increases in total commercial committed exposure in 2009 were driven by the Merrill Lynch acquisition.
Diversified financials, our largest industry concentration, experienced an increase in committed exposure of $7.6 billion, or seven percent at December 31, 2009 compared to 2008. The total committed credit exposure increase was driven by the Merrill Lynch portfolio which contributed $34.7 billion, largely the result of $28.8 billion in capital markets industry exposure, primarily comprised of derivatives. This was offset, in part, by a reduction in legacy Bank of America positions of $27.1 billion, the majority of which came from a $21.2 billion reduction in capital markets industry exposure including the cancellation of $8.8 billion in facilities to legacy Merrill Lynch.
Real estate, our second largest industry concentration, experienced a decrease in committed exposure of $12.4 billion, or 12 percent at December 31, 2009 compared to 2008. An $18.6 billion decrease in legacy Bank of America committed exposure, driven primarily by decreases in homebuilder, unsecured commercial real estate and commercial construction and land development exposure, was partially offset by the acquisition of Merrill Lynch. Real estate construction and land development exposure comprised 31 percent of the total real estate industry committed exposure at December 31, 2009. For more information on the commercial real estate and related portfolios, refer to the commercial real estate discussion beginning on page 67.
The insurance and utilities committed exposure increased primarily due to the acquisition of Merrill Lynch. Refer to the Global Markets discussion beginning on page 35 and to the monoline and related exposure discussion below for more information.
Retailing committed exposure declined 16 percent at December 31, 2009 compared to 2008, driven by the retirement of several large retail exposures and paydowns as retailers and wholesalers worked to reduce inventory levels.
Monoline and Related Exposure
Monoline exposure is reported in the insurance industry and managed under insurance portfolio industry limits. Direct loan exposure to monolines consisted of revolvers in the amount of $41 million and $126 million at December 31, 2009 and 2008.
We have indirect exposure to monolines primarily in the form of guarantees supporting our loans, investment portfolios, securitizations, credit-enhanced securities as part of our public finance business and other selected products. Such indirect exposure exists when we purchase credit protection from monolines to hedge all or a portion of the credit risk on certain credit exposures including loans and CDOs. We underwrite our public finance exposure by evaluating the underlying securities.
We also have indirect exposure to monoline financial guarantors, primarily in the form of guarantees supporting our mortgage and other loan sales. Indirect exposure may exist when we purchase credit protection from monoline financial guarantors to hedge all or a portion of the credit risk on certain mortgage and other loan exposures. A loss may occur when we are required to repurchase a loan and the market value of the loan has declined or when we are required to indemnify or provide recourse for a guarantor's loss. We have experienced and continue to experience increasing repurchase demands from and disputes with monoline financial guarantors. We expect to contest such demands that we do not believe are valid. In the event that we are required to repurchase loans that have been the subject of repurchase demands or otherwise provide indemnification or other recourse, this could significantly increase our losses and thereby affect our future earnings. For further information regarding representations and warranties, see Note 8 – Securitizations to the Consolidated Financial Statements and Item 1A., Risk Factors.
Monoline derivative credit exposure at December 31, 2009 had a notional value of $42.6 billion compared to $9.6 billion at December 31, 2008. Mark-to-market monoline derivative credit exposure was $11.1 billion at December 31, 2009 compared to $2.2 billion at December 31, 2008, driven by the addition of Merrill Lynch exposures as well as credit deterioration related to underlying counterparties and spread widening in both wrapped CDO and structured finance related exposures. At December 31, 2009, the counterparty credit valuation adjustment related to monoline derivative exposure was $6.0 billion, which reduced our net mark-to-market exposure to $5.1 billion. We do not hold collateral against these derivative exposures. For more information on our monoline exposure, see the Global Markets discussion beginning on page 35.
We also have indirect exposure as we invest in securities where the issuers have purchased wraps (i.e., insurance). For example, municipalities and corporations purchase protection in order to enhance their pricing power which has the effect of reducing their cost of borrowing. If the ratings agencies downgrade the monolines, the credit rating of the bond may fall and may have an adverse impact on the market value of the security. In the case of default, we first look to the underlying securities and then to recovery on the purchased insurance. Investments in securities issued by municipalities and corporations with purchased wraps at December 31, 2009 and 2008 had a notional value of $5.0 billion and $6.0 billion. Mark-to-market investment exposure was $4.9 billion at December 31, 2009 compared to $5.7 billion at December 31, 2008.
| 70 | Bank of America 2009 |
Table 34 Commercial Credit Exposure by Industry (1, 2, 3)
| December 31 | ||||||||||||||||
| Commercial Utilized | Total Commercial Committed | |||||||||||||||
| (Dollars in millions) | 2009 | 2008 | 2009 | 2008 | ||||||||||||
Diversified financials | $ | 68,876 | $ | 50,327 | $ | 110,948 | $ | 103,306 | ||||||||
Real estate (4) | 75,049 | 79,766 | 91,479 | 103,889 | ||||||||||||
Government and public education | 44,151 | 39,386 | 61,446 | 58,608 | ||||||||||||
Capital goods | 23,834 | 27,588 | 47,413 | 52,522 | ||||||||||||
Healthcare equipment and services | 29,584 | 31,280 | 46,370 | 46,785 | ||||||||||||
Consumer services | 28,517 | 28,715 | 44,164 | 43,948 | ||||||||||||
Retailing | 23,671 | 30,736 | 42,260 | 50,102 | ||||||||||||
Commercial services and supplies | 23,892 | 24,095 | 34,646 | 34,867 | ||||||||||||
Individuals and trusts | 25,191 | 22,752 | 33,678 | 33,045 | ||||||||||||
Materials | 16,373 | 22,825 | 32,898 | 38,105 | ||||||||||||
Insurance | 20,613 | 11,223 | 28,033 | 17,855 | ||||||||||||
Food, beverage and tobacco | 14,812 | 17,257 | 27,985 | 28,521 | ||||||||||||
Utilities | 9,217 | 8,230 | 25,229 | 19,272 | ||||||||||||
Energy | 9,605 | 11,885 | 23,619 | 22,732 | ||||||||||||
Banks | 20,299 | 22,134 | 23,384 | 26,493 | ||||||||||||
Media | 11,236 | 8,939 | 22,832 | 19,301 | ||||||||||||
Transportation | 13,724 | 13,050 | 19,597 | 18,561 | ||||||||||||
Religious and social organizations | 8,920 | 9,539 | 11,371 | 12,576 | ||||||||||||
Pharmaceuticals and biotechnology | 2,875 | 3,721 | 10,343 | 10,111 | ||||||||||||
Consumer durables and apparel | 4,374 | 6,219 | 9,829 | 10,862 | ||||||||||||
Technology hardware and equipment | 3,135 | 3,971 | 9,671 | 10,371 | ||||||||||||
Telecommunication services | 3,558 | 3,681 | 9,478 | 8,036 | ||||||||||||
Software and services | 3,216 | 4,093 | 9,306 | 9,590 | ||||||||||||
Food and staples retailing | 3,680 | 4,282 | 6,562 | 7,012 | ||||||||||||
Automobiles and components | 2,379 | 3,093 | 5,339 | 6,081 | ||||||||||||
Other | 3,596 | 9,962 | 7,390 | 12,781 | ||||||||||||
Total commercial credit exposure by industry | $ | 494,377 | $ | 498,749 | $ | 795,270 | $ | 805,332 | ||||||||
Net credit default protection purchased on total commitments (5) | $ | (19,025 | ) | $ | (9,654 | ) | ||||||||||
| (1) | Total commercial utilized and total commercial committed exposure includes loans and letters of credit accounted for under the fair value option and are comprised of loans outstanding of $4.9 billion and $5.4 billion, and issued letters of credit with a notional amount of $1.7 billion and $1.4 billion at December 31, 2009 and 2008. In addition, total commercial committed exposure includes unfunded loan commitments with a notional amount of $25.3 billion and $15.5 billion at December 31, 2009 and 2008. |
| (2) | Includes small business commercial – domestic exposure. |
| (3) | At December 31, 2009, total commercial utilized and total commercial committed exposure included $88.5 billion and $114.2 billion of exposure due to the acquisition of Merrill Lynch which included $31.7 billion and $34.7 billion in diversified financials and $12.3 billion and $13.0 billion in insurance with the remaining exposure spread across various industries. |
| (4) | Industries are viewed from a variety of perspectives to best isolate the perceived risks. For purposes of this table, the real estate industry is defined based upon the borrowers' or counterparties' primary business activity using operating cash flow and primary source of repayment as key factors. |
| (5) | Represents net notional credit protection purchased. Refer to the Risk Mitigation discussion beginning on page 71 for additional information. |
Risk Mitigation
Credit protection is purchased to cover the funded portion as well as the unfunded portion of certain credit exposure. To lessen the cost of obtaining our desired credit protection levels, credit exposure may be added within an industry, borrower or counterparty group by selling protection.
At December 31, 2009 and 2008, we had net notional credit default protection purchased in our credit derivatives portfolio to hedge our funded and unfunded exposures for which we elected the fair value option as well as certain other credit exposures of $19.0 billion and $9.7 billion. The increase from December 31, 2008 is primarily driven by the acquisition of Merrill Lynch. The mark-to-market impacts, including the cost of net credit default protection hedging our credit exposure, resulted in net
losses of $2.9 billion in 2009 compared to net gains of $993 million in 2008. The average Value-at-Risk (VAR) for these credit derivative hedges was $76 million in 2009 compared to $24 million in 2008. The average VAR for the related credit exposure was $130 million in 2009 compared to $57 million in 2008. The year-over-year increase in VAR was driven by the combination of the Merrill Lynch and Bank of America businesses in 2009. There is a diversification effect between the net credit default protection hedging our credit exposure and the related credit exposure such that the combined average VAR was $89 million in 2009. Refer to the Trading Risk Management discussion beginning on page 80 for a description of our VAR calculation for the market-based trading portfolio.
| Bank of America 2009 | 71 |
Tables 35 and 36 present the maturity profiles and the credit exposure debt ratings of the net credit default protection portfolio at December 31, 2009 and 2008. The distribution of debt rating for net
notional credit default protection purchased is shown as a negative and the net notional credit protection sold is shown as a positive amount.
Table 35 Net Credit Default Protection by Maturity Profile
| December 31 | ||||||
| 2009 | 2008 | |||||
Less than or equal to one year | 16 | % | 1 | % | ||
Greater than one year and less than or equal to five years | 81 | 92 | ||||
Greater than five years | 3 | 7 | ||||
Total net credit default protection | 100 | % | 100 | % | ||
Table 36 Net Credit Default Protection by Credit Exposure Debt Rating (1)
| (Dollars in millions) | December 31 | |||||||||||||||
| 2009 | 2008 | |||||||||||||||
| Ratings (2) | Net Notional | Percent of Total | Net Notional | Percent of Total | ||||||||||||
AAA | $ | 15 | (0.1 | )% | $ | 30 | (0.3 | )% | ||||||||
AA | (344 | ) | 1.8 | (103 | ) | 1.1 | ||||||||||
A | (6,092 | ) | 32.0 | (2,800 | ) | 29.0 | ||||||||||
BBB | (9,573 | ) | 50.4 | (4,856 | ) | 50.2 | ||||||||||
BB | (2,725 | ) | 14.3 | (1,948 | ) | 20.2 | ||||||||||
B | (835 | ) | 4.4 | (579 | ) | 6.0 | ||||||||||
CCC and below | (1,691 | ) | 8.9 | (278 | ) | 2.9 | ||||||||||
NR (3) | 2,220 | (11.7 | ) | 880 | (9.1 | ) | ||||||||||
Total net credit default protection | $ | (19,025 | ) | 100.0 | % | $ | (9,654 | ) | 100.0 | % | ||||||
| (1) | Ratings are refreshed on a quarterly basis. |
| (2) | The Corporation considers ratings of BBB- or higher to meet the definition of investment grade. |
| (3) | In addition to names which have not been rated, "NR" includes $2.3 billion and $948 million in net credit default swaps index positions at December 31, 2009 and 2008. While index positions are principally investment grade, credit default swaps indices include names in and across each of the ratings categories. |
In addition to our net notional credit default protection purchased to cover the funded and unfunded portion of certain credit exposures, credit derivatives are used for market-making activities for clients and establishing positions intended to profit from directional or relative value changes. We execute the majority of our credit derivative positions in the over-the-counter market with large, multinational financial institutions, including broker/dealers and, to a lesser degree, with a variety of other investors. Because these transactions are executed in the over-the-counter market, we are subject to settlement risk. We are also
subject to credit risk in the event that these counterparties fail to perform under the terms of these contracts. In most cases, credit derivative transactions are executed on a daily margin basis. Therefore, events such as a credit downgrade (depending on the ultimate rating level) or a breach of credit covenants would typically require an increase in the amount of collateral required of the counterparty (where applicable), and/or allow us to take additional protective measures such as early termination of all trades.
| 72 | Bank of America 2009 |
The notional amounts presented in Table 37 represent the total contract/notional amount of credit derivatives outstanding and include both purchased and written credit derivatives. The credit risk amounts are measured as the net replacement cost in the event the counterparties with contracts in a gain position to us fail to perform under the terms of those contracts. The addition of Merrill Lynch drove the increase in counterparty credit risk for purchased credit derivatives and the increase in the contract/notional amount. For information on the performance risk of our written credit derivatives, see Note 4 – Derivatives to the Consolidated Financial Statements.
The credit risk amounts discussed above and noted in the table below take into consideration the effects of legally enforceable master netting agreements while amounts disclosed in Note 4 – Derivatives to the Consolidated Financial Statements are shown on a gross basis. Credit risk reflects the potential benefit from offsetting exposure to non-credit derivative products with the same counterparties that may be netted upon the occurrence of certain events, thereby reducing the Corporation's overall exposure.
Table 37 Credit Derivatives
| December 31 | ||||||||||||||
| 2009 | 2008 | |||||||||||||
| (Dollars in millions) | Contract/Notional | Credit Risk | Contract/Notional | Credit Risk | ||||||||||
Credit derivatives | ||||||||||||||
Purchased credit derivatives: | ||||||||||||||
Credit default swaps | $ | 2,800,539 | $ | 25,964 | $ | 1,025,850 | $ | 11,772 | ||||||
Total return swaps/other | 21,685 | 1,740 | 6,601 | 1,678 | ||||||||||
Total purchased credit derivatives | 2,822,224 | 27,704 | 1,032,451 | 13,450 | ||||||||||
Written credit derivatives: | ||||||||||||||
Credit default swaps | 2,788,760 | – | 1,000,034 | – | ||||||||||
Total return swaps/other | 33,109 | – | 6,203 | – | ||||||||||
Total written credit derivatives | 2,821,869 | – | 1,006,237 | – | ||||||||||
Total credit derivatives | $ | 5,644,093 | $ | 27,704 | $ | 2,038,688 | $ | 13,450 | ||||||
Counterparty Credit Risk Valuation Adjustments
We record a counterparty credit risk valuation adjustment on certain derivatives assets, including our credit default protection purchased, in order to properly reflect the credit quality of the counterparty. These adjustments are necessary as the market quotes on derivatives do not fully reflect the credit risk of the counterparties to the derivative assets. We consider collateral and legally enforceable master netting agreements that mitigate our credit exposure to each counterparty in determining the counterparty credit risk valuation adjustment. All or a portion of these counterparty credit risk valuation adjustments are reversed or otherwise
adjusted in future periods due to changes in the value of the derivative contract, collateral and creditworthiness of the counterparty.
During 2009, credit valuation gains (losses) were recognized in trading account profits (losses) related to counterparty credit risk on derivative assets. For additional information on gains or losses related to the counterparty credit risk on derivative assets, refer to Note 4 – Derivatives to the Consolidated Financial Statements . For information on our monoline counterparty credit risk, see the discussion beginning on pages 37 and 70, and for information on our CDO-related counterparty credit risk, see the Global Markets discussion beginning on page 35.
| Bank of America 2009 | 73 |
Foreign Portfolio
Our foreign credit and trading portfolio is subject to country risk. We define country risk as the risk of loss from unfavorable economic and political conditions, currency fluctuations, social instability and changes in government policies. A risk management framework is in place to measure, monitor and manage foreign risk and exposures. Management oversight of country risk including cross-border risk is provided by the Regional Risk Committee, a subcommittee of the CRC.
The following table sets forth total foreign exposure broken out by region at December 31, 2009 and 2008. Foreign exposure includes
credit exposure net of local liabilities, securities, and other investments issued by or domiciled in countries other than the U.S. Total foreign exposure can be adjusted for externally guaranteed outstandings and certain collateral types. Exposures which are assigned external guarantees are reported under the country of the guarantor. Exposures with tangible collateral are reflected in the country where the collateral is held. For securities received, other than cross-border resale agreements, outstandings are assigned to the domicile of the issuer of the securities. Resale agreements are generally presented based on the domicile of the counterparty consistent with FFIEC reporting requirements.
Table 38 Regional Foreign Exposure (1, 2, 3)
| December 31 | ||||||
| (Dollars in millions) | 2009 | 2008 | ||||
Europe | $ | 170,796 | $ | 66,472 | ||
Asia Pacific | 47,645 | 39,774 | ||||
Latin America | 19,516 | 11,378 | ||||
Middle East and Africa | 3,906 | 2,456 | ||||
Other | 15,799 | 10,988 | ||||
Total | $ | 257,662 | $ | 131,068 | ||
| (1) | Local funding or liabilities are subtracted from local exposures consistent with FFIEC reporting requirements. |
| (2) | Exposures have been reduced by $34.3 billion and $19.6 billion at December 31, 2009 and 2008 for the cash applied as collateral to derivative assets. |
| (3) | Generally, resale agreements are presented based on the domicile of the counterparty, consistent with FFIEC reporting requirements. Cross-border resale agreements where the underlying securities are U.S. Treasury securities, in which case the domicile is the U.S., are excluded from this presentation. |
Our total foreign exposure was $257.7 billion at December 31, 2009, an increase of $126.6 billion from December 31, 2008. Our foreign exposure remained concentrated in Europe, which accounted for $170.8 billion, or 66 percent, of total foreign exposure. The European exposure was mostly in Western Europe and was distributed across a variety of industries. Asia Pacific was our second largest foreign exposure at $47.6 billion, or 18 percent. Latin America accounted for $19.5 billion, or eight percent, of total foreign exposure. The increases of $104.3 billion, $7.9 billion and $8.1 billion in our foreign exposure in Europe, Asia Pacific and Latin America, respectively, from December 31, 2008 were primarily due to the acquisition of Merrill Lynch. For more information on our Asia Pacific and Latin America exposure, see the discussion of the foreign exposure to selected countries defined as emerging markets below.
As shown in Table 39, at December 31, 2009 and 2008, the United Kingdom had total cross-border exposure of $60.7 billion and $13.3 billion, representing 2.73 percent and 0.73 percent of our total assets. The
United Kingdom was the only country where the total cross-border exposure exceeded one percent of our total assets at December 31, 2009. The increase of $47.4 billion was primarily due to the acquisition of Merrill Lynch. At December 31, 2009, Germany and France, with total cross-border exposure of $18.9 billion and $17.4 billion, representing 0.85 percent and 0.78 percent of total assets were the only other countries that had total cross-border exposure which exceeded 0.75 percent of our total assets.
Exposure includes cross-border claims by our foreign offices including loans, acceptances, time deposits placed, trading account assets, securities, derivative assets, other interest-earning investments and other monetary assets. Amounts also include unused commitments, SBLCs, commercial letters of credit and formal guarantees. Sector definitions are consistent with FFIEC reporting requirements for preparing the Country Exposure Report.
Table 39 Total Cross-border Exposure Exceeding One Percent of Total Assets (1)
| (Dollars in millions) | December 31 | Public Sector | Banks | Private Sector | Cross-border Exposure | Exposure as a Percentage of Total Assets | |||||||||||
United Kingdom | 2009 | $ | 157 | $ | 8,478 | $ | 52,080 | $ | 60,715 | 2.73 | % | ||||||
| 2008 | 543 | 567 | 12,167 | 13,277 | 0.73 | ||||||||||||
| (1) | At December 31, 2009 and 2008, total cross-border exposure for the United Kingdom included derivatives exposure of $5.0 billion and $3.2 billion, which has been reduced by the amount of cash collateral applied of $7.1 billion and $4.5 billion. Derivative assets were collateralized by other marketable securities of $18 million and $124 million at December 31, 2009 and 2008. |
| 74 | Bank of America 2009 |
As presented in Table 40, foreign exposure to borrowers or counterparties in emerging markets increased $4.7 billion to $50.6 billion at December 31, 2009, compared to $45.8 billion at December 31, 2008. The increase was due to the acquisition of Merrill Lynch partially offset by
the sale of CCB common shares in 2009. Foreign exposure to borrowers or counterparties in emerging markets represented 20 percent and 35 percent of total foreign exposure at December 31, 2009 and 2008.
Table 40 Selected Emerging Markets (1)
| (Dollars in millions) | Loans and Leases, and Loan Commitments | Other Financing (2) | Derivative Assets (3) | Securities/ Other Investments (4) | Total Cross- border | Local Country Exposure Net of Local Liabilities (6) | Total Emerging Market Exposure at December 31, 2009 | Increase (Decrease) From December 31, 2008 | |||||||||||||||||
Region/Country | |||||||||||||||||||||||||
Asia Pacific | |||||||||||||||||||||||||
China | $ | 572 | $ | 517 | $ | 704 | $ | 10,270 | $ | 12,063 | $ | – | $ | 12,063 | $ | (8,642 | ) | ||||||||
India | 1,702 | 1,091 | 639 | 1,704 | 5,136 | 1,024 | 6,160 | 1,726 | |||||||||||||||||
South Korea | 428 | 803 | 1,275 | 2,505 | 5,011 | – | 5,011 | 335 | |||||||||||||||||
Hong Kong | 391 | 337 | 98 | 276 | 1,102 | – | 1,102 | 421 | |||||||||||||||||
Singapore | 293 | 54 | 228 | 293 | 868 | – | 868 | (701 | ) | ||||||||||||||||
Taiwan | 279 | 32 | 86 | 127 | 524 | 205 | 729 | (113 | ) | ||||||||||||||||
Other Asia Pacific (7) | 248 | 63 | 147 | 505 | 963 | 68 | 1,031 | 426 | |||||||||||||||||
Total Asia Pacific | 3,913 | 2,897 | 3,177 | 15,680 | 25,667 | 1,297 | 26,964 | (6,548 | ) | ||||||||||||||||
Latin America | |||||||||||||||||||||||||
Brazil | 522 | 475 | 156 | 6,396 | 7,549 | 1,905 | 9,454 | 5,585 | |||||||||||||||||
Mexico | 1,667 | 291 | 524 | 2,860 | 5,342 | 129 | 5,471 | 1,314 | |||||||||||||||||
Chile | 604 | 248 | 281 | 26 | 1,159 | 2 | 1,161 | 582 | |||||||||||||||||
Other Latin America (7) | 150 | 319 | 354 | 446 | 1,269 | 211 | 1,480 | 833 | |||||||||||||||||
Total Latin America | 2,943 | 1,333 | 1,315 | 9,728 | 15,319 | 2,247 | 17,566 | 8,314 | |||||||||||||||||
Middle East and Africa | |||||||||||||||||||||||||
South Africa | 133 | 2 | 93 | 920 | 1,148 | – | 1,148 | 821 | |||||||||||||||||
Bahrain | 119 | 8 | 36 | 970 | 1,133 | – | 1,133 | (56 | ) | ||||||||||||||||
United Arab Emirates | 469 | 12 | 167 | 72 | 720 | – | 720 | 310 | |||||||||||||||||
Other Middle East and Africa (7) | 315 | 92 | 142 | 218 | 767 | 1 | 768 | 239 | |||||||||||||||||
Total Middle East and Africa | 1,036 | 114 | 438 | 2,180 | 3,768 | 1 | 3,769 | 1,314 | |||||||||||||||||
Central and Eastern Europe | |||||||||||||||||||||||||
Russian Federation | 116 | 66 | 273 | 214 | 669 | – | 669 | 577 | |||||||||||||||||
Other Central and Eastern Europe (7) | 141 | 356 | 289 | 788 | 1,574 | 32 | 1,606 | 1,069 | |||||||||||||||||
Total Central and Eastern Europe | 257 | 422 | 562 | 1,002 | 2,243 | 32 | 2,275 | 1,646 | |||||||||||||||||
Total emerging market exposure | $ | 8,149 | $ | 4,766 | $ | 5,492 | $ | 28,590 | $ | 46,997 | $ | 3,577 | $ | 50,574 | $ | 4,726 | |||||||||
| (1) | There is no generally accepted definition of emerging markets. The definition that we use includes all countries in Asia Pacific excluding Japan, Australia and New Zealand; all countries in Latin America excluding Cayman Islands and Bermuda; all countries in Middle East and Africa; and all countries in Central and Eastern Europe. There was no emerging market exposure included in the portfolio accounted for under the fair value option at December 31, 2009 and 2008. |
| (2) | Includes acceptances, SBLCs, commercial letters of credit and formal guarantees. |
| (3) | Derivative assets are carried at fair value and have been reduced by the amount of cash collateral applied of $557 million and $152 million at December 31, 2009 and 2008. At December 31, 2009 and 2008, there were $616 million and $531 million of other marketable securities collateralizing derivative assets. |
| (4) | Generally, cross-border resale agreements are presented based on the domicile of the counterparty, consistent with FFIEC reporting requirements. Cross-border resale agreements where the underlying securities are U.S. Treasury securities, in which case the domicile is the U.S., are excluded from this presentation. |
| (5) | Cross-border exposure includes amounts payable to the Corporation by borrowers or counterparties with a country of residence other than the one in which the credit is booked, regardless of the currency in which the claim is denominated, consistent with FFIEC reporting requirements. |
| (6) | Local country exposure includes amounts payable to the Corporation by borrowers with a country of residence in which the credit is booked, regardless of the currency in which the claim is denominated. Local funding or liabilities are subtracted from local exposures consistent with FFIEC reporting requirements. Total amount of available local liabilities funding local country exposure at December 31, 2009 was $17.6 billion compared to $12.6 billion at December 31, 2008. Local liabilities at December 31, 2009 in Asia Pacific, Latin America, and Middle East and Africa were $16.3 billion, $857 million and $449 million, respectively, of which $8.7 billion were in Singapore, $2.1 billion were in Hong Kong, $1.5 billion were in both China and India, $1.3 billion were in South Korea, and $734 million were in Mexico. There were no other countries with available local liabilities funding local country exposure greater than $500 million. |
| (7) | No country included in Other Asia Pacific, Other Latin America, Other Middle East and Africa, and Other Central and Eastern Europe had total foreign exposure of more than $500 million. |
| Bank of America 2009 | 75 |
At December 31, 2009 and 2008, 53 percent and 73 percent of the emerging markets exposure was in Asia Pacific. Emerging markets exposure in Asia Pacific decreased by $6.5 billion driven by the sale of CCB common shares in 2009. Our exposure in China was primarily related to our equity investment in CCB which accounted for $9.2 billion and $19.7 billion at December 31, 2009 and 2008. For more information on our CCB investment, refer to the All Other discussion beginning on page 41.
At December 31, 2009, 35 percent of the emerging markets exposure was in Latin America compared to 20 percent at December 31, 2008. Latin America emerging markets exposure increased by $8.3 billion due to the acquisition of Merrill Lynch. Our exposure in Brazil was primarily related to the carrying value of our investment in Itaú Unibanco, which accounted for $5.4 billion and $2.5 billion of exposure in Brazil at December 31, 2009 and 2008. Our equity investment in Itaú Unibanco represents five percent and eight percent of its outstanding voting and non-voting shares at December 31, 2009 and 2008. Our exposure in Mexico was primarily related to our 24.9 percent investment in Santander, which is classified as securities and other investments in Table 40, and accounted for $2.5 billion and $2.1 billion of exposure in Mexico at December 31, 2009 and 2008.
At December 31, 2009 and 2008, seven percent and six percent of the emerging markets exposure was in Middle East and Africa, with the increase of $1.3 billion due to the acquisition of Merrill Lynch.
At December 31, 2009 and 2008, five percent and one percent of the emerging markets exposure was in Central and Eastern Europe which increased by $1.6 billion due to the acquisition of Merrill Lynch.
Provision for Credit Losses
The provision for credit losses increased $21.7 billion to $48.6 billion for 2009 compared to 2008.
The consumer portion of the provision for credit losses increased $15.1 billion to $36.9 billion for 2009 compared to 2008. The increase was driven by higher net charge-offs in our consumer real estate, consumer credit card and consumer lending portfolios, reflecting deterioration in the economy and housing markets. In addition to higher net charge-offs, the provision increase was also driven by higher reserve additions for deterioration in the purchased impaired and residential mortgage portfolios, new draws on previously securitized accounts as well as an approximate $800 million addition to increase the reserve coverage to approximately 12 months of charge-offs in consumer credit card. These increases were partially offset by lower reserve additions in our unsecured domestic consumer lending portfolios resulting from improved delinquencies and in the home equity portfolio due to the slowdown in the pace of deterioration. In the Countrywide and Merrill Lynch consumer purchased impaired portfolios, the additions to reserves to reflect further reductions in expected principal cash flows were $3.5 billion in 2009 compared to $750 million in 2008. The increase was primarily related to the home equity purchased impaired portfolio.
The commercial portion of the provision for credit losses including the provision for unfunded lending commitments increased $6.7 billion to $11.7 billion for 2009 compared to 2008. The increase was driven by higher net charge-offs and higher additions to the reserves in the commercial real estate and commercial – domestic portfolios, reflecting deterioration across a broad range of property types, industries and borrowers. These increases were partially offset by lower reserve additions in the small business portfolio due to improved delinquencies.
Allowance for Credit Losses
The allowance for loan and lease losses excludes loans accounted for under the fair value option as fair value adjustments related to loans measured at fair value include a credit risk component. The allowance for loan and lease losses is allocated based on two components. We evaluate the adequacy of the allowance for loan and lease losses based on the combined total of these two components.
The first component of the allowance for loan and lease losses covers those commercial loans, excluding loans accounted for under the fair value option, that are either nonperforming or impaired, or consumer real estate loans that have been modified in a TDR. These loans are subject to impairment measurement at the loan level based on the present value of expected future cash flows discounted at the loan's contractual effective interest rate (or collateral value or observable market price). When the values are lower than the carrying value of that loan, impairment is recognized. For purposes of computing this specific loss component of the allowance, larger impaired loans are evaluated individually and smaller impaired loans are evaluated as a pool using historical loss experience for the respective product types and risk ratings of the loans.
The second component of the allowance for loan and lease losses covers performing consumer and commercial loans and leases excluding loans accounted for under the fair value option. The allowance for commercial loan and lease losses is established by product type after analyzing historical loss experience by internal risk rating, current economic conditions, industry performance trends, geographic or obligor concentrations within each portfolio segment, and any other pertinent information. The commercial historical loss experience is updated quarterly to incorporate the most recent data reflective of the current economic environment. As of December 31, 2009, quarterly updates to historical loss experience resulted in an increase in the allowance for loan and lease losses most significantly in the commercial real estate portfolio. The allowance for consumer and certain homogeneous commercial loan and lease products is based on aggregated portfolio segment evaluations, generally by product type. Loss forecast models are utilized that consider a variety of factors including, but not limited to, historical loss experience, estimated defaults or foreclosures based on portfolio trends, delinquencies, economic trends and credit scores. These loss forecast models are updated on a quarterly basis to incorporate information reflecting the current economic environment. As of December 31, 2009, quarterly updates to the loss forecast models resulted in increases in the allowance for loan and lease losses in the consumer real estate and foreign credit card portfolios and reductions in the allowance for the Global Card Services consumer lending and domestic credit card portfolios.
We monitor differences between estimated and actual incurred loan and lease losses. This monitoring process includes periodic assessments by senior management of loan and lease portfolios and the models used to estimate incurred losses in those portfolios.
Additions to the allowance for loan and lease losses are made by charges to the provision for credit losses. Credit exposures deemed to be uncollectible are charged against the allowance for loan and lease losses. Recoveries of previously charged off amounts are credited to the allowance for loan and lease losses.
The allowance for loan and lease losses for the consumer portfolio as presented in Table 42 was $27.8 billion at December 31, 2009, an increase of $11.1 billion from December 31, 2008. This increase was primarily related to the impact of the weak economy and deterioration in
| 76 | Bank of America 2009 |
the housing markets, which drove reserve builds for higher losses across most consumer portfolios. With respect to the Countrywide and Merrill Lynch consumer purchased impaired portfolios, updating of our expected principal cash flows resulted in an increase in reserves of $3.5 billion in the home equity, discontinued real estate, and residential mortgage portfolios.
The allowance for commercial loan and lease losses was $9.4 billion at December 31, 2009, a $3.0 billion increase from December 31, 2008. The increase in allowance levels was driven by reserve increases on the commercial real estate and commercial – domestic portfolios within Global Banking .
The allowance for loan and lease losses as a percentage of total loans and leases outstanding was 4.16 percent at December 31, 2009, compared to 2.49 percent at December 31, 2008. The increase in the ratio was primarily driven by consumer reserve increases for higher losses in the residential mortgage, consumer card and home equity portfolios, reflecting deterioration in the housing markets and the impact of the weak economy. The increase was also the result of reserve increases in the commercial real estate and commercial – domestic portfolios reflecting broad-based deterioration across various borrowers, industries, and property types. In addition, the December 31, 2009 and 2008 ratios include the impact of the purchased impaired portfolio. Excluding the impacts of the purchased impaired portfolio, the allowance for loan and lease losses as a percentage of total loans and leases outstanding was 3.88 percent at December 31, 2009, compared to 2.53 percent at December 31, 2008.
Reserve for Unfunded Lending Commitments
In addition to the allowance for loan and lease losses, we also estimate probable losses related to unfunded lending commitments excluding commitments accounted for under the fair value option, such as letters of credit and financial guarantees, and binding unfunded loan commitments. Unfunded lending commitments are subject to the same assessment as funded loans, except utilization assumptions are considered. The reserve for unfunded lending commitments is included in accrued expenses and other liabilities on the Consolidated Balance Sheet with changes to the reserve generally made through the provision for credit losses.
The reserve for unfunded lending commitments at December 31, 2009 was $1.5 billion compared to $421 million at December 31, 2008. The increase was largely driven by the fair value of the acquired Merrill Lynch unfunded lending commitments.
| Bank of America 2009 | 77 |
Table 41 presents a rollforward of the allowance for credit losses for 2009 and 2008.
Table 41 Allowance for Credit Losses
| (Dollars in millions) | 2009 | 2008 | ||||||
Allowance for loan and lease losses, January 1 | $ | 23,071 | $ | 11,588 | ||||
Loans and leases charged off | ||||||||
Residential mortgage | (4,436 | ) | (964 | ) | ||||
Home equity | (7,205 | ) | (3,597 | ) | ||||
Discontinued real estate | (104 | ) | (19 | ) | ||||
Credit card – domestic | (6,753 | ) | (4,469 | ) | ||||
Credit card – foreign | (1,332 | ) | (639 | ) | ||||
Direct/Indirect consumer | (6,406 | ) | (3,777 | ) | ||||
Other consumer | (491 | ) | (461 | ) | ||||
Total consumer charge-offs | (26,727 | ) | (13,926 | ) | ||||
Commercial – domestic (1) | (5,237 | ) | (2,567 | ) | ||||
Commercial real estate | (2,744 | ) | (895 | ) | ||||
Commercial lease financing | (217 | ) | (79 | ) | ||||
Commercial – foreign | (558 | ) | (199 | ) | ||||
Total commercial charge-offs | (8,756 | ) | (3,740 | ) | ||||
Total loans and leases charged off | (35,483 | ) | (17,666 | ) | ||||
Recoveries of loans and leases previously charged off | ||||||||
Residential mortgage | 86 | 39 | ||||||
Home equity | 155 | 101 | ||||||
Discontinued real estate | 3 | 3 | ||||||
Credit card – domestic | 206 | 308 | ||||||
Credit card – foreign | 93 | 88 | ||||||
Direct/Indirect consumer | 943 | 663 | ||||||
Other consumer | 63 | 62 | ||||||
Total consumer recoveries | 1,549 | 1,264 | ||||||
Commercial – domestic (2) | 161 | 118 | ||||||
Commercial real estate | 42 | 8 | ||||||
Commercial lease financing | 22 | 19 | ||||||
Commercial – foreign | 21 | 26 | ||||||
Total commercial recoveries | 246 | 171 | ||||||
Total recoveries of loans and leases previously charged off | 1,795 | 1,435 | ||||||
Net charge-offs | (33,688 | ) | (16,231 | ) | ||||
Provision for loan and lease losses | 48,366 | 26,922 | ||||||
Write-downs on consumer purchased impaired loans (3) | (179 | ) | n/a | |||||
Other (4) | (370 | ) | 792 | |||||
Allowance for loan and lease losses, December 31 | 37,200 | 23,071 | ||||||
Reserve for unfunded lending commitments, January 1 | 421 | 518 | ||||||
Provision for unfunded lending commitments | 204 | (97 | ) | |||||
Other (5) | 862 | – | ||||||
Reserve for unfunded lending commitments, December 31 | 1,487 | 421 | ||||||
Allowance for credit losses, December 31 | $ | 38,687 | $ | 23,492 | ||||
Loans and leases outstanding at December 31 (6) | $ | 895,192 | $ | 926,033 | ||||
Allowance for loan and lease losses as a percentage of total loans and leases outstanding at December 31 (3, 6) | 4.16 | % | 2.49 | % | ||||
Consumer allowance for loan and lease losses as a percentage of total consumer loans and leases outstanding at December 31 (3) | 4.81 | 2.83 | ||||||
Commercial allowance for loan and lease losses as a percentage of total commercial loans and leases outstanding at December 31 (3) | 2.96 | 1.90 | ||||||
Average loans and leases outstanding (3, 6) | $ | 941,862 | $ | 905,944 | ||||
Net charge-offs as a percentage of average loans and leases outstanding (3, 6) | 3.58 | % | 1.79 | % | ||||
Allowance for loan and lease losses as a percentage of total nonperforming loans and leases at December 31 (3, 6) | 111 | 141 | ||||||
Ratio of the allowance for loan and lease losses at December 31 to net charge-offs (3) | 1.10 | 1.42 | ||||||
| (1) | Includes small business commercial – domestic charge-offs of $3.0 billion and $2.0 billion in 2009 and 2008. |
| (2) | Includes small business commercial – domestic recoveries of $65 million and $39 million in 2009 and 2008. |
| (3) | Allowance for loan and lease losses includes $3.9 billion and $750 million of valuation allowance for consumer purchased impaired loans at December 31, 2009 and 2008. Excluding the valuation allowance for purchased impaired loans, allowance for loan and lease losses as a percentage of total nonperforming loans and leases would have been 99 percent and 136 percent at December 31, 2009 and 2008. For more information on the impact of purchased impaired loans on asset quality, see Consumer Portfolio Credit Risk Management beginning on page 54 and Commercial Portfolio Credit Risk Management beginning on page 64. |
| (4) | The 2009 amount includes a $750 million reduction in the allowance for loan and lease losses related to credit card loans of $8.5 billion which were exchanged for a $7.8 billion held-to-maturity debt security that was issued by the Corporation's U.S. Credit Card Securitization Trust and retained by the Corporation. This reduction was partially offset by a $340 million increase associated with the reclassification to other assets of the December 31, 2008 amount expected to be reimbursed under residential mortgage cash collateralized synthetic securitizations. The 2008 amount includes the $1.2 billion addition of the Countrywide allowance for loan losses as of July 1, 2008. |
| (5) | The 2009 amount represents the fair value of the acquired Merrill Lynch unfunded lending commitments excluding those accounted for under the fair value option, net of accretion and the impact of funding previously unfunded portions. |
| (6) | Outstanding loan and lease balances and ratios do not include loans accounted for under the fair value option. Loans measured at fair value were $4.9 billion and $5.4 billion at December 31, 2009 and 2008. Average loans measured at fair value were $6.9 billion and $4.9 billion for 2009 and 2008. |
| n/a | = not applicable |
| 78 | Bank of America 2009 |
For reporting purposes, we allocate the allowance for credit losses across products. However, the allowance is available to absorb any credit losses without restriction. Table 42 presents our allocation by product type.
Table 42 Allocation of the Allowance for Credit Losses by Product Type
| December 31 | ||||||||||||||||||||
| 2009 | 2008 | |||||||||||||||||||
| (Dollars in millions) | Amount | Percent of Total | Percent of Loans and Leases Outstanding (1) | Amount | Percent of Total | Percent of Loans and Leases Outstanding (1) | ||||||||||||||
Allowance for loan and lease losses | ||||||||||||||||||||
Residential mortgage | $ | 4,607 | 12.38 | % | 1.90 | % | $ | 1,382 | 5.99 | % | 0.56 | % | ||||||||
Home equity | 10,160 | 27.31 | 6.81 | 5,385 | 23.34 | 3.53 | ||||||||||||||
Discontinued real estate | 989 | 2.66 | 6.66 | 658 | 2.85 | 3.29 | ||||||||||||||
Credit card – domestic | 6,017 | 16.18 | 12.17 | 3,947 | 17.11 | 6.16 | ||||||||||||||
Credit card – foreign | 1,581 | 4.25 | 7.30 | 742 | 3.22 | 4.33 | ||||||||||||||
Direct/Indirect consumer | 4,227 | 11.36 | 4.35 | 4,341 | 18.81 | 5.20 | ||||||||||||||
Other consumer | 204 | 0.55 | 6.53 | 203 | 0.88 | 5.87 | ||||||||||||||
Total consumer | 27,785 | 74.69 | 4.81 | 16,658 | 72.20 | 2.83 | ||||||||||||||
Commercial – domestic (2) | 5,152 | 13.85 | 2.59 | 4,339 | 18.81 | 1.98 | ||||||||||||||
Commercial real estate | 3,567 | 9.59 | 5.14 | 1,465 | 6.35 | 2.26 | ||||||||||||||
Commercial lease financing | 291 | 0.78 | 1.31 | 223 | 0.97 | 1.00 | ||||||||||||||
Commercial – foreign | 405 | 1.09 | 1.50 | 386 | 1.67 | 1.25 | ||||||||||||||
Total commercial (3) | 9,415 | 25.31 | 2.96 | 6,413 | 27.80 | 1.90 | ||||||||||||||
Allowance for loan and lease losses | 37,200 | 100.00 | % | 4.16 | % | 23,071 | 100.00 | % | 2.49 | % | ||||||||||
Reserve for unfunded lending commitments (4) | 1,487 | 421 | ||||||||||||||||||
Allowance for credit losses (5) | $ | 38,687 | $ | 23,492 | ||||||||||||||||
| (1) | Ratios are calculated as allowance for loan and lease losses as a percentage of loans and leases outstanding excluding loans accounted for under the fair value option for each loan and lease category. Loans accounted for under the fair value option include commercial – domestic loans of $3.0 billion and $3.5 billion, commercial – foreign loans of $1.9 billion and $1.7 billion, and commercial real estate loans of $90 million and $203 million at December 31, 2009 and 2008. |
| (2) | Includes allowance for small business commercial – domestic loans of $2.4 billion at both December 31, 2009 and 2008. |
| (3) | Includes allowance for loan and lease losses for impaired commercial loans of $1.2 billion and $691 million at December 31, 2009 and 2008. |
| (4) | The majority of the increase from December 31, 2008 relates to the fair value of the acquired Merrill Lynch unfunded lending commitments, excluding commitments accounted for under the fair value option. |
| (5) | Includes $3.9 billion and $750 million related to purchased impaired loans at December 31, 2009 and 2008. |
Market Risk Management
Market risk is the risk that values of assets and liabilities or revenues will be adversely affected by changes in market conditions such as market movements. This risk is inherent in the financial instruments associated with our operations and/or activities including loans, deposits, securities, short-term borrowings, long-term debt, trading account assets and liabilities, and derivatives. Market-sensitive assets and liabilities are generated through loans and deposits associated with our traditional banking business, customer and other trading operations, ALM process, credit risk mitigation activities and mortgage banking activities. In the event of market volatility, factors such as underlying market movements and liquidity have an impact on the results of the Corporation.
Our traditional banking loan and deposit products are nontrading positions and are generally reported at amortized cost for assets or the amount owed for liabilities (historical cost). However, these positions are still subject to changes in economic value based on varying market conditions, primarily changes in the levels of interest rates. The risk of adverse changes in the economic value of our nontrading positions is managed through our ALM activities. We have elected to account for certain assets and liabilities under the fair value option. For further information on the fair value of certain financial assets and liabilities, see Note 20 – Fair Value Measurements to the Consolidated Financial Statements.
Our trading positions are reported at fair value with changes currently reflected in income. Trading positions are subject to various risk factors, which include exposures to interest rates and foreign exchange rates, as
well as mortgage, equity, commodity, issuer and market liquidity risk factors. We seek to mitigate these risk exposures by using techniques that encompass a variety of financial instruments in both the cash and derivatives markets. The following discusses the key risk components along with respective risk mitigation techniques.
Interest Rate Risk
Interest rate risk represents exposures to instruments whose values vary with the level or volatility of interest rates. These instruments include, but are not limited to, loans, debt securities, certain trading-related assets and liabilities, deposits, borrowings and derivative instruments. Hedging instruments used to mitigate these risks include related derivatives such as options, futures, forwards and swaps.
Foreign Exchange Risk
Foreign exchange risk represents exposures to changes in the values of current holdings and future cash flows denominated in other currencies. The types of instruments exposed to this risk include investments in foreign subsidiaries, foreign currency-denominated loans and securities, future cash flows in foreign currencies arising from foreign exchange transactions, foreign currency-denominated debt and various foreign exchange derivative instruments whose values fluctuate with changes in the level or volatility of currency exchange rates or foreign interest rates. Hedging instruments used to mitigate this risk include foreign exchange options, currency swaps, futures, forwards, foreign currency- denominated debt and deposits.
| Bank of America 2009 | 79 |
Mortgage Risk
Mortgage risk represents exposures to changes in the value of mortgage-related instruments. The values of these instruments are sensitive to prepayment rates, mortgage rates, agency debt ratings, default, market liquidity, other interest rates and interest rate volatility. Our exposure to these instruments takes several forms. First, we trade and engage in market-making activities in a variety of mortgage securities including whole loans, pass-through certificates, commercial mortgages, and CMOs including CDOs using mortgages as underlying collateral. Second, we originate a variety of MBS which involves the accumulation of mortgage-related loans in anticipation of eventual securitization. Third, we may hold positions in mortgage securities and residential mortgage loans as part of the ALM portfolio. Fourth, we create MSRs as part of our mortgage origination activities. See Note 1 – Summary of Significant Accounting Principles and Note 22 – Mortgage Servicing Rights to the Consolidated Financial Statements for additional information on MSRs. Hedging instruments used to mitigate this risk include options, futures, forwards, swaps, swaptions and securities.
Equity Market Risk
Equity market risk represents exposures to securities that represent an ownership interest in a corporation in the form of domestic and foreign common stock or other equity-linked instruments. Instruments that would lead to this exposure include, but are not limited to, the following: common stock, exchange traded funds, American Depositary Receipts, convertible bonds, listed equity options (puts and calls), over-the-counter equity options, equity total return swaps, equity index futures and other equity derivative products. Hedging instruments used to mitigate this risk include options, futures, swaps, convertible bonds and cash positions.
Commodity Risk
Commodity risk represents exposures to instruments traded in the petroleum, natural gas, power and metals markets. These instruments consist primarily of futures, forwards, swaps and options. Hedging instruments used to mitigate this risk include options, futures and swaps in the same or similar commodity product, as well as cash positions.
Issuer Credit Risk
Issuer credit risk represents exposures to changes in the creditworthiness of individual issuers or groups of issuers. Our portfolio is exposed to issuer credit risk where the value of an asset may be adversely impacted by changes in the levels of credit spreads, by credit migration, or by defaults. Hedging instruments used to mitigate this risk include bonds, CDS and other credit fixed income instruments.
Market Liquidity Risk
Market liquidity risk represents the risk that expected market activity changes dramatically and, in certain cases, may even cease to exist. This exposes us to the risk that we will not be able to transact in an orderly manner and may impact our results. This impact could further be exacerbated if expected hedging or pricing correlations are impacted by the disproportionate demand or lack of demand for certain instruments. We utilize various risk mitigating techniques as discussed in more detail in Trading Risk Management.
Trading Risk Management
Trading-related revenues represent the amount earned from trading positions, including market-based net interest income, which are taken in a diverse range of financial instruments and markets. Trading account assets and liabilities and derivative positions are reported at fair value. For more information on fair value, see Note 20 – Fair Value Measurements to the Consolidated Financial Statements. Trading-related revenues can be volatile and are largely driven by general market conditions and customer demand. Trading-related revenues are dependent on the volume and type of transactions, the level of risk assumed, and the volatility of price and rate movements at any given time within the ever-changing market environment.
The Global Markets Risk Committee (GRC), chaired by the Global Markets Risk Executive, has been designated by ALMRC as the primary governance authority for Global Markets Risk Management including trading risk management. The GRC's focus is to take a forward-looking view of the primary credit and market risks impacting Global Markets and prioritize those that need a proactive risk mitigation strategy. Market risks that impact lines of business outside of Global Markets are monitored and governed by their respective governance authorities.
At the GRC meetings, the committee considers significant daily revenues and losses by business along with an explanation of the primary driver of the revenue or loss. Thresholds are established for each of our businesses in order to determine if the revenue or loss is considered to be significant for that business. If any of the thresholds are exceeded, an explanation of the variance is made to the GRC. The thresholds are developed in coordination with the respective risk managers to highlight those revenues or losses which exceed what is considered to be normal daily income statement volatility.
| 80 | Bank of America 2009 |
The following histogram is a graphic depiction of trading volatility and illustrates the daily level of trading-related revenue for the twelve months ended December 31, 2009 as compared with the twelve months ended December 31, 2008. During the twelve months ended December 31, 2009, positive trading-related revenue was recorded for 88 percent of the trading days of which 72 percent were daily trading gains of over $25 million, six percent of the trading days had losses greater than $25 million
and the largest loss was $100 million. This can be compared to the twelve months ended December 31, 2008, where positive trading-related revenue was recorded for 66 percent of the trading days of which 39 percent were daily trading gains of over $25 million, 17 percent of the trading days had losses greater than $25 million and the largest loss was $173 million. The increase in daily trading gains of over $25 million in 2009 compared to 2008 was driven by more favorable market conditions.
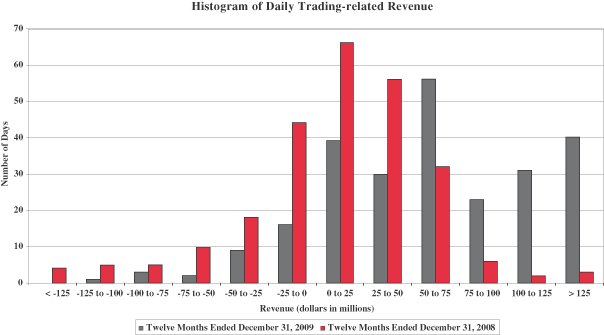
To evaluate risk in our trading activities, we focus on the actual and potential volatility of individual positions as well as portfolios. VAR is a key statistic used to measure market risk. In order to manage day-to-day risks, VAR is subject to trading limits both for our overall trading portfolio and within individual businesses. All limit excesses are communicated to management for review.
A VAR model simulates the value of a portfolio under a range of hypothetical scenarios in order to generate a distribution of potential gains and losses. VAR represents the worst loss the portfolio is expected to experience based on historical trends with a given level of confidence and depends on the volatility of the positions in the portfolio and on how strongly their risks are correlated. Within any VAR model, there are significant and numerous assumptions that will differ from company to company. In addition, the accuracy of a VAR model depends on the availability and quality of historical data for each of the positions in the portfolio. A VAR model may require additional modeling assumptions for new products which do not have extensive historical price data or for illiquid positions for which accurate daily prices are not consistently available.
A VAR model is an effective tool in estimating ranges of potential gains and losses on our trading portfolios. There are however many limitations inherent in a VAR model as it utilizes historical results over a
defined time period to estimate future performance. Historical results may not always be indicative of future results and changes in market conditions or in the composition of the underlying portfolio could have a material impact on the accuracy of the VAR model. To ensure that the VAR model reflects current market conditions, we update the historical data underlying our VAR model on a bi-weekly basis and regularly review the assumptions underlying the model.
We continually review, evaluate and enhance our VAR model to ensure that it reflects the material risks in our trading portfolio. Nevertheless, due to the limitations mentioned above, we have historically used the VAR model as only one of the components in managing our trading risk and also use other techniques such as stress testing and desk level limits. Periods of extreme market stress influence the reliability of these techniques to various degrees.
The accuracy of the VAR methodology is reviewed by backtesting (i.e., comparing actual results against expectations derived from historical data) the VAR results against the daily profit and loss. Graphic representation of the backtesting results with additional explanation of backtesting excesses are reported to the GRC. Backtesting excesses occur when trading losses exceed VAR. Senior management reviews and evaluates the results of these tests.
| Bank of America 2009 | 81 |
The following graph shows daily trading-related revenue and VAR for the twelve months ended December 31, 2009. Actual losses did not exceed daily trading VAR in the twelve months ended December 31, 2009. Actual losses exceeded daily trading VAR two times in the twelve months ended December 31, 2008.
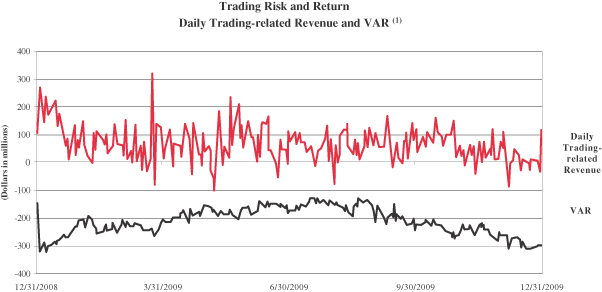
| (1) | Our VAR model uses a historical simulation approach based on three years of historical data and an expected shortfall methodology equivalent to a 99 percent confidence level. Statistically, this means that losses will exceed VAR, on average, one out of 100 trading days, or two to three times each year. |
Table 43 presents average, high and low daily trading VAR for 2009 and 2008.
Table 43 Trading Activities Market Risk VAR
| 2009 | 2008 | |||||||||||||||||||||
| VAR | VAR | |||||||||||||||||||||
| (Dollars in millions) | Average | High (1) | Low (1) | Average | High (1) | Low (1) | ||||||||||||||||
Foreign exchange | $ | 20.3 | $ | 55.4 | $ | 6.1 | $ | 7.7 | $ | 11.7 | $ | 5.0 | ||||||||||
Interest rate | 73.7 | 136.7 | 43.6 | 28.9 | 68.3 | 12.4 | ||||||||||||||||
Credit | 183.3 | 338.7 | 123.9 | 84.6 | 185.2 | 44.1 | ||||||||||||||||
Real estate/mortgage | 51.1 | 81.3 | 32.4 | 22.7 | 43.1 | 12.8 | ||||||||||||||||
Equities | 44.6 | 87.6 | 23.6 | 28.0 | 63.9 | 15.5 | ||||||||||||||||
Commodities | 20.2 | 29.1 | 16.0 | 8.2 | 17.7 | 2.4 | ||||||||||||||||
Portfolio diversification | (187.0 | ) | – | – | (69.4 | ) | – | – | ||||||||||||||
Total market-based trading portfolio (2) | $ | 206.2 | $ | 325.2 | $ | 117.9 | $ | 110.7 | $ | 255.7 | $ | 64.1 | ||||||||||
| (1) | The high and low for the total portfolio may not equal the sum of the individual components as the highs or lows of the individual portfolios may have occurred on different trading days. |
| (2) | The table above does not include credit protection purchased to manage our counterparty credit risk. |
The increase in average VAR during 2009 as compared to 2008 resulted from the acquisition of Merrill Lynch. In periods of market stress, the GRC members communicate daily to discuss losses and VAR limit excesses. As a result of this process, the lines of business may selectively reduce risk. Where economically feasible, positions are sold or macroeconomic hedges are executed to reduce the exposure.
Counterparty credit risk is an adjustment to the mark-to-market value of our derivative exposures reflecting the impact of the credit quality of counterparties on our derivative assets. Since counterparty credit exposure is not included in the VAR component of the regulatory capital allocation, we do not include it in our trading VAR, and it is therefore not included in the daily trading-related revenue illustrated in our histogram or used for backtesting.
Trading Portfolio Stress Testing
Because the very nature of a VAR model suggests results can exceed our estimates, we also "stress test" our portfolio. Stress testing estimates the value change in our trading portfolio that may result from abnormal market movements. Various scenarios, categorized as either historical or hypothetical, are regularly run and reported for the overall trading portfolio and individual businesses. Historical scenarios simulate the impact of price changes which occurred during a set of extended historical market events. Generally, a 10-business-day window or longer, representing the most severe point during the crisis, is selected for each historical scenario. Hypothetical scenarios provide simulations of anticipated shocks from predefined market stress events. These stress events include shocks to underlying market risk variables which may be well beyond the shocks found in the historical data used to calculate the VAR. As with the histor -
| 82 | Bank of America 2009 |
ical scenarios, the hypothetical scenarios are designed to represent a short-term market disruption. Scenarios are reviewed and updated as necessary in light of changing positions and new economic or political information. In addition to the value afforded by the results themselves, this information provides senior management with a clear picture of the trend of risk being taken given the relatively static nature of the shocks applied. Stress testing for the trading portfolio is also integrated with the enterprise-wide stress testing. A process has been established to ensure consistency between the scenarios used for the trading portfolio and those used for enterprise-wide stress testing. The scenarios used for enterprise-wide stress testing purposes differ from the typical trading portfolio scenarios in that they have a longer time horizon and the results are forecasted over multiple periods for use in consolidated capital and liquidity planning. For additional information on enterprise-wide stress testing, see page 50.
Interest Rate Risk Management for Nontrading Activities
Interest rate risk represents the most significant market risk exposure to our nontrading exposures. Our overall goal is to manage interest rate risk so that movements in interest rates do not adversely affect core net interest income – managed basis. Interest rate risk is measured as the potential volatility in our core net interest income – managed basis caused by changes in market interest rates. Client-facing activities, primarily lending and deposit-taking, create interest rate sensitive positions on our balance sheet. Interest rate risk from these activities, as well as the impact of changing market conditions, is managed through our ALM activities.
Simulations are used to estimate the impact on core net interest income – managed basis using numerous interest rate scenarios, balance sheet trends and strategies. These simulations evaluate how these scenarios impact core net interest income – managed basis on short-term financial instruments, debt securities, loans, deposits, borrowings and derivative instruments. In addition, these simulations incorporate assumptions about balance sheet dynamics such as loan and deposit growth and pricing, changes in funding mix, and asset and liability repricing and maturity characteristics. These simulations do not include the impact of hedge ineffectiveness.
Management analyzes core net interest income – managed basis forecasts utilizing different rate scenarios with the baseline utilizing the forward interest rates. Management frequently updates the core net interest income – managed basis forecast for changing assumptions and differing outlooks based on economic trends and market conditions. Thus, we continually monitor our balance sheet position in an effort to maintain an acceptable level of exposure to interest rate changes.
We prepare forward-looking forecasts of core net interest income – managed basis. These baseline forecasts take into consideration expected future business growth, ALM positioning, and the direction of interest rate movements as implied by forward interest rates. We then measure and evaluate the impact that alternative interest rate scenarios have on these static baseline forecasts in order to assess interest rate sensitivity under varied conditions. The spot and 12-month forward monthly rates used in our respective baseline forecasts at December 31, 2009 and 2008 are presented in the following table.
Table 44 Forward Rates
| December 31 | ||||||||||||||||||||
| 2009 | 2008 | |||||||||||||||||||
| Federal Funds | Three- Month LIBOR | 10-Year Swap | Federal Funds | Three- Month LIBOR | 10-Year Swap | |||||||||||||||
Spot rates | 0.25 | % | 0.25 | % | 3.97 | % | 0.25 | % | 1.43 | % | 2.56 | % | ||||||||
12-month forward rates | 1.14 | 1.53 | 4.47 | 0.75 | 1.41 | 2.80 | ||||||||||||||
During 2009, the spread between the spot three-month London InterBank Offered Rate (LIBOR) and the Federal Funds target rate converged. We are typically asset sensitive to Federal Funds and Prime rates, and liability sensitive to LIBOR. Net interest income benefits as the spread between Federal Funds and LIBOR narrows.
Table 45 below reflects the pre-tax dollar impact to forecasted core net interest income – managed basis over the next twelve months from
December 31, 2009 and 2008, resulting from a 100 bp gradual parallel increase, a 100 bp gradual parallel decrease, a 100 bp gradual curve flattening (increase in short-term rates or decrease in long-term rates) and a 100 bp gradual curve steepening (decrease in short-term rates or increase in long-term rates) from the forward market curve. For further discussion of core net interest income – managed basis see page 27.
Table 45 Estimated Core Net Interest Income – Managed Basis at Risk
| (Dollars in millions) | December 31 | |||||||||||
| Curve Change | Short Rate (bps) | Long Rate (bps) | 2009 | 2008 | ||||||||
+100 bps Parallel shift | +100 | +100 | $ | 598 | $ | 144 | ||||||
-100 bps Parallel shift | -100 | -100 | (1,084 | ) | (186 | ) | ||||||
Flatteners | ||||||||||||
Short end | +100 | – | 127 | (545 | ) | |||||||
Long end | – | -100 | (616 | ) | (638 | ) | ||||||
Steepeners | ||||||||||||
Short end | -100 | – | (444 | ) | 453 | |||||||
Long end | – | +100 | 476 | 698 | ||||||||
| Bank of America 2009 | 83 |
The sensitivity analysis above assumes that we take no action in response to these rate shifts over the indicated periods. The estimated exposure is reported on a managed basis and reflects impacts that may be realized primarily in net interest income and card income on the Consolidated Statement of Income. This sensitivity analysis excludes any impact that could occur in the valuation of retained interests in the Corporation's securitizations due to changes in interest rate levels. For additional information on securitizations, see Note 8 – Securitizations to the Consolidated Financial Statements.
Our core net interest income – managed basis was asset sensitive to a parallel move in interest rates at both December 31, 2009 and 2008. Beyond what is already implied in the forward market curve, the interest rate risk position has become more exposed to declining rates since December 31, 2008 driven by the acquisition of Merrill Lynch and the actions taken to strengthen our capital and liquidity position. As part of our ALM activities, we use securities, residential mortgages, and interest rate and foreign exchange derivatives in managing interest rate sensitivity.
Securities
The securities portfolio is an integral part of our ALM position and is primarily comprised of debt securities and includes MBS and to a lesser extent corporate, municipal and other investment grade debt securities. At December 31, 2009, AFS debt securities were $301.6 billion compared to $276.9 billion at December 31, 2008. During 2009 and 2008, we purchased AFS debt securities of $185.1 billion and $184.2 billion, sold $159.4 billion and $119.8 billion, and had maturities and received paydowns of $59.9 billion and $26.1 billion. We realized $4.7 billion and $1.1 billion in gains on sales of debt securities during 2009 and 2008. In addition, we securitized $14.0 billion and $26.1 billion of residential mortgage loans into MBS which we retained during 2009 and 2008.
Accumulated OCI includes $1.5 billion in after-tax gains at December 31, 2009, including $628 million of net unrealized losses related to AFS debt securities and $2.1 billion of net unrealized gains related to AFS marketable equity securities. Total market value of the AFS debt securities was $301.6 billion at December 31, 2009 with a weighted-average duration of 4.5 years and primarily relates to our MBS portfolio.
The amount of pre-tax accumulated OCI loss related to AFS debt securities decreased by $8.3 billion during 2009 to $1.0 billion. For those securities that are in an unrealized loss position, we have the intent and ability to hold these securities to recovery and it is more likely than not that we will not be required to sell the securities prior to recovery.
We recognized $2.8 billion of other-than-temporary impairment losses through earnings on AFS debt securities during 2009 compared to $3.5 billion during 2008. We also recognized $326 million of other-than-temporary impairment losses on AFS marketable equity securities during 2009 compared to $661 million during 2008.
The impairment of AFS debt and marketable equity securities is based on a variety of factors, including the length of time and extent to which the market value has been less than cost; the financial condition of the issuer of the security and its ability to recover market value; and our intent and ability to hold the security to recovery. Based on our evaluation of the above and other relevant factors, and after consideration of the losses described in the paragraph above, we do not believe that the AFS debt and marketable equity securities that are in an unrealized loss position at December 31, 2009 are other-than-temporarily impaired.
We adopted new accounting guidance related to the recognition and presentation of other-than-temporary impairment of debt securities as of January 1, 2009. As prescribed by the new guidance, at December 31, 2009, we recognized the credit component of other-than-temporary
impairment of debt securities in earnings and the non-credit component in OCI for those securities which we do not intend to sell and it is more likely than not that we will not be required to sell the security prior to recovery. For more information on the adoption of the new guidance, see Note 1 – Summary of Significant Accounting Principles to the Consolidated Financial Statements.
Residential Mortgage Portfolio
At December 31, 2009, residential mortgages were $242.1 billion compared to $248.1 billion at December 31, 2008. We retained $26.6 billion and $27.3 billion in first mortgages originated by Home Loans & Insurance during 2009 and 2008. We securitized $14.0 billion and $26.1 billion of residential mortgage loans into MBS which we retained during 2009 and 2008. During 2009, we had no purchases of residential mortgages related to ALM activities compared to purchases of $405 million during 2008. We sold $5.9 billion of residential mortgages during 2009 of which $5.1 billion were originated residential mortgages and $771 million were previously purchased from third parties. These sales resulted in gains of $47 million. This compares to sales of $30.7 billion during 2008 which were comprised of $22.9 billion in originated residential mortgages and $7.8 billion in mortgages previously purchased from third parties. These sales resulted in gains of $496 million. We received paydowns of $42.3 billion and $26.3 billion in 2009 and 2008.
In addition to the residential mortgage portfolio, we incorporated the discontinued real estate portfolio that was acquired in connection with the Countrywide acquisition into our ALM activities. This portfolio's balance was $14.9 billion and $20.0 billion at December 31, 2009 and 2008.
Interest Rate and Foreign Exchange Derivative Contracts
Interest rate and foreign exchange derivative contracts are utilized in our ALM activities and serve as an efficient tool to manage our interest rate and foreign exchange risk. We use derivatives to hedge the variability in cash flows or changes in fair value on our balance sheet due to interest rate and foreign exchange components. For additional information on our hedging activities, see Note 4 – Derivatives to the Consolidated Financial Statements.
Our interest rate contracts are generally non-leveraged generic interest rate and foreign exchange basis swaps, options, futures and forwards. In addition, we use foreign exchange contracts, including cross-currency interest rate swaps and foreign currency forward contracts, to mitigate the foreign exchange risk associated with foreign currency-denominated assets and liabilities. Table 46 reflects the notional amounts, fair value, weighted-average receive fixed and pay fixed rates, expected maturity and estimated duration of our open ALM derivatives at December 31, 2009 and 2008. These amounts do not include derivative hedges on our net investments in consolidated foreign operations and MSRs.
Changes to the composition of our derivatives portfolio during 2009 reflect actions taken for interest rate and foreign exchange rate risk management. The decisions to reposition our derivatives portfolio are based upon the current assessment of economic and financial conditions including the interest rate environment, balance sheet composition and trends, and the relative mix of our cash and derivative positions. The notional amount of our option positions increased to $6.5 billion at December 31, 2009 from $5.0 billion at December 31, 2008. Changes in the levels of the option positions were driven by swaptions acquired as a result of the Merrill Lynch acquisition. Our interest rate swap positions (including foreign exchange contracts) were a net receive fixed position of $52.2 billion at December 31, 2009 compared to a net receive fixed position of $50.3 billion at December 31, 2008. Changes in the notional levels of our interest rate swap position were driven by the net addition of
| 84 | Bank of America 2009 |
$104.4 billion in pay fixed swaps, $83.4 billion in U.S. dollar-denominated receive fixed swaps and the net addition of $22.9 billion in foreign currency-denominated receive fixed swaps. The notional amount of our foreign exchange basis swaps was $122.8 billion and $54.6 billion at December 31, 2009 and 2008. The $42.9 billion increase in same-currency basis swap positions was primarily due to the acquisition of Merrill Lynch. Our futures and forwards net notional position, which reflects the net of long and short positions, was a long position of $10.6 billion compared to a short position of $8.8 billion at December 31, 2008.
The following table includes derivatives utilized in our ALM activities including those designated as accounting and economic hedging instruments. The fair value of net ALM contracts increased $5.8 billion to a gain of $12.3 billion at December 31, 2009 from a gain of $6.4 billion at December 31, 2008. The increase was primarily attributable to changes in the value of U.S. dollar-denominated receive fixed interest rate swaps of $1.9 billion, foreign exchange basis swaps of $1.4 billion, pay fixed interest rate swaps of $1.2 billion, foreign exchange contracts of $1.1 billion, option products of $174 million and same-currency basis swaps of $107 million. The increase was partially offset by a loss from changes in the value of futures and forward rate contracts of $66 million.
Table 46 Asset and Liability Management Interest Rate and Foreign Exchange Contracts
December 31, 2009 | ||||||||||||||||||||||||||||||||||
| Fair Value | Expected Maturity | |||||||||||||||||||||||||||||||||
| (Dollars in millions, average estimated duration in years) | Total | 2010 | 2011 | 2012 | 2013 | 2014 | Thereafter | Average Estimated Duration | ||||||||||||||||||||||||||
Receive fixed interest rate swaps (1, 2) | $ | 4,047 | 4.34 | |||||||||||||||||||||||||||||||
Notional amount | $ | 110,597 | $ | 15,212 | $ | 8 | $ | 35,454 | $ | 7,333 | $ | 8,247 | $ | 44,343 | ||||||||||||||||||||
Weighted-average fixed-rate | 3.65 | % | 1.61 | % | – | % | 2.42 | % | 4.06 | % | 3.48 | % | 5.29 | % | ||||||||||||||||||||
Pay fixed interest rate swaps (1) | 1,175 | 4.18 | ||||||||||||||||||||||||||||||||
Notional amount | $ | 104,445 | $ | 2,500 | $ | 50,810 | $ | 14,688 | $ | 806 | $ | 3,729 | $ | 31,912 | ||||||||||||||||||||
Weighted-average fixed-rate | 2.83 | % | 1.82 | % | 2.37 | % | 2.24 | % | 3.77 | % | 2.61 | % | 3.92 | % | ||||||||||||||||||||
Same-currency basis swaps (3) | 107 | |||||||||||||||||||||||||||||||||
Notional amount | $ | 42,881 | $ | 4,549 | $ | 8,593 | $ | 11,934 | $ | 5,591 | $ | 5,546 | $ | 6,668 | ||||||||||||||||||||
Foreign exchange basis swaps (2, 4, 5) | 4,633 | |||||||||||||||||||||||||||||||||
Notional amount | 122,807 | 7,958 | 10,968 | 19,862 | 18,322 | 31,853 | 33,844 | |||||||||||||||||||||||||||
Option products (6) | 174 | |||||||||||||||||||||||||||||||||
Notional amount | 6,540 | 656 | 2,031 | 1,742 | 244 | 603 | 1,264 | |||||||||||||||||||||||||||
Foreign exchange contracts (2, 5, 7) | 2,144 | |||||||||||||||||||||||||||||||||
Notional amount (8) | 103,726 | 63,158 | 3,491 | 3,977 | 6,795 | 10,585 | 15,720 | |||||||||||||||||||||||||||
Futures and forward rate contracts | (8 | ) | ||||||||||||||||||||||||||||||||
Notional amount (8) | 10,559 | 10,559 | – | – | – | – | – | |||||||||||||||||||||||||||
Net ALM contracts | $ | 12,272 | ||||||||||||||||||||||||||||||||
December 31, 2008 | ||||||||||||||||||||||||||||||||||
| Expected Maturity | ||||||||||||||||||||||||||||||||||
| (Dollars in millions, average estimated duration in years) | Fair Value | Total | 2009 | 2010 | 2011 | 2012 | 2013 | Thereafter | Average Estimated Duration | |||||||||||||||||||||||||
Receive fixed interest rate swaps (1, 2) | $ | 2,103 | 4.93 | |||||||||||||||||||||||||||||||
Notional amount | $ | 27,166 | $ | 17 | $ | 4,002 | $ | – | $ | 9,258 | $ | 773 | $ | 13,116 | ||||||||||||||||||||
Weighted-average fixed-rate | 4.08 | % | 7.35 | % | 1.89 | % | – | % | 3.31 | % | 4.53 | % | 5.27 | % | ||||||||||||||||||||
Foreign exchange basis swaps (2, 4, 5) | 3,196 | |||||||||||||||||||||||||||||||||
Notional amount | $ | 54,569 | $ | 4,578 | $ | 6,192 | $ | 3,986 | $ | 8,916 | $ | 4,819 | $ | 26,078 | ||||||||||||||||||||
Option products (6) | – | |||||||||||||||||||||||||||||||||
Notional amount | 5,025 | 5,000 | 22 | – | – | – | 3 | |||||||||||||||||||||||||||
Foreign exchange contracts (2, 5, 7) | 1,070 | |||||||||||||||||||||||||||||||||
Notional amount (8) | 23,063 | 2,313 | 4,021 | 1,116 | 1,535 | 486 | 13,592 | |||||||||||||||||||||||||||
Futures and forward rate contracts | 58 | |||||||||||||||||||||||||||||||||
Notional amount (8) | (8,793 | ) | (8,793 | ) | – | – | – | – | – | |||||||||||||||||||||||||
Net ALM contracts | $ | 6,427 | ||||||||||||||||||||||||||||||||
| (1) | At December 31, 2009, the receive fixed interest rate swap notional that represented forward starting swaps and will not be effective until their respective contractual start dates was $2.5 billion and the forward starting pay fixed swap positions was $76.8 billion. At December 31, 2008, there were no forward starting pay or receive fixed swap positions. |
| (2) | Does not include basis adjustments on fixed-rate debt issued by the Corporation and hedged under fair value hedges pursuant to derivatives designated as hedging instruments that substantially offset the fair values of these derivatives. |
| (3) | At December 31, 2009, same-currency basis swaps consist of $42.9 billion in both foreign currency and U.S. dollar-denominated basis swaps in which both sides of the swap are in the same currency. There were no same-currency basis swaps at December 31, 2008. |
| (4) | Foreign exchange basis swaps consist of cross-currency variable interest rate swaps used separately or in conjunction with receive fixed interest rate swaps. |
| (5) | Does not include foreign currency translation adjustments on certain foreign debt issued by the Corporation which substantially offset the fair values of these derivatives. |
| (6) | Option products of $6.5 billion at December 31, 2009 were comprised of $177 million in purchased caps and $6.3 billion in swaptions. Option products of $5.0 billion at December 31, 2008 are comprised completely of purchased caps. |
| (7) | Foreign exchange contracts include foreign currency-denominated and cross-currency receive fixed interest rate swaps as well as foreign currency forward rate contracts. Total notional was comprised of $46.0 billion in foreign currency-denominated and cross-currency receive fixed swaps and $57.7 billion in foreign currency forward rate contracts at December 31, 2009, and $23.1 billion in foreign currency-denominated and cross-currency receive fixed swaps and $78 million in foreign currency forward rate contracts at December 31, 2008. |
| (8) | Reflects the net of long and short positions. |
| Bank of America 2009 | 85 |
We use interest rate derivative instruments to hedge the variability in the cash flows of our assets and liabilities, and other forecasted transactions (cash flow hedges). From time to time, we also utilize equity-indexed derivatives accounted for as derivatives designated as cash flow hedges to minimize exposure to price fluctuations on the forecasted purchase or sale of certain equity investments. The net losses on both open and terminated derivative instruments recorded in accumulated OCI, net-of-tax, were $2.5 billion and $3.5 billion at December 31, 2009 and 2008. These net losses are expected to be reclassified into earnings in the same period when the hedged cash flows affect earnings and will decrease income or increase expense on the respective hedged cash flows. Assuming no change in open cash flow derivative hedge positions and no changes to prices or interest rates beyond what is implied in forward yield curves at December 31, 2009, the pre-tax net losses are expected to be reclassified into earnings as follows: $937 million, or 23 percent within the next year, 66 percent within five years, and 88 percent within 10 years, with the remaining 12 percent thereafter. For more information on derivatives designated as cash flow hedges, see Note 4 – Derivatives to the Consolidated Financial Statements.
In addition to the derivatives disclosed in Table 46 we hedge our net investment in consolidated foreign operations determined to have functional currencies other than the U.S. dollar using forward foreign exchange contracts that typically settle in 90 days, cross currency basis swaps and by issuing foreign currency-denominated debt. We recorded after-tax losses from derivatives and foreign currency-denominated debt in accumulated OCI associated with net investment hedges which was offset by after-tax unrealized gains in accumulated OCI associated for changes in the value of our net investments in consolidated foreign entities at December 31, 2009.
Mortgage Banking Risk Management
We originate, fund and service mortgage loans, which subject us to credit, liquidity and interest rate risks, among others. We determine whether loans will be held for investment or held for sale at the time of commitment and manage credit and liquidity risks by selling or securitizing a portion of the loans we originate.
Interest rate and market risk can be substantial in the mortgage business. Fluctuations in interest rates drive consumer demand for new mortgages and the level of refinancing activity, which in turn affects total origination and service fee income. Typically, a decline in mortgage interest rates will lead to an increase in mortgage originations and fees and a decrease in the value of the MSRs driven by higher prepayment expectations. Hedging the various sources of interest rate risk in mortgage banking is a complex process that requires complex modeling and ongoing monitoring. IRLCs and the related residential first mortgage LHFS are subject to interest rate risk between the date of the IRLC and the date the loans are sold to the secondary market. To hedge interest rate risk, we utilize forward loan sale commitments and other derivative instruments including purchased options. These instruments are used as economic hedges of IRLCs and residential first mortgage LHFS. At December 31, 2009 and 2008, the notional amount of derivatives economically hedging the IRLCs and residential first mortgage LHFS was $161.4 billion and $97.2 billion.
MSRs are nonfinancial assets created when the underlying mortgage loan is sold to investors and we retain the right to service the loan. We use certain derivatives such as interest rate options, interest rate swaps, forward settlement contracts, euro dollar futures, as well as mortgage-backed and U.S. Treasury securities as economic hedges of MSRs. The notional amounts of the derivative contracts and other securities designated as economic hedges of MSRs at December 31, 2009 were $1.3 trillion and $67.6 billion, for a total notional amount of $1.4 trillion. At
December 31, 2008, the notional amounts of the derivative contracts and other securities designated as economic hedges of MSRs were $1.0 trillion and $87.5 billion, for a total notional amount of $1.1 trillion. In 2009, we recorded losses in mortgage banking income of $3.8 billion related to the change in fair value of these economic hedges as compared to gains of $8.6 billion for 2008. For additional information on MSRs, see Note 22 – Mortgage Servicing Rights to the Consolidated Financial Statements and for more information on mortgage banking income, see the Home Loans & Insurance discussion beginning on page 31.
Compliance Risk Management
Compliance risk is the risk posed by the failure to manage regulatory, legal and ethical issues that could result in monetary damages, losses or harm to our reputation or image. The Seven Elements of a Compliance Program ® provides the framework for the compliance programs that are consistently applied across the enterprise to manage compliance risk. This framework includes a common approach to commitment and accountability, policies and procedures, controls and supervision, monitoring, regulatory change management, education and awareness and reporting.
We approach compliance risk management on an enterprise and line of business level. The Operational Risk Committee provides oversight of significant compliance risk issues. Within Global Risk Management, Global Compliance Risk Management develops and guides the strategies, policies and practices for assessing and managing compliance risks across the organization. Through education and communication efforts, a culture of compliance is emphasized across the organization. We also mitigate compliance risk through a broad-based approach to process management and improvement.
The lines of business are responsible for all the risks within the business line, including compliance risks. Compliance Risk executives, working in conjunction with senior line of business executives, have developed key tools to address and measure compliance risks and to ensure compliance with laws and regulations in each line of business.
Operational Risk Management
Operational risk is the risk of loss resulting from inadequate or failed internal processes, people, systems or external events. Successful operational risk management is particularly important to diversified financial services companies because of the nature, volume and complexity of the financial services business. Under the Basel II Rules, an operational loss event is an event that results in loss and is associated with any of the following seven operational loss event categories: internal fraud; external fraud; employment practices and workplace safety; clients, products and business practices; damage to physical assets; business disruption and system failures; and execution, delivery and process management. Losses in these categories are captured and mapped to four overall risk categories: people, process, systems and external events. Specific examples of loss events include robberies, internal fraud, processing errors and physical losses from natural disasters.
We approach operational risk management from two perspectives: the enterprise and line of business. The Operational Risk Committee, which reports to the Audit Committee of the Board, is responsible for operational risk policies, measurement and management, and control processes. Within Global Risk Management, Global Operational Risk Management develops and guides the strategies, policies, practices, controls and monitoring tools for assessing and managing operational risks across the organization.
For selected risks, we use specialized support groups, such as Enterprise Information Management and Supply Chain Management, to
| 86 | Bank of America 2009 |
develop risk management practices, such as an information security program and a supplier program to ensure that suppliers adopt appropriate policies and procedures when performing work on our behalf. These specialized groups also assist the lines of business in the development and implementation of risk management practices specific to the needs of the individual businesses. These groups also work with line of business executives and risk executives to develop and guide appropriate strategies, policies, practices, controls and monitoring tools for each line of business.
Additionally, where appropriate, we purchase insurance policies to mitigate the impact of operational losses when and if they occur. These insurance policies are explicitly incorporated in the structural features of our operational risk evaluation. As insurance recoveries, especially given recent market events, are subject to legal and financial uncertainty, the inclusion of these insurance policies are subject to reductions in the mitigating benefits expected within our operational risk evaluation.
The lines of business are responsible for all the risks within the business line, including operational risks. Operational risk executives, working in conjunction with senior line of business executives, have developed key tools to help identify, measure, mitigate and monitor risk in each line of business. Examples of these include personnel management practices, data reconciliation processes, fraud management units, transaction processing monitoring and analysis, business recovery planning and new product introduction processes. In addition, the lines of business are responsible for monitoring adherence to corporate practices. Line of business management uses a self-assessment process, which helps to identify and evaluate the status of risk and control issues, including mitigation plans, as appropriate. The goal of the self-assessment process is to periodically assess changing market and business conditions, to evaluate key risks impacting each line of business and assess the controls in place to mitigate the risks. In addition to information gathered from the self-assessment process, key operational risk indicators have been developed and are used to help identify trends and issues on both an enterprise and a line of business level.
ASF Framework
In December 2007, the American Securitization Forum (ASF) issued the Streamlined Foreclosure and Loss Avoidance Framework for Securitized Adjustable Rate Mortgage Loans (the ASF Framework). The ASF Framework was developed to address a large number of subprime loans that are at risk of default when the loans reset from their initial fixed interest rates to variable rates. The objective of the framework is to provide uniform guidelines for evaluating a large number of loans for refinancing in an efficient manner while complying with the relevant tax regulations and off-balance sheet accounting standards for loan securitizations. The ASF Framework targets loans that were originated between January 1, 2005 and July 31, 2007, have an initial fixed interest rate period of 36 months or less and which are scheduled for their first interest rate reset between January 1, 2008 and July 31, 2010.
The ASF Framework categorizes the targeted loans into three segments. Segment 1 includes loans where the borrower is likely to be able to refinance into any available mortgage product. Segment 2 includes loans where the borrower is current but is unlikely to be able to refinance into any readily available mortgage product. Segment 3 includes loans where the borrower is not current. If certain criteria are met, ASF Framework loans in Segment 2 are eligible for fast-track modification under which the interest rate will be kept at the existing initial rate, generally for five years following the interest rate reset date. Upon evaluation, if targeted loans do not meet specific criteria to be eligible for one of the three segments, they are categorized as other loans, as shown in the table below. These criteria include the occupancy status of the borrower, structure and other terms of the loan. In January 2008, the SEC's Office of the Chief Accountant issued a letter addressing the accounting issues relating to the ASF Framework. The letter concluded that the SEC would not object to continuing off-balance sheet accounting treatment for Segment 2 loans modified pursuant to the ASF Framework.
For those current loans that are accounted for off-balance sheet that are modified, but not as part of the ASF Framework, the servicer must perform on an individual basis, an analysis of the borrower and the loan to demonstrate it is probable that the borrower will not meet the repayment obligation in the near term. Such analysis provides sufficient evidence to demonstrate that the loan is in imminent or reasonably foreseeable default. The SEC's Office of the Chief Accountant issued a letter in July 2007 stating that it would not object to continuing off-balance sheet accounting treatment for these loans.
Prior to the acquisition of Countrywide on July 1, 2008, Countrywide began making fast-track loan modifications under Segment 2 of the ASF Framework in June 2008 and the off-balance sheet accounting treatment of QSPEs that hold those loans was not affected. In addition, other workout activities relating to subprime ARMs including modifications (e.g., interest rate reductions and capitalization of interest) and repayment plans were also made. These initiatives have continued subsequent to the acquisition in an effort to work with all of our customers that are eligible and affected by loans that meet the requisite criteria. These foreclosure prevention efforts will reduce foreclosures and the related losses providing a solution for customers and protecting investors.
As of December 31, 2009, the principal balance of beneficial interests issued by the QSPEs that hold subprime ARMs totaled $70.5 billion and the fair value of beneficial interests related to those QSPEs held by the Corporation totaled $9 million. The following table presents a summary of loans in QSPEs that hold subprime ARMs as of December 31, 2009 as well as workout and other activity for the subprime loans by ASF categorization for 2009. Prior to the acquisition of Countrywide on July 1, 2008, we did not originate or service significant subprime residential mortgage loans, nor did we hold a significant amount of beneficial interests in QSPEs of subprime residential mortgage loans.
Table 47 QSPE Loans Subject to ASF Framework Evaluation (1)
| December 31, 2009 | Activity During the Year Ended December 31, 2009 | |||||||||||||||||||
| (Dollars in millions) | Balance | Percent of Total | Payoffs | Fast-track Modifications | Other Workout Activities | Foreclosures | ||||||||||||||
Segment 1 | $ | 4,875 | 6.9 | % | $ | 443 | $ | – | $ | 675 | $ | 78 | ||||||||
Segment 2 | 8,114 | 11.5 | 142 | 27 | 1,368 | 155 | ||||||||||||||
Segment 3 | 17,817 | 25.3 | 489 | 6 | 3,413 | 3,150 | ||||||||||||||
Total subprime ARMs | 30,806 | 43.7 | 1,074 | 33 | 5,456 | 3,383 | ||||||||||||||
Other loans | 37,891 | 53.7 | 1,228 | 174 | 4,355 | 2,126 | ||||||||||||||
Foreclosed properties | 1,838 | 2.6 | n/a | n/a | n/a | n/a | ||||||||||||||
Total | $ | 70,535 | 100.0 | % | $ | 2,302 | $ | 207 | $ | 9,811 | $ | 5,509 | ||||||||
| (1) | Represents loans that were acquired with the acquisitions of Countrywide on July 1, 2008 and Merrill Lynch on January 1, 2009 that meet the requirements of the ASF Framework. |
n/a = not applicable
| Bank of America 2009 | 87 |
Complex Accounting Estimates
Our significant accounting principles, as described in Note 1 – Summary of Significant Accounting Principles to the Consolidated Financial Statements, are essential in understanding the MD&A. Many of our significant accounting principles require complex judgments to estimate the values of assets and liabilities. We have procedures and processes in place to facilitate making these judgments.
The more judgmental estimates are summarized below. We have identified and described the development of the variables most important in the estimation processes that, with the exception of accrued taxes, involve mathematical models to derive the estimates. In many cases, there are numerous alternative judgments that could be used in the process of determining the inputs to the models. Where alternatives exist, we have used the factors that we believe represent the most reasonable value in developing the inputs. Actual performance that differs from our estimates of the key variables could impact net income. Separate from the possible future impact to net income from input and model variables, the value of our lending portfolio and market sensitive assets and liabilities may change subsequent to the balance sheet date, often significantly, due to the nature and magnitude of future credit and market conditions. Such credit and market conditions may change quickly and in unforeseen ways and the resulting volatility could have a significant, negative effect on future operating results. These fluctuations would not be indicative of deficiencies in our models or inputs.
Allowance for Credit Losses
The allowance for credit losses, which includes the allowance for loan and lease losses and the reserve for unfunded lending commitments, represents management's estimate of probable losses inherent in the Corporation's lending activities excluding those accounted for under the fair value option. Changes to the allowance for credit losses are reported in the Consolidated Statement of Income in the provision for credit losses. Our process for determining the allowance for credit losses is discussed in the Credit Risk Management section beginning on page 54 and Note 1 – Summary of Significant Accounting Principles to the Consolidated Financial Statements. Due to the variability in the drivers of the assumptions used in this process, estimates of the portfolio's inherent risks and overall collectability change with changes in the economy, individual industries, countries and borrowers' or counterparties' ability and willingness to repay their obligations. The degree to which any particular assumption affects the allowance for credit losses depends on the severity of the change and its relationship to the other assumptions.
Key judgments used in determining the allowance for credit losses include: (i) risk ratings for pools of commercial loans and leases, (ii) market and collateral values and discount rates for individually evaluated loans, (iii) product type classifications for consumer and commercial loans and leases, (iv) loss rates used for consumer and commercial loans and leases, (v) adjustments made to address current events and conditions, (vi) considerations regarding domestic and global economic uncertainty, and (vii) overall credit conditions.
Our allowance for loan and lease losses is sensitive to the risk ratings assigned to commercial loans and leases. Assuming a downgrade of one level in the internal risk rating for commercial loans and leases, except loans and leases already risk-rated Doubtful as defined by regulatory authorities, the allowance for loan and lease losses would increase by approximately $4.9 billion at December 31, 2009. The allowance for loan and lease losses as a percentage of total loans and leases at December 31, 2009 was 4.16 percent and this hypothetical increase in the allowance would raise the ratio to approximately 4.70 percent. Our allowance for loan and lease losses is also sensitive to the loss rates used for the consumer and commercial portfolios. A 10 percent increase
in the loss rates used on the consumer and commercial loan and lease portfolios covered by the allowance would increase the allowance for loan and lease losses at December 31, 2009 by approximately $2.9 billion of which $2.6 billion would relate to consumer and $266 million to commercial.
Purchased impaired loans are initially recorded at fair value. Applicable accounting guidance prohibits carry-over or creation of valuation allowances in the initial accounting. However, subsequent decreases in the expected principal cash flows from the date of acquisition result in a charge to the provision for credit losses and a corresponding increase to the allowance for loan and lease losses. Our purchased impaired portfolio is also subjected to stress scenarios to evaluate the potential impact given certain events. A one percent decrease in the expected principal cash flows could result in approximately a $200 million impairment of the portfolio of which approximately $100 million would relate to our discontinued real estate portfolio.
These sensitivity analyses do not represent management's expectations of the deterioration in risk ratings or the increases in loss rates but are provided as hypothetical scenarios to assess the sensitivity of the allowance for loan and lease losses to changes in key inputs. We believe the risk ratings and loss severities currently in use are appropriate and that the probability of a downgrade of one level of the internal risk ratings for commercial loans and leases within a short period of time is remote.
The process of determining the level of the allowance for credit losses requires a high degree of judgment. It is possible that others, given the same information, may at any point in time reach different reasonable conclusions.
Mortgage Servicing Rights
MSRs are nonfinancial assets that are created when a mortgage loan is sold and we retain the right to service the loan. We account for consumer MSRs at fair value with changes in fair value recorded in the Consolidated Statement of Income in mortgage banking income. Commercial-related and residential reverse mortgage MSRs are accounted for using the amortization method (i.e., lower of cost or market) with impairment recognized as a reduction of mortgage banking income. At December 31, 2009, our total MSR balance was $19.8 billion.
We determine the fair value of our consumer MSRs using a valuation model that calculates the present value of estimated future net servicing income. The model incorporates key economic assumptions including estimates of prepayment rates and resultant weighted average lives of the MSRs, and the option-adjusted spread (OAS) levels. These variables can, and generally do change from quarter to quarter as market conditions and projected interest rates change. These assumptions are subjective in nature and changes in these assumptions could materially affect our net income. For example, decreasing the prepayment rate assumption used in the valuation of our consumer MSRs by 10 percent while keeping all other assumptions unchanged could have resulted in an estimated increase of $895 million in mortgage banking income at December 31, 2009.
We manage potential changes in the fair value of MSRs through a comprehensive risk management program. The intent is to mitigate the effects of changes in the fair value of MSRs through the use of risk management instruments. To reduce the sensitivity of earnings to interest rate and market value fluctuations, securities as well as certain derivatives such as options and interest rate swaps may be used as economic hedges of the MSRs, but are not designated as accounting hedges. These instruments are carried at fair value with changes in fair value recognized in mortgage banking income. The impact provided above does not reflect any hedge strategies that may be undertaken to mitigate such risk.
| 88 | Bank of America 2009 |
For additional information on MSRs, including the sensitivity of weighted average lives and the fair value of MSRs to changes in modeled assumptions, see Note 22 – Mortgage Servicing Rights to the Consolidated Financial Statements.
Fair Value of Financial Instruments
We determine the fair values of financial instruments based on the fair value hierarchy under applicable accounting guidance which requires an entity to maximize the use of observable inputs and minimize the use of unobservable inputs when measuring fair value. Applicable accounting guidance establishes three levels of inputs used to measure fair value. We carry trading account assets and liabilities, derivative assets and liabilities, AFS debt and marketable equity securities, certain MSRs, and certain other assets at fair value. Also, we account for certain corporate loans and loan commitments, LHFS, commercial paper and other short-term borrowings, securities financing agreements, asset-backed secured financings, long-term deposits, and long-term debt under the fair value option. For more information, see Note 20 – Fair Value Measurements to the Consolidated Financial Statements.
The fair values of assets and liabilities include adjustments for market liquidity, credit quality and other deal specific factors, where appropriate. Valuations of products using models or other techniques are sensitive to assumptions used for the significant inputs. Where market data is available, the inputs used for valuation reflect that information as of our valuation date. Inputs to valuation models are considered unobservable if they are supported by little or no market activity. In periods of extreme volatility, lessened liquidity or in illiquid markets, there may be more variability in market pricing or a lack of market data to use in the valuation process. To ensure the prudent application of estimates and management judgment in determining the fair value of assets and liabilities, we have in place various processes and controls that include: a model validation policy that requires review and approval of quantitative models used for deal pricing; financial statement fair value determination and risk quantification; a trading product valuation policy that requires verification of all traded product valuations; and a periodic review and substantiation of daily profit and loss reporting for all traded products. Primarily through validation controls, we utilize both broker and pricing service inputs which can and do include both market-observable and internally-modeled values and/or value inputs. Our reliance on this information is tempered by the knowledge of how the broker and/or pricing service develops its data with a higher degree of reliance applied to those that are more directly observable and lesser reliance applied to those developed through their own internal modeling. Similarly, broker quotes that are executable are given a higher level of reliance than indicative broker quotes, which are not executable. These processes and controls are performed independently of the business.
Trading account assets and liabilities are carried at fair value based primarily on actively traded markets where prices are from either direct market quotes or observed transactions. Liquidity is a significant factor in the determination of the fair value of trading account assets and liabilities. Market price quotes may not be readily available for some positions, or positions within a market sector where trading activity has slowed significantly or ceased. Situations of illiquidity generally are triggered by market perception of credit uncertainty regarding a single company or a specific market sector. In these instances, fair value is determined based on limited available market information and other factors, principally from reviewing the issuer's financial statements and changes in credit ratings made by one or more of the ratings agencies.
Trading account profits (losses), which represent the net amount earned from our trading positions, can be volatile and are largely driven by general market conditions and customer demand. Trading account
profits (losses) are dependent on the volume and type of transactions, the level of risk assumed, and the volatility of price and rate movements at any given time within the ever-changing market environment. To evaluate risk in our trading activities, we focus on the actual and potential volatility of individual positions as well as portfolios. At a portfolio and corporate level, we use trading limits, stress testing and tools such as VAR modeling, which estimates a potential daily loss that we do not expect to exceed with a specified confidence level, to measure and manage market risk. For more information on VAR, see Trading Risk Management beginning on page 80.
The fair values of derivative assets and liabilities traded in the over-the-counter market are determined using quantitative models that require the use of multiple market inputs including interest rates, prices, and indices to generate continuous yield or pricing curves and volatility factors, which are used to value the positions. The majority of market inputs are actively quoted and can be validated through external sources including brokers, market transactions and third-party pricing services. Estimation risk is greater for derivative asset and liability positions that are either option-based or have longer maturity dates where observable market inputs are less readily available or are unobservable, in which case quantitative-based extrapolations of rate, price or index scenarios are used in determining fair values. The Corporation incorporates within its fair value measurements of over-the-counter derivatives the net credit differential between the counterparty credit risk and our own credit risk. The value of the credit differential is determined by reference to existing direct market reference costs of credit, or where direct references are not available a proxy is applied consistent with direct references for other counterparties that are similar in credit risk. An estimate of severity of loss is also used in the determination of fair value, primarily based on historical experience adjusted for any more recent name specific expectations.
Level 3 Assets and Liabilities
Financial assets and liabilities whose values are based on prices or valuation techniques that require inputs that are both unobservable and are significant to the overall fair value measurement are classified as Level 3 under the fair value hierarchy established in applicable accounting guidance. The Level 3 financial assets and liabilities include private equity investments, consumer MSRs, ABS, highly structured, complex or long-dated derivative contracts, structured notes and certain CDOs, for which there is not an active market for identical assets from which to determine fair value or where sufficient, current market information about similar assets to use as observable, corroborated data for all significant inputs into a valuation model are not available. In these cases, the fair values of these Level 3 financial assets and liabilities are determined using pricing models, discounted cash flow methodologies, a net asset value approach for certain structured securities, or similar techniques, for which the determination of fair value requires significant management judgment or estimation. In 2009, there were no changes to the quantitative models, or uses of such models, that resulted in a material adjustment to the Consolidated Statement of Income.
Level 3 assets, before the impact of counterparty netting related to our derivative positions, were $103.6 billion and $59.4 billion at December 31, 2009 and 2008 and represented approximately 14 percent and 10 percent of assets measured at fair value (or five percent and three percent of total assets). Level 3 liabilities, before the impact of counterparty netting related to our derivative positions, were $21.8 billion and $8.0 billion as of December 31, 2009 and 2008 and represented approximately 10 percent and nine percent of the liabilities measured at fair value (or approximately one percent of total liabilities). At December 31, 2009, $21.1 billion, or 12 percent, of trading account assets were
| Bank of America 2009 | 89 |
classified as Level 3 assets, and $396 million or less than one percent of trading account liabilities were classified as Level 3 liabilities. At December 31, 2009, $23.0 billion, or 29 percent, of derivative assets were classified as Level 3 assets, and $15.2 billion and 35 percent of derivative liabilities were classified as Level 3 liabilities. See Note 20 – Fair Value Measurements to the Consolidated Financial Statements for a tabular presentation of the fair values of Level 1, 2 and 3 assets and liabilities at December 31, 2009 and 2008 and detail of Level 3 activity for the years ended December 31, 2009, 2008 and 2007.
In 2009, we recognized gains of $10.6 billion on Level 3 assets and liabilities which were primarily gains on net derivatives and consumer MSRs partially offset by losses on long-term debt. We also recorded unrealized gains of $3.3 billion (pre-tax) in accumulated OCI on Level 3 assets and liabilities during the year, which were driven primarily by improved market-observability as liquidity returned to the market related to non-agency MBS. The gains in net derivatives were driven by high origination volumes of held-for-sale mortgage loans and by positive valuation adjustments on our IRLCs. The increase in the consumer MSR balance benefited from changes in the forward interest rate curve. Losses of $2.3 billion on long-term debt were driven by the impact of market movements and from improved credit spreads on certain Merrill Lynch structured notes.
Level 3 financial instruments, such as our consumer MSRs, may be economically hedged with derivatives not classified as Level 3, therefore, gains or losses associated with Level 3 financial instruments may be offset by gains or losses associated with financial instruments classified in other levels of the fair value hierarchy. The gains and losses recorded in earnings did not have a significant impact on our liquidity or capital resources.
A review of fair value hierarchy classifications is conducted on a quarterly basis. Transfers into or out of Level 3 are made if the significant inputs used in the financial models measuring the fair values of the assets and liabilities became unobservable or observable, respectively, in the current marketplace. These transfers are effective as of the beginning of the quarter. In 2009, several transfers were made into or out of Level 3. Long-term debt of $4.3 billion was transferred out of Level 3 due to the decreased significance of unobservable inputs on certain structured notes. Net derivative assets of $5.7 billion were transferred into Level 3 due to the impact of significant unobservable inputs in the overall valuation of certain derivative products in the marketplace.
Global Principal Investments
Global Principal Investments is included within Equity Investments in All Other on page 41. Global Principal Investments is comprised of a diversified portfolio of investments in privately-held and publicly-traded companies at all stages of their life cycle. These investments are made either directly in a company or held through a fund. Some of these companies may need access to additional cash to support their long-term business models. Market conditions and company performance may impact whether funding is available from private investors or the capital markets.
At December 31, 2009, this portfolio totaled $14.1 billion including $12.4 billion, of non-public investments. Investments with active market quotes are carried at estimated fair value; however, the majority of our investments do not have publicly available price quotes and, therefore, the fair value is unobservable. Valuation of these investments requires significant management judgment. We initially value these investments at transaction price and adjust valuations when evidence is available to support such adjustments. Such evidence includes transactions in similar instruments, market comparables, completed or pending third-party transactions in the underlying investment or comparable entities, subsequent rounds of financing, recapitalizations and other transactions across the capital structure, and changes in financial ratios or cash flows. Invest -
ments are carried at estimated fair value with changes recorded in equity investment income in the Consolidated Statement of Income.
Accrued Income Taxes
Accrued income taxes, reported as a component of accrued expenses and other liabilities on our Consolidated Balance Sheet, represents the net amount of current income taxes we expect to pay to or receive from various taxing jurisdictions attributable to our operations to date. We currently file income tax returns in more than 100 jurisdictions and consider many factors including statutory, judicial and regulatory guidance , in estimating the appropriate accrued income taxes for each jurisdiction.
In applying the applicable accounting guidance, we monitor relevant tax authorities and change our estimate of accrued income taxes due to changes in income tax laws and their interpretation by the courts and regulatory authorities. These revisions of our estimate of accrued income taxes, which also may result from our income tax planning and from the resolution of income tax controversies, may be material to our operating results for any given period.
Goodwill and Intangible Assets
The nature of and accounting for goodwill and intangible assets are discussed in detail in Note 1 – Summary of Significant Accounting Principles and Note 10 – Goodwill and Intangible Assets to the Consolidated Financial Statements. Goodwill is reviewed for potential impairment at the reporting unit level on an annual basis which for the Corporation is performed as of June 30 or in interim periods if events or circumstances indicate a potential impairment. A reporting unit is a business segment or one level below. As reporting units are determined after an acquisition or evolve with changes in business strategy, goodwill is assigned and it no longer retains its association with a particular acquisition. All of the revenue streams and related activities of a reporting unit, whether acquired or organic, are available to support the value of the goodwill.
The Corporation's common stock price, consistent with common stock prices in the financial services industry, has been more volatile over the past 18 months primarily due to the deterioration in the financial markets in 2008 as the overall economy moved into a recession, followed in 2009 by stabilization and improvement in some sectors of the economy. During this period, our market capitalization remained below our recorded book value. The fair value of all reporting units as of the June 30, 2009 annual impairment test was estimated to be $262.8 billion and the common stock market capitalization of the Corporation as of that date was $114.2 billion ($149.6 billion at December 31, 2009, including CES). The implied control premium or the amount a buyer is willing to pay over the current market price of a publicly traded stock to obtain control, was 52 percent after taking into consideration the outstanding preferred stock of $58.7 billion as of June 30, 2009. As none of our reporting units are publicly traded, individual reporting unit fair value determinations are not directly correlated to the Corporation's stock price. Although we believe it is reasonable to conclude that market capitalization could be an indicator of fair value over time, we do not believe that recent fluctuations in our market capitalization as a result of the market dislocation are reflective of actual cash flows and the fair value of our individual reporting units.
Estimating the fair value of reporting units and the assets, liabilities and intangible assets of a reporting unit is a subjective process that involves the use of estimates and judgments, particularly related to cash flows, the appropriate discount rates and an applicable control premium. The fair values of the reporting units were determined using a combination of valuation techniques consistent with the market approach and the income approach and included the use of independent valuation specialists. Measurement of the fair values of the assets, liabilities and intangibles of a reporting unit was consistent with the requirements of the
| 90 | Bank of America 2009 |
fair value measurements accounting guidance and includes the use of estimates and judgments. The fair values of the intangible assets were determined using the income approach.
The market approach we used results in an estimate of the fair value of the individual reporting units by incorporating any combination of the tangible capital, book capital and earnings multiples from comparable publicly traded companies in similar industries to that of the reporting unit. The relative weight assigned to these multiples varies among the reporting units based upon qualitative and quantitative characteristics, primarily the size and relative profitability of the respective reporting unit as compared to the comparable publicly traded companies. Since the fair values determined under the market approach are representative of a noncontrolling interest, a control premium was added to arrive at the fair values of the reporting units on a controlling basis.
For purposes of the income approach, discounted cash flows were calculated by taking the net present value of estimated cash flows using a combination of historical results, estimated future cash flows and an appropriate terminal value. Our discounted cash flow analysis employs a capital asset pricing model in estimating the discount rate (i.e., cost of equity financing) for each reporting unit. The inputs to this model include the risk-free rate of return; beta, a measure of the level of non-diversifiable risk associated with comparable companies for each specific reporting unit; market equity risk premium and in certain cases an unsystematic (company-specific) risk factor. The unsystematic risk factor is the input that specifically addresses uncertainty related to our projections of earnings and growth, including the uncertainty related to loss expectations. We utilized discount rates that we believe adequately reflect the risk and uncertainty in the financial markets generally and specifically in our internally developed forecasts. Expected rates of equity returns were estimated based on historical market returns and risk/return rates for similar industries to that of the reporting unit. We use our internal forecasts to estimate future cash flows and actual results may differ from forecasted results.
We perform our annual goodwill impairment test for all reporting units as of June 30 each year. In performing the first step of the annual impairment analysis, we compared the fair value of each reporting unit to its current carrying amount, including goodwill. To determine fair value, we used a combination of a market approach and an income approach. Under the market approach, we compared earnings and equity multiples of the individual reporting units to multiples of public companies comparable to the individual reporting units. The control premiums used in the June 30, 2009 annual impairment test ranged from 25 percent to 35 percent. Under the income approach, we updated our assumptions to reflect the current market environment. The discount rates used in the June 30, 2009 annual impairment test ranged from 11 percent to 20 percent depending on the relative risk of a reporting unit. Growth rates developed by management for each reporting unit and/or individual revenue and expense items ranged from two percent to 10 percent. For certain revenue and expense items that have been significantly affected by the current economic environment, management developed separate long-term forecasts.
Based on the results of step one of the impairment test, we determined that the carrying amount of the Home Loans & Insurance and Global Card Services reporting units, including goodwill, exceeded their fair value. The carrying amount of the reporting unit, fair value of the reporting unit and goodwill for Home Loans & Insurance were $16.5 billion, $14.3 billion and $4.8 billion, respectively, and for Global Card Services were $41.4 billion, $41.3 billion and $22.3 billion, respectively. Because the carrying amount exceeded the fair value, we performed step two of the goodwill impairment test for these reporting units as of June 30, 2009. For all other reporting units, step two was not required as
their fair value exceeded their carrying amount in step one indicating there was no impairment. In step two, we compared the implied fair value of each reporting unit's goodwill with the carrying amount of that goodwill. We determined the implied fair value of goodwill for a reporting unit by assigning the fair value of the reporting unit to all of the assets and liabilities of that unit, including any unrecognized intangible assets, as if the reporting unit had been acquired in a business combination. The excess of the fair value of the reporting unit over the amounts assigned to its assets and liabilities is the implied fair value of goodwill. Based on the results of step two of the impairment test as of June 30, 2009, we determined that goodwill was not impaired in the Home Loans & Insurance or Global Card Services reporting units.
In estimating the fair value of the reporting units in step one of the goodwill impairment analysis, we note that the fair values can be sensitive to changes in the projected cash flows and assumptions. In some instances, minor changes in the assumptions could impact whether the fair value of a reporting unit is greater than its carrying amount. Furthermore, a prolonged decrease or increase in a particular assumption could eventually lead to the fair value of a reporting unit being less than its carrying amount. Also, to the extent step two of the goodwill analysis is required, changes in the estimated fair values of the individual assets and liabilities may impact other estimates of fair value for assets or liabilities and result in a different amount of implied goodwill, and ultimately the amount of goodwill impairment, if any.
Given the results of our annual impairment test and due to continued stress on Home Loans & Insurance and Global Card Services as a result of current market conditions, we concluded that we should perform an additional impairment analysis for these two reporting units as of December 31, 2009. In step one of the goodwill impairment analysis, the fair value of Home Loans & Insurance was estimated with equal weighting assigned to the market approach and the income approach. The fair value of Global Card Services was estimated under the income approach. Under the market approach valuation for Home Loans & Insurance , significant assumptions were consistent with the assumptions used in our annual impairment tests as of June 30, 2009 and included market multiples and a control premium. In the Global Card Services valuation under the income approach, the significant assumptions included the discount rate, terminal value, expected loss rates and expected new account growth. Consistent with the June 30, 2009 annual impairment test, the carrying amount exceeded the fair value for Home Loans & Insurance requiring that we perform step two. Although Global Card Services passed step one of the goodwill impairment analysis, to further substantiate the value of the goodwill balance, we also performed the step two analysis for this reporting unit. The carrying amount of the reporting unit, fair value of the reporting unit and goodwill for Home Loans & Insurance were $27.3 billion, $20.3 billion and $4.8 billion, respectively, and for Global Card Services were $43.4 billion, $47.3 billion and $22.3 billion, respectively. The estimated fair value as a percent of the carrying amount at December 31, 2009 was 74 percent for Home Loans & Insurance and 109 percent for Global Card Services. The increase in the fair value of Global Card Services during the fourth quarter of 2009 was primarily attributable to improvement in market conditions and the economic outlook for the reporting unit. Under step two of the goodwill impairment analysis for both reporting units, significant assumptions in measuring the fair value of the assets and liabilities of the reporting units including discount rates, loss rates, interest rates and new account growth were updated in light of the improvement in economic conditions. Based on the results of step two of our impairment tests, there was no goodwill impairment as of December 31, 2009.
If economic conditions deteriorate or other events adversely impact the business models and the related assumptions including discount
| Bank of America 2009 | 91 |
rates, loss rates, interest rates and new account growth used to value these reporting units, there could be a change in the valuation of our goodwill and intangible assets and may possibly result in the recognition of impairment losses. With any assumption change, when a prolonged change in performance causes the fair value of the reporting unit to fall below the carrying amount of goodwill, goodwill impairment will occur.
Consolidation and Accounting for Variable Interest Entities
Under applicable accounting guidance, a VIE is consolidated by the entity that will absorb a majority of the variability created by the assets of the VIE. The calculation of variability is based on an analysis of projected probability-weighted cash flows based on the design of the particular VIE. Scenarios in which expected cash flows are less than or greater than the expected outcomes create expected losses or expected residual returns. The entity that will absorb a majority of expected variability (the sum of the absolute values of the expected losses and expected residual returns) consolidates the VIE and is referred to as the primary beneficiary.
A variety of qualitative and quantitative assumptions are used to estimate projected cash flows and the relative probability of each potential outcome, and to determine which parties will absorb expected losses and expected residual returns. Critical assumptions, which may include projected credit losses and interest rates, are independently verified against market observable data where possible. Where market observable data is not available, the results of the analysis become more subjective.
As certain events occur, we reconsider which parties will absorb variability and whether we have become or are no longer the primary beneficiary. The consolidation status of a VIE may change as a result of such reconsideration events, which occur when VIEs acquire additional assets, issue new variable interests or enter into new or modified contractual arrangements. A reconsideration event may also occur when we acquire new or additional interests in a VIE.
See the Impact of Adopting New Accounting Guidance on Consolidation section on page 52 for a discussion of new accounting that significantly changes the criteria for consolidation effective January 1, 2010.
2008 Compared to 2007
The following discussion and analysis provides a comparison of our results of operations for 2008 and 2007. This discussion should be read in conjunction with the Consolidated Financial Statements and related Notes. Tables 6 and 7 contain financial data to supplement this discussion.
Overview
Net Income
Net income totaled $4.0 billion in 2008 compared to $15.0 billion in 2007. Including preferred stock dividends, income applicable to common shareholders was $2.6 billion, or $0.54 per diluted share. Those results compared with 2007 net income available to common shareholders of $14.8 billion, or $3.29 per diluted share. The return on average common shareholders' equity was 1.80 percent in 2008 compared to 11.08 percent in 2007.
Net Interest Income
Net interest income on a FTE basis increased $10.4 billion to $46.6 billion for 2008 compared to 2007. The increase was driven by strong loan growth, as well as the acquisitions of Countrywide and LaSalle, and the contribution from market-based net interest income related to our Global
Markets business, which benefited from the steepening of the yield curve and product mix. The net interest yield on a FTE basis increased 38 bps to 2.98 percent for 2008 compared to 2007, due to the improvement in market-based yield, the beneficial impact of the current interest rate environment and loan growth. Partially offsetting these increases were the additions of lower yielding assets from the Countrywide and LaSalle acquisitions.
Noninterest Income
Noninterest income decreased $5.0 billion to $27.4 billion in 2008 compared to 2007.
| • | Card income decreased $763 million primarily due to the negative impact of higher credit costs on securitized credit card loans and the related unfavorable change in value of the interest-only strip as well as decreases in interchange income and late fees. Partially offsetting these decreases was higher debit card income. |
| • | Service charges grew $1.4 billion resulting from growth in new deposit accounts and the beneficial impact of the LaSalle acquisition. |
| • | Investment and brokerage services decreased $175 million primarily due to the absence of fees related to the sale of a business that we sold in late 2007 and the impact of significantly lower valuations in the equity markets, partially offset by the full year impact of the U.S. Trust and LaSalle acquisitions. |
| • | Investment banking income decreased $82 million due to reduced advisory fees related to the slowing economy. |
| • | Equity investment income decreased $3.5 billion due to a reduction in gains from our Global Principal Investments portfolio attributable to the lack of liquidity in the marketplace when compared to 2007 and other-than-temporary impairments taken on certain AFS marketable equity securities. |
| • | Trading account losses increased $1.0 billion in 2008 driven by losses related to CDO exposure and the continuing impact of the market disruptions on various parts of Global Markets . |
| • | Mortgage banking income increased $3.2 billion in large part as a result of the Countrywide acquisition which contributed significantly to increases in servicing income of $1.7 billion and production income of $1.5 billion. |
| • | Insurance premiums increased $1.1 billion primarily due to the Countrywide acquisition. |
| • | Gains on sales of debt securities increased $944 million driven by the sales of MBS and CMOs. |
| • | Other income decreased $2.9 billion due to Global Markets related write-downs and $1.1 billion associated with the support provided to certain cash funds managed within GWIM . In addition, 2008 was impacted by the absence of the $1.5 billion gain from the sale of a business in 2007. These items were partially offset by the gain of $776 million related to the Visa IPO. |
| • | Net impairment losses recognized in earnings on AFS debt securities increased $3.1 billion primarily due to CDO related write-downs. |
Provision for Credit Losses
The provision for credit losses increased $18.4 billion to $26.8 billion for 2008 compared to 2007 due to an increase of $9.8 billion in net charge-offs and higher additions to the reserve. The majority of the reserve additions were in consumer and small business portfolios, reflecting increased weakness in the housing markets and the slowing economy. Reserves were also increased on commercial portfolios for deterioration in the homebuilder and non–homebuilder commercial portfolios within Global Banking .
| 92 | Bank of America 2009 |
Noninterest Expense
Noninterest expense increased $4.0 billion to $41.5 billion for 2008 compared to 2007, primarily due to the acquisitions of Countrywide and LaSalle, which increased various expense categories, partially offset by a reduction in performance-based incentive compensation expense and the impact of certain benefits associated with the Visa IPO transactions.
Income Tax Expense
Income tax expense was $420 million for 2008 compared to $5.9 billion for 2007 resulting in effective tax rates of 9.5 percent and 28.4 percent. The effective tax rate decrease was due to permanent tax preference amounts (e.g., tax exempt income and tax credits) offsetting a higher percentage of our pre-tax income.
Business Segment Operations
Deposits
Net income increased $438 million, or nine percent, to $5.5 billion compared to 2007 driven by higher net interest income and noninterest income partially offset by an increase in noninterest expense. Net interest income increased $755 million, or seven percent, driven by a higher contribution from our ALM activities and growth in average deposits partially offset by the impact of competitive deposit pricing. Average deposits grew $33.3 billion, or 10 percent, due to organic growth, including customers' flight-to-safety, as well as the acquisitions of Countrywide and LaSalle. Organic growth was partially offset by the migration of customer relationships and related deposit balances to GWIM . Noninterest income increased $683 million, or 11 percent, to $6.9 billion driven by an increase of $798 million, or 13 percent, in service charges primarily as a result of increased volume, new demand deposit account growth and the addition of LaSalle. Noninterest expense increased $433 million, or five percent, to $8.8 billion compared to 2007, primarily due to the LaSalle and Countrywide acquisitions, combined with an increase in accounts and transaction volumes.
Global Card Services
Net income decreased $3.0 billion, or 71 percent, to $1.2 billion compared to 2007 as growth in net interest income and noninterest income was more than offset by an $8.5 billion increase in provision for credit losses. Net interest income grew $3.0 billion, or 18 percent, to $19.6 billion driven by higher managed average loans of $22.3 billion, or 10 percent, combined with the beneficial impact of the decrease in short-term interest rates on our funding costs. Noninterest income increased $485 million, or four percent, to $11.6 billion as other income benefited from the $388 million gain related to Global Card Services' allocation of the Visa IPO gain as well as a $283 million gain on the sale of a card portfolio. These increases were partially offset by the decrease in card income of $137 million, or one percent, due to the unfavorable change in the value of the interest-only strip and decreases in interchange income driven by reduced retail volume and late fees. These decreases were partially offset by higher debit card income due to new account and card growth, increased usage and the addition of LaSalle. Provision for credit losses increased $8.5 billion, or 73 percent, to $20.2 billion compared to 2007 primarily driven by portfolio deterioration and higher bankruptcies from impacts of the slowing economy, a lower level of foreign securitizations and growth-related seasoning of the portfolio. Noninterest expense decreased $217 million, or two percent, to $9.2 billion compared to 2007, as the impact of certain benefits associated with the Visa IPO transactions and lower marketing expense were partially offset by higher personnel and technology-related expenses from increased customer assistance and collections infrastructure.
Home Loans & Insurance
Home Loans & Insurance net income decreased $2.6 billion to a net loss of $2.5 billion compared to 2007 as growth in noninterest income and net interest income was more than offset by higher provision for credit losses and an increase in noninterest expense. Net interest income grew $1.4 billion, or 74 percent, driven primarily by an increase in average home equity loans and LHFS. The growth in average home equity loans of $32.9 billion, or 45 percent, and a $5.5 billion increase in LHFS were attributable to the Countrywide and LaSalle acquisitions as well as increases in our home equity portfolio as a result of slower prepayment speeds and organic growth. Noninterest income increased $4.2 billion to $6.0 billion compared to 2007 driven by increases in mortgage banking income and insurance income. Mortgage banking income grew $3.1 billion due primarily to the acquisition of Countrywide combined with increases in the value of MSR economic hedge instruments partially offset by a decrease in the value of MSRs. Insurance income increased $1.1 billion due to the acquisition of Countrywide. Provision for credit losses increased $5.3 billion to $6.3 billion compared to 2007. This increase was driven primarily by higher losses inherent in the home equity portfolio reflecting deterioration in the housing markets particularly in geographic areas that have experienced higher levels of declines in home prices. This drove more severe charge-offs as borrowers defaulted. Noninterest expense increased $4.4 billion to $7.0 billion primarily driven by the Countrywide acquisition.
Global Banking
Net income increased $341 million, or eight percent, to $4.5 billion in 2008 compared to 2007 as increased total revenue and lower noninterest expense were partially offset by an increase in provision for credit losses. Net interest income increased $2.1 billion, or 24 percent, driven by growth in average loans and leases of $64.1 billion, or 25 percent, and average deposits of $29.6 billion, or 20 percent. The increases in average loans and leases and average deposits were driven by the LaSalle acquisition and organic growth. Noninterest income decreased $42 million, or one percent, as Global Banking's share of write-downs on legacy assets was partially offset by an increase in service charges and the $388 million gain related to Global Banking's allocation of the Visa IPO gain. The increase in service charges was driven by organic growth, changes in our pricing structure and the LaSalle acquisition. The provision for credit losses increased $2.5 billion to $3.1 billion in 2008 compared to 2007. The increase was primarily driven by reserve additions and higher charge-offs primarily due to the continued weakness in the housing markets on the homebuilder portfolio. Also contributing to this increase were higher commercial – domestic and foreign net charge-offs which increased from very low 2007 levels and higher net charge-offs and reserve increases in the retail dealer-related loan portfolios due to deterioration and seasoning of the portfolio. Noninterest expense decreased $874 million, or 12 percent, primarily due to lower incentive compensation and the impact of certain benefits associated with the Visa IPO transactions, partially offset by the addition of LaSalle.
Global Markets
Global Markets recognized a net loss of $4.9 billion in 2008 compared to a net loss of $3.8 billion in 2007 as increased net interest income and reduced noninterest expense were more than offset by increased sales and trading losses. Sales and trading revenue was a net loss of $6.9 billion in 2008 as compared to a net loss of $2.6 billion in 2007. These decreases were driven by losses related to CDO exposure, our hedging activities including counterparty credit risk valuations and the continuing impact of the market disruptions on various parts of our business including the severe volatility, illiquidity and credit dislocations that
| Bank of America 2009 | 93 |
were experienced in the debt and equity markets in the fourth quarter of 2008. Partially offsetting these declines were favorable results in our rates and currencies products which benefited from volatility in interest rates and foreign exchange markets which also drove favorable client flows. Noninterest expense declined $834 million primarily due to lower performance-based incentive compensation.
Global Wealth & Investment Management
Net income decreased $527 million, or 27 percent, to $1.4 billion in 2008 as increases in net interest income and investment and brokerage services income were more than offset by losses associated with the support provided to certain cash funds, increases in provision for credit losses and noninterest expense as well as losses related to the buyback of ARS. Net interest income increased $877 million, or 22 percent, to $4.8 billion due to higher margin on ALM activities, the acquisitions of U.S. Trust Corporation and LaSalle, and growth in average deposit and loan balances partially offset by spread compression driven by deposit mix and competitive deposit pricing. GWIM average deposit growth benefited from the migration of customer relationships and related balances from Deposits , organic growth and the U.S. Trust Corporation and LaSalle acquisitions. Noninterest income decreased $625 million, or 17 percent, to $3.0 billion driven by $1.1 billion in losses during 2008 related to the support provided to certain cash funds and losses of $181 million related to the buyback of ARS. These losses were partially offset by an increase of $278 million in investment and brokerage services resulting from the U.S. Trust Corporation acquisition partially offset by the impact of significantly lower valuations in the equity markets. Provision for credit losses increased $649 million to $664 million as a result of higher credit
costs due to the deterioration in the housing markets and the impacts of a slower economy. Noninterest expense increased $419 million, or nine percent, to $4.9 billion due to the addition of U.S. Trust Corporation and LaSalle, and higher initiative spending partially offset by lower discretionary incentive compensation.
All Other
Net income decreased $4.5 billion to a net loss of $1.2 billion due to a decrease in total revenue combined with increases in provision for credit losses and merger and restructuring charges. Net interest income increased $113 million primarily due to increased net interest income related to our functional activities partially offset by the reclassification to card income related to our funds transfer pricing for Global Card Services' securitizations. Noninterest income declined $3.3 billion to $820 million driven by decreases in equity investment income of $3.5 billion and all other income (loss) of $1.2 billion partially offset by increases in gains on sales of debt securities of $953 million and card income of $653 million. Excluding the securitization offset to present Global Card Services on a managed basis provision for credit losses increased $3.2 billion to $2.9 billion primarily due to higher credit costs related to our ALM, residential mortgage portfolio reflecting deterioration in the housing markets and the impacts of a slowing economy. Additionally, deterioration in our Countrywide discontinued real estate portfolio subsequent to the July 1, 2008 acquisition as well as the absence of 2007 reserve reductions also contributed to the increase in provision. Merger and restructuring charges increased $525 million to $935 million due to the integration costs associated with the Countrywide and LaSalle acquisitions.
| 94 | Bank of America 2009 |
Statistical Tables
Table I Year-to-date Average Balances and Interest Rates – FTE Basis
| 2009 | 2008 | 2007 | |||||||||||||||||||||||||||||
| (Dollars in millions) | Average Balance | Interest Income/ Expense | Yield/ Rate | Average Balance | Interest Income/ Expense | Yield/ Rate | Average Balance | Interest Income/ Expense | Yield/ Rate | ||||||||||||||||||||||
Earning assets | |||||||||||||||||||||||||||||||
Time deposits placed and other short-term investments | $ | 27,465 | $ | 713 | 2.60 | % | $ | 10,696 | $ | 440 | 4.11 | % | $ | 13,152 | $ | 627 | 4.77 | % | |||||||||||||
Federal funds sold and securities borrowed or purchased under agreements to resell | 235,764 | 2,894 | 1.23 | 128,053 | 3,313 | 2.59 | 155,828 | 7,722 | 4.96 | ||||||||||||||||||||||
Trading account assets | 217,048 | 8,236 | 3.79 | 186,579 | 9,259 | 4.96 | 187,287 | 9,747 | 5.20 | ||||||||||||||||||||||
Debt securities (1) | 271,048 | 13,224 | 4.88 | 250,551 | 13,383 | 5.34 | 186,466 | 10,020 | 5.37 | ||||||||||||||||||||||
Loans and leases (2) : | |||||||||||||||||||||||||||||||
Residential mortgage (3) | 249,335 | 13,535 | 5.43 | 260,244 | 14,657 | 5.63 | 264,650 | 15,112 | 5.71 | ||||||||||||||||||||||
Home equity | 154,761 | 6,736 | 4.35 | 135,060 | 7,606 | 5.63 | 98,765 | 7,385 | 7.48 | ||||||||||||||||||||||
Discontinued real estate | 17,340 | 1,082 | 6.24 | 10,898 | 858 | 7.87 | n/a | n/a | n/a | ||||||||||||||||||||||
Credit card – domestic | 52,378 | 5,666 | 10.82 | 63,318 | 6,843 | 10.81 | 57,883 | 7,225 | 12.48 | ||||||||||||||||||||||
Credit card – foreign | 19,655 | 2,122 | 10.80 | 16,527 | 2,042 | 12.36 | 12,359 | 1,502 | 12.15 | ||||||||||||||||||||||
Direct/Indirect consumer (4) | 99,993 | 6,016 | 6.02 | 82,516 | 6,934 | 8.40 | 70,009 | 6,002 | 8.57 | ||||||||||||||||||||||
Other consumer (5) | 3,303 | 237 | 7.17 | 3,816 | 321 | 8.41 | 4,510 | 389 | 8.64 | ||||||||||||||||||||||
Total consumer | 596,765 | 35,394 | 5.93 | 572,379 | 39,261 | 6.86 | 508,176 | 37,615 | 7.40 | ||||||||||||||||||||||
Commercial – domestic | 223,813 | 8,883 | 3.97 | 220,561 | 11,702 | 5.31 | 180,102 | 12,884 | 7.15 | ||||||||||||||||||||||
Commercial real estate (6) | 73,349 | 2,372 | 3.23 | 63,208 | 3,057 | 4.84 | 42,950 | 3,145 | 7.32 | ||||||||||||||||||||||
Commercial lease financing | 21,979 | 990 | 4.51 | 22,290 | 799 | 3.58 | 20,435 | 1,212 | 5.93 | ||||||||||||||||||||||
Commercial – foreign | 32,899 | 1,406 | 4.27 | 32,440 | 1,503 | 4.63 | 24,491 | 1,452 | 5.93 | ||||||||||||||||||||||
Total commercial | 352,040 | 13,651 | 3.88 | 338,499 | 17,061 | 5.04 | 267,978 | 18,693 | 6.98 | ||||||||||||||||||||||
Total loans and leases | 948,805 | 49,045 | 5.17 | 910,878 | 56,322 | 6.18 | 776,154 | 56,308 | 7.25 | ||||||||||||||||||||||
| Other earning assets | 130,063 | 5,105 | 3.92 | 75,972 | 4,161 | 5.48 | 71,305 | 4,629 | 6.49 | ||||||||||||||||||||||
Total earning assets (7) | 1,830,193 | 79,217 | 4.33 | 1,562,729 | 86,878 | 5.56 | 1,390,192 | 89,053 | 6.41 | ||||||||||||||||||||||
Cash and cash equivalents | 196,237 | 45,354 | 33,091 | ||||||||||||||||||||||||||||
Other assets, less allowance for loan and lease losses | 411,087 | 235,896 | 178,790 | ||||||||||||||||||||||||||||
Total assets | $ | 2,437,517 | $ | 1,843,979 | $ | 1,602,073 | |||||||||||||||||||||||||
Interest-bearing liabilities | |||||||||||||||||||||||||||||||
Domestic interest-bearing deposits: | |||||||||||||||||||||||||||||||
Savings | $ | 33,671 | $ | 215 | 0.64 | % | $ | 32,204 | $ | 230 | 0.71 | % | $ | 32,316 | $ | 188 | 0.58 | % | |||||||||||||
NOW and money market deposit accounts | 358,847 | 1,557 | 0.43 | 267,818 | 3,781 | 1.41 | 220,207 | 4,361 | 1.98 | ||||||||||||||||||||||
Consumer CDs and IRAs | 218,041 | 5,054 | 2.32 | 203,887 | 7,404 | 3.63 | 167,801 | 7,817 | 4.66 | ||||||||||||||||||||||
Negotiable CDs, public funds and other time deposits | 37,661 | 473 | 1.26 | 32,264 | 1,076 | 3.33 | 20,557 | 974 | 4.74 | ||||||||||||||||||||||
Total domestic interest-bearing deposits | 648,220 | 7,299 | 1.13 | 536,173 | 12,491 | 2.33 | 440,881 | 13,340 | 3.03 | ||||||||||||||||||||||
Foreign interest-bearing deposits: | |||||||||||||||||||||||||||||||
Banks located in foreign countries | 19,397 | 144 | 0.74 | 37,657 | 1,063 | 2.82 | 42,788 | 2,174 | 5.08 | ||||||||||||||||||||||
Governments and official institutions | 7,580 | 18 | 0.23 | 13,004 | 311 | 2.39 | 16,523 | 812 | 4.91 | ||||||||||||||||||||||
Time, savings and other | 55,026 | 346 | 0.63 | 51,363 | 1,385 | 2.70 | 43,443 | 1,767 | 4.07 | ||||||||||||||||||||||
Total foreign interest-bearing deposits | 82,003 | 508 | 0.62 | 102,024 | 2,759 | 2.70 | 102,754 | 4,753 | 4.63 | ||||||||||||||||||||||
Total interest-bearing deposits | 730,223 | 7,807 | 1.07 | 638,197 | 15,250 | 2.39 | 543,635 | 18,093 | 3.33 | ||||||||||||||||||||||
Federal funds purchased, securities loaned or sold under agreements to repurchase and other short-term borrowings | 488,644 | 5,512 | 1.13 | 455,710 | 12,362 | 2.71 | 424,814 | 21,967 | 5.17 | ||||||||||||||||||||||
Trading account liabilities | 72,207 | 2,075 | 2.87 | 72,915 | 2,774 | 3.80 | 82,721 | 3,444 | 4.16 | ||||||||||||||||||||||
| Long-term debt | 446,634 | 15,413 | 3.45 | 231,235 | 9,938 | 4.30 | 169,855 | 9,359 | 5.51 | ||||||||||||||||||||||
Total interest-bearing liabilities (7) | 1,737,708 | 30,807 | 1.77 | 1,398,057 | 40,324 | 2.88 | 1,221,025 | 52,863 | 4.33 | ||||||||||||||||||||||
Noninterest-bearing sources: | |||||||||||||||||||||||||||||||
Noninterest-bearing deposits | 250,743 | 192,947 | 173,547 | ||||||||||||||||||||||||||||
Other liabilities | 204,421 | 88,144 | 70,839 | ||||||||||||||||||||||||||||
Shareholders' equity | 244,645 | 164,831 | 136,662 | ||||||||||||||||||||||||||||
Total liabilities and shareholders' equity | $ | 2,437,517 | $ | 1,843,979 | $ | 1,602,073 | |||||||||||||||||||||||||
Net interest spread | 2.56 | % | 2.68 | % | 2.08 | % | |||||||||||||||||||||||||
Impact of noninterest-bearing sources | 0.09 | 0.30 | 0.52 | ||||||||||||||||||||||||||||
Net interest income/yield on earning assets | $ | 48,410 | 2.65 | % | $ | 46,554 | 2.98 | % | $ | 36,190 | 2.60 | % | |||||||||||||||||||
| (1) | Yields on AFS debt securities are calculated based on fair value rather than the cost basis. The use of fair value does not have a material impact on net interest yield. |
| (2) | Nonperforming loans are included in the respective average loan balances. Income on these nonperforming loans is recognized on a cash basis. |
| (3) | Includes foreign residential mortgages loans of $622 million in 2009. We did not have any material foreign residential mortgage loans prior to January 1, 2009. |
| (4) | Includes foreign consumer loans of $8.0 billion, $2.7 billion and $3.8 billion in 2009, 2008 and 2007, respectively. |
| (5) | Includes consumer finance loans of $2.4 billion, $2.8 billion and $3.2 billion in 2009, 2008 and 2007, respectively; and other foreign consumer loans of $657 million, $774 million and $1.1 billion in 2009, 2008 and 2007, respectively. |
| (6) | Includes domestic commercial real estate loans of $70.7 billion, $62.1 billion and $42.1 billion in 2009, 2008 and 2007, respectively; and foreign commercial real estate loans of $2.7 billion, $1.1 billion and $858 million in 2009, 2008 and 2007. |
| (7) | Interest income includes the impact of interest rate risk management contracts, which decreased interest income on the underlying assets $456 million, $260 million and $542 million in 2009, 2008 and 2007, respectively. Interest expense includes the impact of interest rate risk management contracts, which increased (decreased) interest expense on the underlying liabilities $(3.0) billion, $409 million and $813 million in 2009, 2008 and 2007, respectively. For further information on interest rate contracts, see Interest Rate Risk Management for Nontrading Activities beginning on page 83. |
| n/a | = not applicable |
| Bank of America 2009 | 95 |
Table II Analysis of Changes in Net Interest Income – FTE Basis
| From 2008 to 2009 | From 2007 to 2008 | |||||||||||||||||||||||||
| Due to Change in (1) | Net Change | Due to Change in (1) | Net Change | |||||||||||||||||||||||
| (Dollars in millions) | Volume | Rate | Volume | Rate | ||||||||||||||||||||||
Increase (decrease) in interest income | ||||||||||||||||||||||||||
Time deposits placed and other short-term investments | $ | 689 | $ | (416 | ) | $ | 273 | $ | (117 | ) | $ | (70 | ) | $ | (187 | ) | ||||||||||
Federal funds sold and securities borrowed or purchased under agreements to resell | 2,793 | (3,212 | ) | (419 | ) | (1,371 | ) | (3,038 | ) | (4,409 | ) | |||||||||||||||
Trading account assets | 1,507 | (2,530 | ) | (1,023 | ) | (45 | ) | (443 | ) | (488 | ) | |||||||||||||||
Debt securities | 1,091 | (1,250 | ) | (159 | ) | 3,435 | (72 | ) | 3,363 | |||||||||||||||||
Loans and leases: | ||||||||||||||||||||||||||
Residential mortgage | (619 | ) | (503 | ) | (1,122 | ) | (252 | ) | (203 | ) | (455 | ) | ||||||||||||||
Home equity | 1,107 | (1,977 | ) | (870 | ) | 2,717 | (2,496 | ) | 221 | |||||||||||||||||
Discontinued real estate | 507 | (283 | ) | 224 | n/a | n/a | 858 | |||||||||||||||||||
Credit card – domestic | (1,181 | ) | 4 | (1,177 | ) | 677 | (1,059 | ) | (382 | ) | ||||||||||||||||
Credit card – foreign | 387 | (307 | ) | 80 | 506 | 34 | 540 | |||||||||||||||||||
Direct/Indirect consumer | 1,465 | (2,383 | ) | (918 | ) | 1,070 | (138 | ) | 932 | |||||||||||||||||
Other consumer | (43 | ) | (41 | ) | (84 | ) | (59 | ) | (9 | ) | (68 | ) | ||||||||||||||
Total consumer | (3,867 | ) | 1,646 | |||||||||||||||||||||||
Commercial – domestic | 182 | (3,001 | ) | (2,819 | ) | 2,886 | (4,068 | ) | (1,182 | ) | ||||||||||||||||
Commercial real estate | 493 | (1,178 | ) | (685 | ) | 1,482 | (1,570 | ) | (88 | ) | ||||||||||||||||
Commercial lease financing | (12 | ) | 203 | 191 | 110 | (523 | ) | (413 | ) | |||||||||||||||||
Commercial – foreign | 20 | (117 | ) | (97 | ) | 472 | (421 | ) | 51 | |||||||||||||||||
Total commercial | (3,410 | ) | (1,632 | ) | ||||||||||||||||||||||
Total loans and leases | (7,277 | ) | 14 | |||||||||||||||||||||||
Other earning assets | 2,966 | (2,022 | ) | 944 | 302 | (770 | ) | (468 | ) | |||||||||||||||||
Total interest income | $ | (7,661 | ) | $ | (2,175 | ) | ||||||||||||||||||||
Increase (decrease) in interest expense | ||||||||||||||||||||||||||
Domestic interest-bearing deposits: | ||||||||||||||||||||||||||
Savings | $ | 9 | $ | (24 | ) | $ | (15 | ) | $ | (1 | ) | $ | 43 | $ | 42 | |||||||||||
NOW and money market deposit accounts | 1,279 | (3,503 | ) | (2,224 | ) | 942 | (1,522 | ) | (580 | ) | ||||||||||||||||
Consumer CDs and IRAs | 511 | (2,861 | ) | (2,350 | ) | 1,684 | (2,097 | ) | (413 | ) | ||||||||||||||||
Negotiable CDs, public funds and other time deposits | 178 | (781 | ) | (603 | ) | 555 | (453 | ) | 102 | |||||||||||||||||
Total domestic interest-bearing deposits | (5,192 | ) | (849 | ) | ||||||||||||||||||||||
Foreign interest-bearing deposits: | ||||||||||||||||||||||||||
Banks located in foreign countries | (516 | ) | (403 | ) | (919 | ) | (261 | ) | (850 | ) | (1,111 | ) | ||||||||||||||
Governments and official institutions | (130 | ) | (163 | ) | (293 | ) | (174 | ) | (327 | ) | (501 | ) | ||||||||||||||
Time, savings and other | 101 | (1,140 | ) | (1,039 | ) | 323 | (705 | ) | (382 | ) | ||||||||||||||||
Total foreign interest-bearing deposits | (2,251 | ) | (1,994 | ) | ||||||||||||||||||||||
Total interest-bearing deposits | (7,443 | ) | (2,843 | ) | ||||||||||||||||||||||
Federal funds purchased, securities loaned or sold under | 880 | (7,730 | ) | (6,850 | ) | 1,593 | (11,198 | ) | (9,605 | ) | ||||||||||||||||
Trading account liabilities | (30 | ) | (669 | ) | (699 | ) | (411 | ) | (259 | ) | (670 | ) | ||||||||||||||
Long-term debt | 9,267 | (3,792 | ) | 5,475 | 3,382 | (2,803 | ) | 579 | ||||||||||||||||||
Total interest expense | (9,517 | ) | (12,539 | ) | ||||||||||||||||||||||
Net increase in net interest income | $ | 1,856 | $ | 10,364 | ||||||||||||||||||||||
| (1) | The changes for each category of interest income and expense are divided between the portion of change attributable to the variance in volume and the portion of change attributable to the variance in rate for that category. The unallocated change in rate or volume variance is allocated between the rate and volume variances. |
| n/a | = not applicable |
| 96 | Bank of America 2009 |
Table III Preferred Stock Cash Dividend Summary (as of February 26, 2010)
| Preferred Stock | Outstanding (in millions) | Declaration Date | Record Date | Payment Date | Per Annum Dividend Rate | Dividend Per Share | ||||||||||
Series B (1) | $ | 1 | January 27, 2010 | April 9, 2010 | April 23, 2010 | 7.00 | % | $ | 1.75 | |||||||
| October 28, 2009 | January 11, 2010 | January 25, 2010 | 7.00 | 1.75 | ||||||||||||
| July 21, 2009 | October 9, 2009 | October 23, 2009 | 7.00 | 1.75 | ||||||||||||
| April 29, 2009 | July 10, 2009 | July 24, 2009 | 7.00 | 1.75 | ||||||||||||
| January 16, 2009 | April 10, 2009 | April 24, 2009 | 7.00 | 1.75 | ||||||||||||
Series D (2) | $ | 661 | January 4, 2010 | February 26, 2010 | March 15, 2010 | 6.204 | % | $ | 0.38775 | |||||||
| October 2, 2009 | November 30, 2009 | December 14, 2009 | 6.204 | 0.38775 | ||||||||||||
| July 2, 2009 | August 31, 2009 | September 14, 2009 | 6.204 | 0.38775 | ||||||||||||
| April 3, 2009 | May 29, 2009 | June 15, 2009 | 6.204 | 0.38775 | ||||||||||||
| January 5, 2009 | February 27, 2009 | March 16, 2009 | 6.204 | 0.38775 | ||||||||||||
Series E (2) | $ | 487 | January 4, 2010 | January 29, 2010 | February 16, 2010 | Floating | $ | 0.25556 | ||||||||
| October 2, 2009 | October 30, 2009 | November 16, 2009 | Floating | 0.25556 | ||||||||||||
| July 2, 2009 | July 31, 2009 | August 17, 2009 | Floating | 0.25556 | ||||||||||||
| April 3, 2009 | April 30, 2009 | May 15, 2009 | Floating | 0.24722 | ||||||||||||
| January 5, 2009 | January 30, 2009 | February 17, 2009 | Floating | 0.25556 | ||||||||||||
Series H (2) | $ | 2,862 | January 4, 2010 | January 15, 2010 | February 1, 2010 | 8.20 | % | $ | 0.51250 | |||||||
| October 2, 2009 | October 15, 2009 | November 2, 2009 | 8.20 | 0.51250 | ||||||||||||
| July 2, 2009 | July 15, 2009 | August 3, 2009 | 8.20 | 0.51250 | ||||||||||||
| April 3, 2009 | April 15, 2009 | May 1, 2009 | 8.20 | 0.51250 | ||||||||||||
| January 5, 2009 | January 15, 2009 | February 2, 2009 | 8.20 | 0.51250 | ||||||||||||
Series I (2) | $ | 365 | January 4, 2010 | March 15, 2010 | April 1, 2010 | 6.625 | % | $ | 0.41406 | |||||||
| October 2, 2009 | December 15, 2009 | January 4, 2010 | 6.625 | 0.41406 | ||||||||||||
| July 2, 2009 | September 15, 2009 | October 1, 2009 | 6.625 | 0.41406 | ||||||||||||
| April 3, 2009 | June 15, 2009 | July 1, 2009 | 6.625 | 0.41406 | ||||||||||||
| January 5, 2009 | March 15, 2009 | April 1, 2009 | 6.625 | 0.41406 | ||||||||||||
Series J (2) | $ | 978 | January 4, 2010 | January 15, 2010 | February 1, 2010 | 7.25 | % | $ | 0.45312 | |||||||
| October 2, 2009 | October 15, 2009 | November 2, 2009 | 7.25 | 0.45312 | ||||||||||||
| July 2, 2009 | July 15, 2009 | August 3, 2009 | 7.25 | 0.45312 | ||||||||||||
| April 3, 2009 | April 15, 2009 | May 1, 2009 | 7.25 | 0.45312 | ||||||||||||
| January 5, 2009 | January 15, 2009 | February 2, 2009 | 7.25 | 0.45312 | ||||||||||||
Series K (3, 4) | $ | 1,668 | January 4, 2010 | January 15, 2010 | February 1, 2010 | Fixed-to-Floating | $ | 40.00 | ||||||||
| July 2, 2009 | July 15, 2009 | July 30, 2009 | Fixed-to-Floating | 40.00 | ||||||||||||
| January 5, 2009 | January 15, 2009 | January 30, 2009 | Fixed-to-Floating | 40.00 | ||||||||||||
Series L | $ | 3,349 | December 17, 2009 | January 1, 2010 | February 1, 2010 | 7.25 | % | $ | 18.1250 | |||||||
| September 18, 2009 | October 1, 2009 | October 30, 2009 | 7.25 | 18.1250 | ||||||||||||
| June 19, 2009 | July 1, 2009 | July 30, 2009 | 7.25 | 18.1250 | ||||||||||||
| March 17, 2009 | April 1, 2009 | April 30, 2009 | 7.25 | 18.1250 | ||||||||||||
Series M (3, 4) | $ | 1,434 | October 2, 2009 | October 31, 2009 | November 16, 2009 | Fixed-to-Floating | $ | 40.625 | ||||||||
| April 3, 2009 | April 30, 2009 | May 15, 2009 | Fixed-to-Floating | 40.625 | ||||||||||||
Series N (1, 5) | $ | – | October 2, 2009 | October 31, 2009 | November 16, 2009 | 5.00 | % | $ | 312.50 | |||||||
| July 2, 2009 | July 31, 2009 | August 17, 2009 | 5.00 | 312.50 | ||||||||||||
| April 3, 2009 | April 30, 2009 | May 15, 2009 | 5.00 | 312.50 | ||||||||||||
| January 5, 2009 | (6) | January 31, 2009 | February 17, 2009 | 5.00 | 371.53 | |||||||||||
Series Q (1, 5) | $ | – | October 2, 2009 | October 31, 2009 | November 16, 2009 | 5.00 | % | $ | 312.50 | |||||||
| July 2, 2009 | July 31, 2009 | August 17, 2009 | 5.00 | 312.50 | ||||||||||||
| April 3, 2009 | April 30, 2009 | May 15, 2009 | 5.00 | 312.50 | ||||||||||||
| January 5, 2009 | (6) | January 31, 2009 | February 17, 2009 | 5.00 | 125.00 | |||||||||||
Series R (1, 5) | $ | – | October 2, 2009 | October 31, 2009 | November 16, 2009 | 8.00 | % | $ | 500.00 | |||||||
| July 2, 2009 | July 31, 2009 | August 17, 2009 | 8.00 | 500.00 | ||||||||||||
| April 3, 2009 | April 30, 2009 | May 15, 2009 | 8.00 | 500.00 | ||||||||||||
| January 5, 2009 | (6) | January 31, 2009 | February 17, 2009 | 8.00 | 161.11 | |||||||||||
| Bank of America 2009 | 97 |
Preferred Stock Cash Dividend Summary (as of February 26, 2010) continued
Preferred Stock | Outstanding (in millions) | Declaration Date | Record Date | Payment Date | Per Annum Dividend Rate | Dividend Per Share | |||||||||
Series 1 (7) | $ | 146 | January 4, 2010 | February 15, 2010 | February 26, 2010 | Floating | $ | 0.19167 | |||||||
| October 2, 2009 | November 15, 2009 | November 30, 2009 | Floating | 0.19167 | |||||||||||
| July 2, 2009 | August 15, 2009 | August 28, 2009 | Floating | 0.19167 | |||||||||||
| April 3, 2009 | May 15, 2009 | May 28, 2009 | Floating | 0.18542 | |||||||||||
| January 5, 2009 | February 15, 2009 | February 27, 2009 | Floating | 0.19167 | |||||||||||
Series 2 (7) | $ | 526 | January 4, 2010 | February 15, 2010 | February 26, 2010 | Floating | $ | 0.19167 | |||||||
| October 2, 2009 | November 15, 2009 | November 30, 2009 | Floating | 0.19167 | |||||||||||
| July 2, 2009 | August 15, 2009 | August 28, 2009 | Floating | 0.19167 | |||||||||||
| April 3, 2009 | May 15, 2009 | May 28, 2009 | Floating | 0.18542 | |||||||||||
| January 5, 2009 | February 15, 2009 | February 27, 2009 | Floating | 0.19167 | |||||||||||
Series 3 (7) | $ | 670 | January 4, 2010 | February 15, 2010 | March 1, 2010 | 6.375 | % | $ | 0.39843 | ||||||
| October 2, 2009 | November 15, 2009 | November 30, 2009 | 6.375 | 0.39843 | |||||||||||
| July 2, 2009 | August 15, 2009 | August 28, 2009 | 6.375 | 0.39843 | |||||||||||
| April 3, 2009 | May 15, 2009 | May 28, 2009 | 6.375 | 0.39843 | |||||||||||
| January 5, 2009 | February 15, 2009 | March 2, 2009 | 6.375 | 0.39843 | |||||||||||
Series 4 (7) | $ | 389 | January 4, 2010 | February 15, 2010 | February 26, 2010 | Floating | $ | 0.25556 | |||||||
| October 2, 2009 | November 15, 2009 | November 30, 2009 | Floating | 0.25556 | |||||||||||
| July 2, 2009 | August 15, 2009 | August 28, 2009 | Floating | 0.25556 | |||||||||||
| April 3, 2009 | May 15, 2009 | May 28, 2009 | Floating | 0.24722 | |||||||||||
| January 5, 2009 | February 15, 2009 | February 27, 2009 | Floating | 0.25556 | |||||||||||
Series 5 (7) | $ | 606 | January 4, 2010 | February 1, 2010 | February 22, 2010 | Floating | $ | 0.25556 | |||||||
| October 2, 2009 | November 1, 2009 | November 23, 2009 | Floating | 0.25556 | |||||||||||
| July 2, 2009 | August 1, 2009 | August 21, 2009 | Floating | 0.25556 | |||||||||||
| April 3, 2009 | May 1, 2009 | May 21, 2009 | Floating | 0.24722 | |||||||||||
| January 5, 2009 | February 1, 2009 | February 23, 2009 | Floating | 0.25556 | |||||||||||
Series 6 (8) | $ | 65 | January 4, 2010 | March 15, 2010 | March 30, 2010 | 6.70 | % | $ | 0.41875 | ||||||
| October 2, 2009 | December 15, 2009 | December 30, 2009 | 6.70 | 0.41875 | |||||||||||
| July 2, 2009 | September 15, 2009 | September 30, 2009 | 6.70 | 0.41875 | |||||||||||
| April 3, 2009 | June 15, 2009 | June 30, 2009 | 6.70 | 0.41875 | |||||||||||
| January 5, 2009 | March 15, 2009 | March 30, 2009 | 6.70 | 0.41875 | |||||||||||
Series 7 (8) | $ | 17 | January 4, 2010 | March 15, 2010 | March 30, 2010 | 6.25 | % | $ | 0.39062 | ||||||
| October 2, 2009 | December 15, 2009 | December 30, 2009 | 6.25 | 0.39062 | |||||||||||
| July 2, 2009 | September 15, 2009 | September 30, 2009 | 6.25 | 0.39062 | |||||||||||
| April 3, 2009 | June 15, 2009 | June 30, 2009 | 6.25 | 0.39062 | |||||||||||
| January 5, 2009 | March 15, 2009 | March 30, 2009 | 6.25 | 0.39062 | |||||||||||
Series 8 (7) | $ | 2,673 | January 4, 2010 | February 15, 2010 | March 1, 2010 | 8.625 | % | $ | 0.53906 | ||||||
| October 2, 2009 | November 15, 2009 | November 30, 2009 | 8.625 | 0.53906 | |||||||||||
| July 2, 2009 | August 15, 2009 | August 28, 2009 | 8.625 | 0.53906 | |||||||||||
| April 3, 2009 | May 15, 2009 | May 28, 2009 | 8.625 | 0.53906 | |||||||||||
| January 5, 2009 | February 15, 2009 | March 2, 2009 | 8.625 | 0.53906 | |||||||||||
Series 2 (MC) (9) | $ | 1,200 | January 4, 2010 | February 15, 2010 | March 1, 2010 | 9.00 | % | $ | 2,250.00 | ||||||
| October 2, 2009 | November 15, 2009 | November 30, 2009 | 9.00 | 2,250.00 | |||||||||||
| July 2, 2009 | August 15, 2009 | August 28, 2009 | 9.00 | 2,250.00 | |||||||||||
| April 3, 2009 | May 15, 2009 | May 28, 2009 | 9.00 | 2,250.00 | |||||||||||
| January 21, 2009 | February 15, 2009 | March 2, 2009 | 9.00 | 2,250.00 | |||||||||||
Series 3 (MC) (9) | $ | 500 | January 4, 2010 | February 15, 2010 | March 1, 2010 | 9.00 | % | $ | 2,250.00 | ||||||
| October 2, 2009 | November 15, 2009 | November 30, 2009 | 9.00 | 2,250.00 | |||||||||||
| July 2, 2009 | August 15, 2009 | August 28, 2009 | 9.00 | 2,250.00 | |||||||||||
| April 3, 2009 | May 15, 2009 | May 28, 2009 | 9.00 | 2,250.00 | |||||||||||
| January 21, 2009 | February 15, 2009 | March 2, 2009 | 9.00 | 2,250.00 | |||||||||||
| (1) | Dividends are cumulative. |
| (2) | Dividends per depositary share, each representing a 1/1000 th interest in a share of preferred stock. |
| (3) | Initially pays dividends semi-annually. |
| (4) | Dividends per depositary share, each representing 1/25 th interest in a share of preferred stock. |
| (5) | In connection with the repurchase of the TARP preferred stock on December 9, 2009, the Corporation paid accrued and unpaid dividends to the date of repurchase of $83.33, $83.33 and $133.33 per share for Series N, Q and R, respectively. |
| (6) | Initial dividends |
| (7) | Dividends per depositary share, each representing a 1/1200 th interest in a share of preferred stock. |
| (8) | Dividends per depositary share, each representing 1/40 th interest in a share of preferred stock. |
| (9) | Represents preferred stock of Merrill Lynch & Co., Inc. which is mandatorily convertible (MC) on October 15, 2010, but optionally convertible prior to that date. |
| 98 | Bank of America 2009 |
Table IV Outstanding Loans and Leases
| (Dollars in millions) | December 31 | ||||||||||||||
| 2009 | 2008 | 2007 | 2006 | 2005 | |||||||||||
Consumer | |||||||||||||||
Residential mortgage (1) | $ | 242,129 | $ | 248,063 | $ | 274,949 | $ | 241,181 | $ | 182,596 | |||||
Home equity | 149,126 | 152,483 | 114,820 | 87,893 | 70,229 | ||||||||||
Discontinued real estate (2) | 14,854 | 19,981 | n/a | n/a | n/a | ||||||||||
Credit card – domestic | 49,453 | 64,128 | 65,774 | 61,195 | 58,548 | ||||||||||
Credit card – foreign | 21,656 | 17,146 | 14,950 | 10,999 | – | ||||||||||
Direct/Indirect consumer (3) | 97,236 | 83,436 | 76,538 | 59,206 | 37,265 | ||||||||||
Other consumer (4) | 3,110 | 3,442 | 4,170 | 5,231 | 6,819 | ||||||||||
Total consumer | 577,564 | 588,679 | 551,201 | 465,705 | 355,457 | ||||||||||
Commercial | |||||||||||||||
Commercial – domestic (5) | 198,903 | 219,233 | 208,297 | 161,982 | 140,533 | ||||||||||
Commercial real estate (6) | 69,447 | 64,701 | 61,298 | 36,258 | 35,766 | ||||||||||
Commercial lease financing | 22,199 | 22,400 | 22,582 | 21,864 | 20,705 | ||||||||||
Commercial – foreign | 27,079 | 31,020 | 28,376 | 20,681 | 21,330 | ||||||||||
Total commercial loans-excluding loans measured at fair value | 317,628 | 337,354 | 320,553 | 240,785 | 218,334 | ||||||||||
Commercial loans measured at fair value (7) | 4,936 | 5,413 | 4,590 | n/a | n/a | ||||||||||
Total commercial | 322,564 | 342,767 | 325,143 | 240,785 | 218,334 | ||||||||||
Total loans and leases | $ | 900,128 | $ | 931,446 | $ | 876,344 | $ | 706,490 | $ | 573,791 | |||||
| (1) | Includes foreign residential mortgages of $552 million at December 31, 2009 mainly from the Merrill Lynch acquisition. We did not have any material foreign residential mortgage loans prior to January 1, 2009. |
| (2) | Includes $13.4 billion and $18.2 billion of pay option loans and $1.5 billion and $1.8 billion of subprime loans at December 31, 2009 and 2008. The Corporation no longer originates these products. |
| (3) | Includes dealer financial services loans of $41.6 billion, $40.1 billion, $37.2 billion, $33.4 billion and $27.7 billion; consumer lending of $19.7 billion, $28.2 billion, $24.4 billion, $16.3 billion and $0; and foreign consumer loans of $8.0 billion, $1.8 billion, $3.4 billion, $3.9 billion and $48 million at December 31, 2009, 2008, 2007, 2006 and 2005, respectively. The 2009 amount includes securities-based lending margin loans of $12.9 billion. |
| (4) | Includes consumer finance loans of $2.3 billion, $2.6 billion, $3.0 billion, $2.8 billion and $2.8 billion and other foreign consumer loans of $709 million, $618 million, $829 million, $2.3 billion and $3.8 billion at December 31, 2009, 2008, 2007, 2006 and 2005, respectively. |
| (5) | Includes small business commercial – domestic loans, including card related products, of $17.5 billion, $19.1 billion, $19.3 billion, $15.2 billion and $7.2 billion at December 31, 2009, 2008, 2007, 2006 and 2005, respectively. |
| (6) | Includes domestic commercial real estate loans of $66.5 billion, $63.7 billion, $60.2 billion, $35.7 billion and $35.2 billion, and foreign commercial real estate loans of $3.0 billion, $979 million, $1.1 billion, $578 million and $585 million at December 31, 2009, 2008, 2007, 2006 and 2005, respectively. |
| (7) | Certain commercial loans are accounted for under the fair value option and include commercial – domestic loans of $3.0 billion, $3.5 billion and $3.5 billion, commercial – foreign loans of $1.9 billion, $1.7 billion and $790 million, and commercial real estate loans of $90 million, $203 million and $304 million at December 31, 2009, 2008 and 2007, respectively. |
| n/a | = not applicable |
| Bank of America 2009 | 99 |
Table V Nonperforming Loans, Leases and Foreclosed Properties (1)
| December 31 | |||||||||||||||
| (Dollars in millions) | 2009 | 2008 | 2007 | 2006 | 2005 | ||||||||||
Consumer | |||||||||||||||
Residential mortgage | $ | 16,596 | $ | 7,057 | $ | 1,999 | $ | 660 | $ | 570 | |||||
Home equity | 3,804 | 2,637 | 1,340 | 289 | 151 | ||||||||||
Discontinued real estate | 249 | 77 | n/a | n/a | n/a | ||||||||||
Direct/Indirect consumer | 86 | 26 | 8 | 4 | 3 | ||||||||||
Other consumer | 104 | 91 | 95 | 77 | 61 | ||||||||||
Total consumer (2) | 20,839 | 9,888 | 3,442 | 1,030 | 785 | ||||||||||
Commercial | |||||||||||||||
Commercial – domestic (3) | 4,925 | 2,040 | 852 | 494 | 550 | ||||||||||
Commercial real estate | 7,286 | 3,906 | 1,099 | 118 | 49 | ||||||||||
Commercial lease financing | 115 | 56 | 33 | 42 | 62 | ||||||||||
Commercial – foreign | 177 | 290 | 19 | 13 | 34 | ||||||||||
| 12,503 | 6,292 | 2,003 | 667 | 695 | |||||||||||
Small business commercial – domestic | 200 | 205 | 152 | 90 | 31 | ||||||||||
Total commercial (4) | 12,703 | 6,497 | 2,155 | 757 | 726 | ||||||||||
Total nonperforming loans and leases | 33,542 | 16,385 | 5,597 | 1,787 | 1,511 | ||||||||||
Foreclosed properties | 2,205 | 1,827 | 351 | 69 | 92 | ||||||||||
Total nonperforming loans, leases and foreclosed properties (5) | $ | 35,747 | $ | 18,212 | $ | 5,948 | $ | 1,856 | $ | 1,603 | |||||
| (1) | Balances do not include purchased impaired loans even though the customer may be contractually past due. Loans accounted for as purchased impaired loans were written down to fair value upon acquisition and accrete interest income over the remaining life of the loan. |
| (2) | In 2009, $1.4 billion in interest income was estimated to be contractually due on consumer loans and leases classified as nonperforming at December 31, 2009 provided that these loans and leases had been paying according to their terms and conditions, including troubled debt restructured loans of which $3.0 billion were performing at December 31, 2009 and not included in the table above. Approximately $194 million of the estimated $1.4 billion in contractual interest was received and included in earnings for 2009. |
| (3) | Excludes small business commercial – domestic loans. |
| (4) | In 2009, $450 million in interest income was estimated to be contractually due on commercial loans and leases classified as nonperforming at December 31, 2009, including troubled debt restructured loans of which $91 million were performing at December 31, 2009 and not included in the table above. Approximately $128 million of the estimated $450 million in contractual interest was received and included in earnings for 2009. |
| (5) | Balances do not include loans accounted for under the fair value option. At December 31, 2009, there were $15 million of nonperforming loans accounted for under the fair value option. At December 31, 2009, there were $87 million of loans or leases past due 90 days or more and still accruing interest accounted for under the fair value option. |
| n/a | = not applicable |
| 100 | Bank of America 2009 |
Table VI Accruing Loans and Leases Past Due 90 Days or More (1)
| December 31 | |||||||||||||||
| (Dollars in millions) | 2009 | 2008 | 2007 | 2006 | 2005 | ||||||||||
Consumer | |||||||||||||||
Residential mortgage (2) | $ | 11,680 | $ | 372 | $ | 237 | $ | 118 | $ | – | |||||
Credit card – domestic | 2,158 | 2,197 | 1,855 | 1,991 | 1,197 | ||||||||||
Credit card – foreign | 500 | 368 | 272 | 184 | – | ||||||||||
Direct/Indirect consumer | 1,488 | 1,370 | 745 | 378 | 75 | ||||||||||
Other consumer | 3 | 4 | 4 | 7 | 15 | ||||||||||
Total consumer | 15,829 | 4,311 | 3,113 | 2,678 | 1,287 | ||||||||||
Commercial | |||||||||||||||
Commercial – domestic (3) | 213 | 381 | 119 | 66 | 79 | ||||||||||
Commercial real estate | 80 | 52 | 36 | 78 | 4 | ||||||||||
Commercial lease financing | 32 | 23 | 25 | 26 | 15 | ||||||||||
Commercial – foreign | 67 | 7 | 16 | 9 | 32 | ||||||||||
| 392 | 463 | 196 | 179 | 130 | |||||||||||
Small business commercial – domestic | 624 | 640 | 427 | 199 | 38 | ||||||||||
Total commercial | 1,016 | 1,103 | 623 | 378 | 168 | ||||||||||
Total accruing loans and leases past due 90 days or more (4) | $ | 16,845 | $ | 5,414 | $ | 3,736 | $ | 3,056 | $ | 1,455 | |||||
| (1) | Accruing loans past due 90 days or more do not include purchased impaired loans which were written down to fair value upon acquisition and accrete interest income over the remaining life of the loan. |
| (2) | Balances represent repurchases of insured or guaranteed loans. |
| (3) | Excludes small business commercial – domestic loans. |
| (4) | Balances do not include loans accounted for under the fair value option. At December 31, 2009 there were $87 million of loans past due 90 days or more and still accruing interest accounted for under the fair value option. |
| Bank of America 2009 | 101 |
Table VII Allowance for Credit Losses
| (Dollars in millions) | 2009 | 2008 | 2007 | 2006 | 2005 | |||||||||||||||
Allowance for loan and lease losses, January 1 | $ | 23,071 | $ | 11,588 | $ | 9,016 | $ | 8,045 | $ | 8,626 | ||||||||||
Loans and leases charged off | ||||||||||||||||||||
Residential mortgage | (4,436 | ) | (964 | ) | (78 | ) | (74 | ) | (58 | ) | ||||||||||
Home equity | (7,205 | ) | (3,597 | ) | (286 | ) | (67 | ) | (46 | ) | ||||||||||
Discontinued real estate | (104 | ) | (19 | ) | n/a | n/a | n/a | |||||||||||||
Credit card – domestic | (6,753 | ) | (4,469 | ) | (3,410 | ) | (3,546 | ) | (4,018 | ) | ||||||||||
Credit card – foreign | (1,332 | ) | (639 | ) | (453 | ) | (292 | ) | – | |||||||||||
Direct/Indirect consumer | (6,406 | ) | (3,777 | ) | (1,885 | ) | (857 | ) | (380 | ) | ||||||||||
Other consumer | (491 | ) | (461 | ) | (346 | ) | (327 | ) | (376 | ) | ||||||||||
Total consumer charge-offs | (26,727 | ) | (13,926 | ) | (6,458 | ) | (5,163 | ) | (4,878 | ) | ||||||||||
Commercial – domestic (1) | (5,237 | ) | (2,567 | ) | (1,135 | ) | (597 | ) | (535 | ) | ||||||||||
Commercial real estate | (2,744 | ) | (895 | ) | (54 | ) | (7 | ) | (5 | ) | ||||||||||
Commercial lease financing | (217 | ) | (79 | ) | (55 | ) | (28 | ) | (315 | ) | ||||||||||
Commercial – foreign | (558 | ) | (199 | ) | (28 | ) | (86 | ) | (61 | ) | ||||||||||
Total commercial charge-offs | (8,756 | ) | (3,740 | ) | (1,272 | ) | (718 | ) | (916 | ) | ||||||||||
Total loans and leases charged off | (35,483 | ) | (17,666 | ) | (7,730 | ) | (5,881 | ) | (5,794 | ) | ||||||||||
Recoveries of loans and leases previously charged off | ||||||||||||||||||||
Residential mortgage | 86 | 39 | 22 | 35 | 31 | |||||||||||||||
Home equity | 155 | 101 | 12 | 16 | 15 | |||||||||||||||
Discontinued real estate | 3 | 3 | n/a | n/a | n/a | |||||||||||||||
Credit card – domestic | 206 | 308 | 347 | 452 | 366 | |||||||||||||||
Credit card – foreign | 93 | 88 | 74 | 67 | – | |||||||||||||||
Direct/Indirect consumer | 943 | 663 | 512 | 247 | 132 | |||||||||||||||
Other consumer | 63 | 62 | 68 | 110 | 101 | |||||||||||||||
Total consumer recoveries | 1,549 | 1,264 | 1,035 | 927 | 645 | |||||||||||||||
Commercial – domestic (2) | 161 | 118 | 128 | 261 | 365 | |||||||||||||||
Commercial real estate | 42 | 8 | 7 | 4 | 5 | |||||||||||||||
Commercial lease financing | 22 | 19 | 53 | 56 | 84 | |||||||||||||||
Commercial – foreign | 21 | 26 | 27 | 94 | 133 | |||||||||||||||
Total commercial recoveries | 246 | 171 | 215 | 415 | 587 | |||||||||||||||
Total recoveries of loans and leases previously charged off | 1,795 | 1,435 | 1,250 | 1,342 | 1,232 | |||||||||||||||
Net charge-offs | (33,688 | ) | (16,231 | ) | (6,480 | ) | (4,539 | ) | (4,562 | ) | ||||||||||
Provision for loan and lease losses | 48,366 | 26,922 | 8,357 | 5,001 | 4,021 | |||||||||||||||
Write-downs on consumer purchased impaired loans (3) | (179 | ) | n/a | n/a | n/a | n/a | ||||||||||||||
Other (4) | (370 | ) | 792 | 695 | 509 | (40 | ) | |||||||||||||
Allowance for loan and lease losses, December 31 | 37,200 | 23,071 | 11,588 | 9,016 | 8,045 | |||||||||||||||
Reserve for unfunded lending commitments, January 1 | 421 | 518 | 397 | 395 | 402 | |||||||||||||||
Provision for unfunded lending commitments | 204 | (97 | ) | 28 | 9 | (7 | ) | |||||||||||||
Other (5) | 862 | – | 93 | (7 | ) | – | ||||||||||||||
Reserve for unfunded lending commitments, December 31 | 1,487 | 421 | 518 | 397 | 395 | |||||||||||||||
Allowance for credit losses, December 31 | $ | 38,687 | $ | 23,492 | $ | 12,106 | $ | 9,413 | $ | 8,440 | ||||||||||
Loans and leases outstanding at December 31 (6) | $ | 895,192 | $ | 926,033 | $ | 871,754 | $ | 706,490 | $ | 573,791 | ||||||||||
Allowance for loan and lease losses as a percentage of total loans and leases outstanding at December 31 (3, 6) | 4.16 | % | 2.49 | % | 1.33 | % | 1.28 | % | 1.40 | % | ||||||||||
Consumer allowance for loan and lease losses as a percentage of total consumer loans and leases outstanding at December 31 (3) | 4.81 | 2.83 | 1.23 | 1.19 | 1.27 | |||||||||||||||
Commercial allowance for loan and lease losses as a percentage of total commercial loans and leases outstanding at December 31 (3) | 2.96 | 1.90 | 1.51 | 1.44 | 1.62 | |||||||||||||||
Average loans and leases outstanding (3, 6) | $ | 941,862 | $ | 905,944 | $ | 773,142 | $ | 652,417 | $ | 537,218 | ||||||||||
Net charge-offs as a percentage of average loans and leases outstanding (3, 6) | 3.58 | % | 1.79 | % | 0.84 | % | 0.70 | % | 0.85 | % | ||||||||||
Allowance for loan and lease losses as a percentage of total nonperforming loans and leases at December 31 (3, 6) | 111 | 141 | 207 | 505 | 532 | |||||||||||||||
Ratio of the allowance for loan and lease losses at December 31 to net charge-offs (3) | 1.10 | 1.42 | 1.79 | 1.99 | 1.76 | |||||||||||||||
| (1) | Includes small business commercial – domestic charge-offs of $3.0 billion, $2.0 billion, $931 million and $424 million in 2009, 2008, 2007 and 2006, respectively. Small business commercial – domestic charge offs were not material in 2005. |
| (2) | Includes small business commercial – domestic recoveries of $65 million, $39 million, $51 million and $54 million in 2009, 2008, 2007 and 2006, respectively. Small business commercial – domestic recoveries were not material in 2005. |
| (3) | Allowance for loan and leases losses includes $3.9 billion and $750 million of valuation allowance for consumer purchased impaired loans at December 31, 2009 and 2008. Excluding the valuation allowance for purchased impaired loans, allowance for loan and leases losses as a percentage of total nonperforming loans and leases would have been 99 percent and 136 percent at December 31, 2009 and 2008. For more information on the impact of purchased impaired loans on asset quality statistics, see Consumer Portfolio Credit Risk Management beginning on page 54 and Commercial Portfolio Credit Risk Management beginning on page 64. |
| (4) | The 2009 amount includes a $750 million reduction in the allowance for loan and lease losses related to credit card loans of $8.5 billion which were exchanged for a $7.8 billion held-to-maturity debt security that was issued by the Corporation's U.S. Credit Card Securitization Trust and retained by the Corporation. This reduction was partially offset by a $340 million increase associated with the reclassification to other assets of the December 31, 2008 amount expected to be reimbursed under residential mortgage cash collateralized synthetic securitizations. The 2008 amount includes the $1.2 billion addition of the Countrywide allowance for loan losses as of July 1, 2008. The 2007 amount includes the $725 million and $25 million additions of the LaSalle and U.S. Trust Corporation allowance for loan losses as of October 1, 2007 and July 1, 2007 and a reduction of $32 million for the adjustment from the adoption of the fair value option accounting guidance. The 2006 amount includes the $577 billion addition of the MBNA Corporation allowance for loan losses as of January 1, 2006 |
| (5) | The 2009 amount represents the fair value of the acquired Merrill Lynch unfunded lending commitments excluding those accounted for under the fair value option, net of accretion and the impact of funding previously unfunded positions. The 2007 amount includes the $124 million addition of the LaSalle reserve for unfunded lending commitments as of October 1, 2007 and a $28 million reduction for the adjustment from the adoption of the fair value option accounting guidance. |
| (6) | Outstanding loan and lease balances and ratios do not include loans accounted for under the fair value option at and for the years ended December 31, 2009, 2008 and 2007. Loans measured at fair value were $4.9 billion, $5.4 billion and $4.6 billion at December 31, 2009, 2008 and 2007, respectively. Average loans accounted for under the fair value option were $6.9 billion, $4.9 billion and $3.0 billion for 2009, 2008 and 2007, respectively. |
n/a = not applicable
| 102 | Bank of America 2009 |
Table VIII Allocation of the Allowance for Credit Losses by Product Type
| December 31 | ||||||||||||||||||||||||||||||||||||||
| 2009 | 2008 | 2007 | 2006 | 2005 | ||||||||||||||||||||||||||||||||||
| (Dollars in millions) | Amount | Percent of Total | Amount | Percent of Total | Amount | Percent of Total | Amount | Percent of Total | Amount | Percent of Total | ||||||||||||||||||||||||||||
Allowance for loan and lease losses | ||||||||||||||||||||||||||||||||||||||
Residential mortgage | $ | 4,607 | 12.38 | % | $ | 1,382 | 5.99 | % | $ | 207 | 1.79 | % | $ | 248 | 2.75 | % | $ | 277 | 3.44 | % | ||||||||||||||||||
Home equity | 10,160 | 27.31 | 5,385 | 23.34 | 963 | 8.31 | 133 | 1.48 | 136 | 1.69 | ||||||||||||||||||||||||||||
Discontinued real estate | 989 | 2.66 | 658 | 2.85 | n/a | n/a | n/a | n/a | n/a | n/a | ||||||||||||||||||||||||||||
Credit card – domestic | 6,017 | 16.18 | 3,947 | 17.11 | 2,919 | 25.19 | 3,176 | 35.23 | 3,301 | 41.03 | ||||||||||||||||||||||||||||
Credit card – foreign | 1,581 | 4.25 | 742 | 3.22 | 441 | 3.81 | 336 | 3.73 | - | - | ||||||||||||||||||||||||||||
Direct/Indirect consumer | 4,227 | 11.36 | 4,341 | 18.81 | 2,077 | 17.92 | 1,378 | 15.28 | 421 | 5.23 | ||||||||||||||||||||||||||||
Other consumer | 204 | 0.55 | 203 | 0.88 | 151 | 1.30 | 289 | 3.20 | 380 | 4.73 | ||||||||||||||||||||||||||||
Total consumer | 27,785 | 74.69 | 16,658 | 72.20 | 6,758 | 58.32 | 5,560 | 61.67 | 4,515 | 56.12 | ||||||||||||||||||||||||||||
Commercial – domestic (1) | 5,152 | 13.85 | 4,339 | 18.81 | 3,194 | 27.56 | 2,162 | 23.98 | 2,100 | 26.10 | ||||||||||||||||||||||||||||
Commercial real estate | 3,567 | 9.59 | 1,465 | 6.35 | 1,083 | 9.35 | 588 | 6.52 | 609 | 7.57 | ||||||||||||||||||||||||||||
Commercial lease financing | 291 | 0.78 | 223 | 0.97 | 218 | 1.88 | 217 | 2.41 | 232 | 2.89 | ||||||||||||||||||||||||||||
Commercial – foreign | 405 | 1.09 | 386 | 1.67 | 335 | 2.89 | 489 | 5.42 | 589 | 7.32 | ||||||||||||||||||||||||||||
Total commercial (2) | 9,415 | 25.31 | 6,413 | 27.80 | 4,830 | 41.68 | 3,456 | 38.33 | 3,530 | 43.88 | ||||||||||||||||||||||||||||
Allowance for loan and lease losses | 37,200 | 100.00 | % | 23,071 | 100.00 | % | 11,588 | 100.00 | % | 9,016 | 100.00 | % | 8,045 | 100.00 | % | |||||||||||||||||||||||
Reserve for unfunded lending commitments (3) | 1,487 | 421 | 518 | 397 | 395 | |||||||||||||||||||||||||||||||||
Allowance for credit losses (4) | $ | 38,687 | $ | 23,492 | $ | 12,106 | $ | 9,413 | $ | 8,440 | ||||||||||||||||||||||||||||
| (1) | Includes allowance for small business commercial – domestic loans of $2.4 billion, $2.4 billion, $1.4 billion and $578 million at December 31, 2009, 2008, 2007 and 2006, respectively. The allowance for small business commercial – domestic loans was not material in 2005. |
| (2) | Includes allowance for loan and lease losses for impaired commercial loans of $1.2 billion, $691 million, $123 million, $43 million and $55 million at December 31, 2009, 2008, 2007, 2006 and 2005, respectively. |
| (3) | Amounts for 2009 include the Merrill Lynch acquisition. The majority of the increase from December 31, 2008 relates to the fair value of the acquired Merrill Lynch unfunded lending commitments, excluding commitments accounted for under the fair value option. |
| (4) | Includes $3.9 billion and $750 million related to purchased impaired loans at December 31, 2009 and 2008. |
n/a = not applicable
Table IX Selected Loan Maturity Data (1, 2)
| December 31, 2009 | ||||||||||||||||
| (Dollars in millions) | Due in One Year or Less | Due After One Year Through Five Years | Due After Five Years | Total | ||||||||||||
Commercial – domestic | $ | 69,112 | $ | 90,528 | $ | 42,239 | $ | 201,879 | ||||||||
Commercial real estate – domestic | 30,926 | 26,463 | 9,154 | 66,543 | ||||||||||||
Foreign and other (3) | 25,157 | 8,361 | 262 | 33,780 | ||||||||||||
Total selected loans | $ | 125,195 | $ | 125,352 | $ | 51,655 | $ | 302,202 | ||||||||
Percent of total | 41.4 | % | 41.5 | % | 17.1 | % | 100.0 | % | ||||||||
Sensitivity of selected loans to changes in interest rates for loans due after one year: | ||||||||||||||||
Fixed interest rates | $ | 12,612 | $ | 28,247 | ||||||||||||
Floating or adjustable interest rates | 112,740 | 23,408 | ||||||||||||||
Total | $ | 125,352 | $ | 51,655 | ||||||||||||
| (1) | Loan maturities are based on the remaining maturities under contractual terms. |
| (2) | Includes loans accounted for under the fair value option. |
| (3) | Loan maturities include other consumer, commercial real estate and commercial – foreign loans. |
| Bank of America 2009 | 103 |
Table X Non-exchange Traded Commodity Contracts
| December 31, 2009 | ||||||||
| (Dollars in millions) | Asset Positions | Liability Positions | ||||||
Net fair value of contracts outstanding, January 1, 2009 | $ | 9,433 | $ | 6,726 | ||||
Effects of legally enforceable master netting agreements | 30,021 | 30,021 | ||||||
Gross fair value of contracts outstanding, January 1, 2009 | 39,454 | 36,747 | ||||||
Contracts realized or otherwise settled | (19,654 | ) | (18,623 | ) | ||||
Fair value of new contracts | 9,231 | 9,284 | ||||||
Other changes in fair value | (6,210 | ) | (5,865 | ) | ||||
Gross fair value of contracts outstanding, December 31, 2009 | 22,821 | 21,543 | ||||||
Effects of legally enforceable master netting agreements | (17,785 | ) | (17,785 | ) | ||||
Net fair value of contracts outstanding, December 31, 2009 | $ | 5,036 | $ | 3,758 | ||||
Table XI Non-exchange Traded Commodity Contract Maturities
| December 31, 2009 | ||||||||
| (Dollars in millions) | Asset Positions | Liability Positions | ||||||
Maturity of less than 1 year | $ | 16,161 | $ | 15,431 | ||||
Maturity of 1-3 years | 4,603 | 4,295 | ||||||
Maturity of 4-5 years | 774 | 542 | ||||||
Maturity in excess of 5 years | 1,283 | 1,275 | ||||||
Gross fair value of contracts outstanding | 22,821 | 21,543 | ||||||
Effects of legally enforceable master netting agreements | (17,785 | ) | (17,785 | ) | ||||
Net fair value of contracts outstanding | $ | 5,036 | $ | 3,758 | ||||
| 104 | Bank of America 2009 |
Table XII Selected Quarterly Financial Data
| 2009 Quarters | 2008 Quarters | |||||||||||||||||||||||||||||||||
| (Dollars in millions, except per share information) | Fourth | Third | Second | First | Fourth | Third | Second | First | ||||||||||||||||||||||||||
Income statement | ||||||||||||||||||||||||||||||||||
Net interest income | $ | 11,559 | $ | 11,423 | $ | 11,630 | $ | 12,497 | $ | 13,106 | $ | 11,642 | $ | 10,621 | $ | 9,991 | ||||||||||||||||||
Noninterest income | 13,517 | 14,612 | 21,144 | 23,261 | 2,574 | 7,979 | 9,789 | 7,080 | ||||||||||||||||||||||||||
Total revenue, net of interest expense | 25,076 | 26,035 | 32,774 | 35,758 | 15,680 | 19,621 | 20,410 | 17,071 | ||||||||||||||||||||||||||
Provision for credit losses | 10,110 | 11,705 | 13,375 | 13,380 | 8,535 | 6,450 | 5,830 | 6,010 | ||||||||||||||||||||||||||
Noninterest expense, before merger and restructuring charges | 15,852 | 15,712 | 16,191 | 16,237 | 10,641 | 11,413 | 9,447 | 9,093 | ||||||||||||||||||||||||||
Merger and restructuring charges | 533 | 594 | 829 | 765 | 306 | 247 | 212 | 170 | ||||||||||||||||||||||||||
Income (loss) before income taxes | (1,419 | ) | (1,976 | ) | 2,379 | 5,376 | (3,802 | ) | 1,511 | 4,921 | 1,798 | |||||||||||||||||||||||
Income tax expense (benefit) | (1,225 | ) | (975 | ) | (845 | ) | 1,129 | (2,013 | ) | 334 | 1,511 | 588 | ||||||||||||||||||||||
Net income (loss) | (194 | ) | (1,001 | ) | 3,224 | 4,247 | (1,789 | ) | 1,177 | 3,410 | 1,210 | |||||||||||||||||||||||
Net income (loss) applicable to | (5,196 | ) | (2,241 | ) | 2,419 | 2,814 | (2,392 | ) | 704 | 3,224 | 1,020 | |||||||||||||||||||||||
Average common shares issued and | 8,634,565 | 8,633,834 | 7,241,515 | 6,370,815 | 4,957,049 | 4,543,963 | 4,435,719 | 4,427,823 | ||||||||||||||||||||||||||
Average diluted common shares issued and outstanding (in thousands) | 8,634,565 | 8,633,834 | 7,269,518 | 6,431,027 | 4,957,049 | 4,547,578 | 4,444,098 | 4,461,201 | ||||||||||||||||||||||||||
Performance ratios | ||||||||||||||||||||||||||||||||||
Return on average assets | n/m | n/m | 0.53 | % | 0.68 | % | n/m | 0.25 | % | 0.78 | % | 0.28 | % | |||||||||||||||||||||
Return on average common shareholders' equity | n/m | n/m | 5.59 | 7.10 | n/m | 1.97 | 9.25 | 2.90 | ||||||||||||||||||||||||||
Return on average tangible common | n/m | n/m | 12.68 | 16.15 | n/m | 5.34 | 23.78 | 7.37 | ||||||||||||||||||||||||||
Return on average tangible shareholders' equity (1) | n/m | n/m | 8.86 | 12.42 | n/m | 6.11 | 18.12 | 7.06 | ||||||||||||||||||||||||||
Total ending equity to total ending assets | 10.41 | % | 11.45 | % | 11.32 | 10.32 | 9.74 | % | 8.79 | 9.48 | 9.00 | |||||||||||||||||||||||
Total average equity to total average assets | 10.35 | 10.71 | 10.03 | 9.08 | 9.06 | 8.73 | 9.20 | 8.77 | ||||||||||||||||||||||||||
Dividend payout | n/m | n/m | 3.56 | 2.28 | n/m | n/m | 88.67 | n/m | ||||||||||||||||||||||||||
Per common share data | ||||||||||||||||||||||||||||||||||
Earnings (loss) | $ | (0.60 | ) | $ | (0.26 | ) | $ | 0.33 | $ | 0.44 | $ | (0.48 | ) | $ | 0.15 | $ | 0.72 | $ | 0.23 | |||||||||||||||
Diluted earnings (loss) | (0.60 | ) | (0.26 | ) | 0.33 | 0.44 | (0.48 | ) | 0.15 | 0.72 | 0.23 | |||||||||||||||||||||||
Dividends paid | 0.01 | 0.01 | 0.01 | 0.01 | 0.32 | 0.64 | 0.64 | 0.64 | ||||||||||||||||||||||||||
Book value | 21.48 | 22.99 | 22.71 | 25.98 | 27.77 | 30.01 | 31.11 | 31.22 | ||||||||||||||||||||||||||
Tangible book value (1) | 11.94 | 12.00 | 11.66 | 10.88 | 10.11 | 10.50 | 11.87 | 11.90 | ||||||||||||||||||||||||||
Market price per share of common stock | ||||||||||||||||||||||||||||||||||
Closing | $ | 15.06 | $ | 16.92 | $ | 13.20 | $ | 6.82 | $ | 14.08 | $ | 35.00 | $ | 23.87 | $ | 37.91 | ||||||||||||||||||
High closing | 18.59 | 17.98 | 14.17 | 14.33 | 38.13 | 37.48 | 40.86 | 45.03 | ||||||||||||||||||||||||||
Low closing | 14.58 | 11.84 | 7.05 | 3.14 | 11.25 | 18.52 | 23.87 | 35.31 | ||||||||||||||||||||||||||
Market capitalization | $ | 130,273 | $ | 146,363 | $ | 114,199 | $ | 43,654 | $ | 70,645 | $ | 159,672 | $ | 106,292 | $ | 168,806 | ||||||||||||||||||
Average balance sheet | ||||||||||||||||||||||||||||||||||
Total loans and leases | $ | 905,913 | $ | 930,255 | $ | 966,105 | $ | 994,121 | $ | 941,563 | $ | 946,914 | $ | 878,639 | $ | 875,661 | ||||||||||||||||||
Total assets | 2,421,531 | 2,390,675 | 2,420,317 | 2,519,134 | 1,948,854 | 1,905,691 | 1,754,613 | 1,764,927 | ||||||||||||||||||||||||||
Total deposits | 995,160 | 989,295 | 974,892 | 964,081 | 892,141 | 857,845 | 786,002 | 787,623 | ||||||||||||||||||||||||||
Long-term debt | 445,440 | 449,974 | 444,131 | 446,975 | 255,709 | 264,934 | 205,194 | 198,463 | ||||||||||||||||||||||||||
Common shareholders' equity | 197,123 | 197,230 | 173,497 | 160,739 | 142,535 | 142,303 | 140,243 | 141,456 | ||||||||||||||||||||||||||
Total shareholders' equity | 250,599 | 255,983 | 242,867 | 228,766 | 176,566 | 166,454 | 161,428 | 154,728 | ||||||||||||||||||||||||||
Asset quality (2) | ||||||||||||||||||||||||||||||||||
Allowance for credit losses (3) | $ | 38,687 | $ | 37,399 | $ | 35,777 | $ | 31,150 | $ | 23,492 | $ | 20,773 | $ | 17,637 | $ | 15,398 | ||||||||||||||||||
Nonperforming loans, leases and | 35,747 | 33,825 | 30,982 | 25,632 | 18,212 | 13,576 | 9,749 | 7,827 | ||||||||||||||||||||||||||
Allowance for loan and lease losses as a percentage of total loans and leases outstanding (4) | 4.16 | % | 3.95 | % | 3.61 | % | 3.00 | % | 2.49 | % | 2.17 | % | 1.98 | % | 1.71 | % | ||||||||||||||||||
Allowance for loan and lease losses as a percentage of total nonperforming loans and leases (4) | 111 | 112 | 116 | 122 | 141 | 173 | 187 | 203 | ||||||||||||||||||||||||||
Net charge-offs | $ | 8,421 | $ | 9,624 | $ | 8,701 | $ | 6,942 | $ | 5,541 | $ | 4,356 | $ | 3,619 | $ | 2,715 | ||||||||||||||||||
Annualized net charge-offs as a percentage of average loans and leases outstanding (4) | 3.71 | % | 4.13 | % | 3.64 | % | 2.85 | % | 2.36 | % | 1.84 | % | 1.67 | % | 1.25 | % | ||||||||||||||||||
Nonperforming loans and leases as a percentage of total loans and leases outstanding (4) | 3.75 | 3.51 | 3.12 | 2.47 | 1.77 | 1.25 | 1.06 | 0.84 | ||||||||||||||||||||||||||
Nonperforming loans, leases and foreclosed properties as a percentage of total loans, leases and foreclosed properties (4) | 3.98 | 3.72 | 3.31 | 2.64 | 1.96 | 1.45 | 1.13 | 0.90 | ||||||||||||||||||||||||||
Ratio of the allowance for loan and lease losses at period end to annualized net charge-offs | 1.11 | 0.94 | 0.97 | 1.03 | 1.05 | 1.17 | 1.18 | 1.36 | ||||||||||||||||||||||||||
Capital ratios (period end) | ||||||||||||||||||||||||||||||||||
Risk-based capital: | ||||||||||||||||||||||||||||||||||
Tier 1 common | 7.81 | % | 7.25 | % | 6.90 | % | 4.49 | % | 4.80 | % | 4.23 | % | 4.78 | % | 4.64 | % | ||||||||||||||||||
Tier 1 | 10.40 | 12.46 | 11.93 | 10.09 | 9.15 | 7.55 | 8.25 | 7.51 | ||||||||||||||||||||||||||
Total | 14.66 | 16.69 | 15.99 | 14.03 | 13.00 | 11.54 | 12.60 | 11.71 | ||||||||||||||||||||||||||
Tier 1 leverage | 6.91 | 8.39 | 8.21 | 7.07 | 6.44 | 5.51 | 6.07 | 5.59 | ||||||||||||||||||||||||||
Tangible equity (1) | 6.42 | 7.55 | 7.39 | 6.42 | 5.11 | 4.13 | 4.72 | 4.26 | ||||||||||||||||||||||||||
Tangible common equity (1) | 5.57 | 4.82 | 4.67 | 3.13 | 2.93 | 2.75 | 3.24 | 3.21 | ||||||||||||||||||||||||||
| (1) | Tangible equity ratios and tangible book value per share of common stock are non-GAAP measures. Other companies may define or calculate these measures differently. For additional information on these ratios and a corresponding reconciliation to GAAP financial measures, see Supplemental Financial Data beginning on page 25. |
| (2) | For more information on the impact of purchased impaired loans on asset quality statistics, see Consumer Portfolio Credit Risk Management beginning on page 54 and Commercial Portfolio Credit Risk Management beginning on page 64. |
| (3) | Includes the allowance for loan and lease losses and the reserve for unfunded lending commitments. |
| (4) | Balances and ratios do not include loans accounted for under the fair value option. |
n/m = not meaningful
| Bank of America 2009 | 105 |
Table XIII Quarterly Average Balances and Interest Rates – FTE Basis
| Fourth Quarter 2009 | Third Quarter 2009 | |||||||||||||||||||
| (Dollars in millions) | Average Balance | Interest Income/ Expense | Yield/ Rate | Average Balance | Interest Income/ Expense | Yield/ Rate | ||||||||||||||
Earning assets | ||||||||||||||||||||
Time deposits placed and other short-term investments | $ | 28,566 | $ | 220 | 3.06 | % | $ | 29,485 | $ | 133 | 1.79 | % | ||||||||
Federal funds sold and securities borrowed or purchased under | 244,914 | 327 | 0.53 | 223,039 | 722 | 1.28 | ||||||||||||||
Trading account assets | 218,787 | 1,800 | 3.28 | 212,488 | 1,909 | 3.58 | ||||||||||||||
Debt securities (1) | 279,231 | 2,921 | 4.18 | 263,712 | 3,048 | 4.62 | ||||||||||||||
Loans and leases (2) : | ||||||||||||||||||||
Residential mortgage (3) | 236,883 | 3,108 | 5.24 | 241,924 | 3,258 | 5.38 | ||||||||||||||
Home equity | 150,704 | 1,613 | 4.26 | 153,269 | 1,614 | 4.19 | ||||||||||||||
Discontinued real estate | 15,152 | 174 | 4.58 | 16,570 | 219 | 5.30 | ||||||||||||||
Credit card – domestic | 49,213 | 1,336 | 10.77 | 49,751 | 1,349 | 10.76 | ||||||||||||||
Credit card – foreign | 21,680 | 605 | 11.08 | 21,189 | 562 | 10.52 | ||||||||||||||
Direct/Indirect consumer (4) | 98,938 | 1,361 | 5.46 | 100,012 | 1,439 | 5.71 | ||||||||||||||
Other consumer (5) | 3,177 | 50 | 6.33 | 3,331 | 60 | 7.02 | ||||||||||||||
Total consumer | 575,747 | 8,247 | 5.70 | 586,046 | 8,501 | 5.77 | ||||||||||||||
Commercial – domestic | 207,050 | 2,090 | 4.01 | 216,332 | 2,132 | 3.91 | ||||||||||||||
Commercial real estate (6) | 71,352 | 595 | 3.31 | 74,276 | 600 | 3.20 | ||||||||||||||
Commercial lease financing | 21,769 | 273 | 5.04 | 22,068 | 178 | 3.22 | ||||||||||||||
Commercial – foreign | 29,995 | 287 | 3.78 | 31,533 | 297 | 3.74 | ||||||||||||||
Total commercial | 330,166 | 3,245 | 3.90 | 344,209 | 3,207 | 3.70 | ||||||||||||||
Total loans and leases | 905,913 | 11,492 | 5.05 | 930,255 | 11,708 | 5.01 | ||||||||||||||
Other earning assets | 130,487 | 1,222 | 3.72 | 131,021 | 1,333 | 4.05 | ||||||||||||||
Total earning assets (7) | 1,807,898 | 17,982 | 3.96 | 1,790,000 | 18,853 | 4.19 | ||||||||||||||
Cash and cash equivalents | 230,618 | 196,116 | ||||||||||||||||||
Other assets, less allowance for loan and lease losses | 383,015 | 404,559 | ||||||||||||||||||
Total assets | $ | 2,421,531 | $ | 2,390,675 | ||||||||||||||||
Interest-bearing liabilities | ||||||||||||||||||||
Domestic interest-bearing deposits: | ||||||||||||||||||||
Savings | $ | 33,749 | $ | 54 | 0.63 | % | $ | 34,170 | $ | 49 | 0.57 | % | ||||||||
NOW and money market deposit accounts | 392,212 | 388 | 0.39 | 356,873 | 353 | 0.39 | ||||||||||||||
Consumer CDs and IRAs | 192,779 | 835 | 1.72 | 214,284 | 1,100 | 2.04 | ||||||||||||||
Negotiable CDs, public funds and other time deposits | 31,758 | 82 | 1.04 | 48,905 | 118 | 0.95 | ||||||||||||||
Total domestic interest-bearing deposits | 650,498 | 1,359 | 0.83 | 654,232 | 1,620 | 0.98 | ||||||||||||||
Foreign interest-bearing deposits: | ||||||||||||||||||||
Banks located in foreign countries | 16,477 | 30 | 0.73 | 15,941 | 29 | 0.73 | ||||||||||||||
Governments and official institutions | 6,650 | 4 | 0.23 | 6,488 | 4 | 0.23 | ||||||||||||||
Time, savings and other | 54,469 | 79 | 0.57 | 53,013 | 57 | 0.42 | ||||||||||||||
Total foreign interest-bearing deposits | 77,596 | 113 | 0.58 | 75,442 | 90 | 0.47 | ||||||||||||||
Total interest-bearing deposits | 728,094 | 1,472 | 0.80 | 729,674 | 1,710 | 0.93 | ||||||||||||||
Federal funds purchased, securities loaned or sold under | 450,538 | 658 | 0.58 | 411,063 | 1,237 | 1.19 | ||||||||||||||
Trading account liabilities | 83,118 | 591 | 2.82 | 73,290 | 455 | 2.46 | ||||||||||||||
Long-term debt | 445,440 | 3,365 | 3.01 | 449,974 | 3,698 | 3.27 | ||||||||||||||
Total interest-bearing liabilities (7) | 1,707,190 | 6,086 | 1.42 | 1,664,001 | 7,100 | 1.70 | ||||||||||||||
Noninterest-bearing sources: | ||||||||||||||||||||
Noninterest-bearing deposits | 267,066 | 259,621 | ||||||||||||||||||
Other liabilities | 196,676 | 211,070 | ||||||||||||||||||
Shareholders' equity | 250,599 | 255,983 | ||||||||||||||||||
Total liabilities and shareholders' equity | $ | 2,421,531 | $ | 2,390,675 | ||||||||||||||||
Net interest spread | 2.54 | % | 2.49 | % | ||||||||||||||||
Impact of noninterest-bearing sources | 0.08 | 0.12 | ||||||||||||||||||
Net interest income/yield on earning assets | $ | 11,896 | 2.62 | % | $ | 11,753 | 2.61 | % | ||||||||||||
| (1) | Yields on AFS debt securities are calculated based on fair value rather than the cost basis. The use of fair value does not have a material impact on net interest yield. |
| (2) | Nonperforming loans are included in the respective average loan balances. Income on these nonperforming loans is recognized on a cash basis. Purchased impaired loans were written down to fair value upon acquisition and accrete interest income over the remaining life of the loan. |
| (3) | Includes foreign residential mortgage loans of $550 million, $662 million, $650 million and $627 million for the fourth, third, second and first quarters of 2009, respectively. |
| (4) | Includes foreign consumer loans of $8.6 billion, $8.4 billion, $8.0 billion and $7.1 billion in the fourth, third, second and first quarters of 2009, respectively, and $2.0 billion in the fourth quarter of 2008. |
| (5) | Includes consumer finance loans of $2.3 billion, $2.4 billion, $2.5 billion and $2.6 billion in the fourth, third, second and first quarters of 2009, respectively, and $2.7 billion in the fourth quarter of 2008; and other foreign consumer loans of $689 million, $700 million, $640 million and $596 million in the fourth, third, second and first quarters of 2009, respectively, and $654 million in the fourth quarter of 2008. |
| (6) | Includes domestic commercial real estate loans of $68.2 billion, $70.7 billion, $72.8 billion and $70.9 billion in the fourth, third, second and first quarters of 2009, respectively, and $63.6 billion in the fourth quarter of 2008; and foreign commercial real estate loans of $3.1 billion, $3.6 billion, $2.8 billion and $1.3 billion in the fourth, third, second and first quarters of 2009, respectively, and $964 million in the fourth quarter of 2008. |
| (7) | Interest income includes the impact of interest rate risk management contracts, which decreased interest income on assets $248 million, $136 million, $11 million and $61 million in the fourth, third, second and first quarters of 2009, respectively, and $41 million in the fourth quarter of 2008. Interest expense includes the impact of interest rate risk management contracts, which increased (decreased) interest expense on liabilities $(1.1) billion, $(873) million, $(550) million and $(512) million in the fourth, third, second and first quarters of 2009, respectively, and $237 million in the fourth quarter of 2008. For further information on interest rate contracts, see Interest Rate Risk Management for Nontrading Activities beginning on page 83. |
| 106 | Bank of America 2009 |
Quarterly Average Balances and Interest Rates – FTE Basis (continued)
| Second Quarter 2009 | First Quarter 2009 | Fourth Quarter 2008 | |||||||||||||||||||||||||||||
| (Dollars in millions) | Average Balance | Interest Income/ Expense | Yield/ Rate | Average Balance | Interest Income/ Expense | Yield/ Rate | Average Balance | Interest Income/ Expense | Yield/ Rate | ||||||||||||||||||||||
Earning assets | |||||||||||||||||||||||||||||||
Time deposits placed and other short-term investments | $ | 25,604 | $ | 169 | 2.64 | % | $ | 26,158 | $ | 191 | 2.96 | % | $ | 10,511 | $ | 158 | 5.97 | % | |||||||||||||
Federal funds sold and securities borrowed or purchased under agreements to resell | 230,955 | 690 | 1.20 | 244,280 | 1,155 | 1.90 | 104,843 | 393 | 1.50 | ||||||||||||||||||||||
Trading account assets | 199,820 | 2,028 | 4.07 | 237,350 | 2,499 | 4.24 | 179,687 | 2,170 | 4.82 | ||||||||||||||||||||||
Debt securities (1) | 255,159 | 3,353 | 5.26 | 286,249 | 3,902 | 5.47 | 280,942 | 3,913 | 5.57 | ||||||||||||||||||||||
Loans and leases (2) : | |||||||||||||||||||||||||||||||
Residential mortgage (3) | 253,803 | 3,489 | 5.50 | 265,121 | 3,680 | 5.57 | 253,560 | 3,596 | 5.67 | ||||||||||||||||||||||
Home equity | 156,599 | 1,722 | 4.41 | 158,575 | 1,787 | 4.55 | 151,943 | 1,954 | 5.12 | ||||||||||||||||||||||
Discontinued real estate | 18,309 | 303 | 6.61 | 19,386 | 386 | 7.97 | 21,324 | 459 | 8.60 | ||||||||||||||||||||||
Credit card – domestic | 51,721 | 1,380 | 10.70 | 58,960 | 1,601 | 11.01 | 64,906 | 1,784 | 10.94 | ||||||||||||||||||||||
Credit card – foreign | 18,825 | 501 | 10.66 | 16,858 | 454 | 10.94 | 17,211 | 521 | 12.05 | ||||||||||||||||||||||
Direct/Indirect consumer (4) | 100,302 | 1,532 | 6.12 | 100,741 | 1,684 | 6.78 | 83,331 | 1,714 | 8.18 | ||||||||||||||||||||||
Other consumer (5) | 3,298 | 63 | 7.77 | 3,408 | 64 | 7.50 | 3,544 | 70 | 7.83 | ||||||||||||||||||||||
Total consumer | 602,857 | 8,990 | 5.97 | 623,049 | 9,656 | 6.25 | 595,819 | 10,098 | 6.76 | ||||||||||||||||||||||
Commercial – domestic | 231,639 | 2,176 | 3.77 | 240,683 | 2,485 | 4.18 | 226,095 | 2,890 | 5.09 | ||||||||||||||||||||||
Commercial real estate (6) | 75,559 | 627 | 3.33 | 72,206 | 550 | 3.09 | 64,586 | 706 | 4.35 | ||||||||||||||||||||||
Commercial lease financing | 22,026 | 260 | 4.72 | 22,056 | 279 | 5.05 | 22,069 | 242 | 4.40 | ||||||||||||||||||||||
Commercial – foreign | 34,024 | 360 | 4.24 | 36,127 | 462 | 5.18 | 32,994 | 373 | 4.49 | ||||||||||||||||||||||
Total commercial | 363,248 | 3,423 | 3.78 | 371,072 | 3,776 | 4.12 | 345,744 | 4,211 | 4.85 | ||||||||||||||||||||||
Total loans and leases | 966,105 | 12,413 | 5.15 | 994,121 | 13,432 | 5.46 | 941,563 | 14,309 | 6.06 | ||||||||||||||||||||||
Other earning assets | 134,338 | 1,251 | 3.73 | 124,325 | 1,299 | 4.22 | 99,127 | 959 | 3.85 | ||||||||||||||||||||||
Total earning assets (7) | 1,811,981 | 19,904 | 4.40 | 1,912,483 | 22,478 | 4.74 | 1,616,673 | 21,902 | 5.40 | ||||||||||||||||||||||
Cash and cash equivalents | 204,354 | 153,007 | 77,388 | ||||||||||||||||||||||||||||
Other assets, less allowance for loan and lease losses | 403,982 | 453,644 | 254,793 | ||||||||||||||||||||||||||||
Total assets | $ | 2,420,317 | $ | 2,519,134 | $ | 1,948,854 | |||||||||||||||||||||||||
Interest-bearing liabilities | |||||||||||||||||||||||||||||||
Domestic interest-bearing deposits: | |||||||||||||||||||||||||||||||
Savings | $ | 34,367 | $ | 54 | 0.63 | % | $ | 32,378 | $ | 58 | 0.72 | % | $ | 31,561 | $ | 58 | 0.73 | % | |||||||||||||
NOW and money market deposit accounts | 342,570 | 376 | 0.44 | 343,215 | 440 | 0.52 | 285,410 | 813 | 1.13 | ||||||||||||||||||||||
Consumer CDs and IRAs | 229,392 | 1,409 | 2.46 | 235,787 | 1,710 | 2.93 | 229,410 | 1,835 | 3.18 | ||||||||||||||||||||||
Negotiable CDs, public funds and other time deposits | 39,100 | 124 | 1.28 | 31,188 | 149 | 1.94 | 36,510 | 270 | 2.94 | ||||||||||||||||||||||
Total domestic interest-bearing deposits | 645,429 | 1,963 | 1.22 | 642,568 | 2,357 | 1.49 | 582,891 | 2,976 | 2.03 | ||||||||||||||||||||||
Foreign interest-bearing deposits: | |||||||||||||||||||||||||||||||
Banks located in foreign countries | 19,261 | 37 | 0.76 | 26,052 | 48 | 0.75 | 41,398 | 125 | 1.20 | ||||||||||||||||||||||
Governments and official institutions | 7,379 | 4 | 0.22 | 9,849 | 6 | 0.25 | 13,738 | 30 | 0.87 | ||||||||||||||||||||||
Time, savings and other | 54,307 | 78 | 0.58 | 58,380 | 132 | 0.92 | 48,836 | 165 | 1.34 | ||||||||||||||||||||||
Total foreign interest-bearing deposits | 80,947 | 119 | 0.59 | 94,281 | 186 | 0.80 | 103,972 | 320 | 1.22 | ||||||||||||||||||||||
Total interest-bearing deposits | 726,376 | 2,082 | 1.15 | 736,849 | 2,543 | 1.40 | 686,863 | 3,296 | 1.91 | ||||||||||||||||||||||
Federal funds purchased, securities loaned or sold under agreements to repurchase and other short-term borrowings | 503,451 | 1,396 | 1.11 | 591,928 | 2,221 | 1.52 | 459,743 | 1,910 | 1.65 | ||||||||||||||||||||||
Trading account liabilities | 62,778 | 450 | 2.87 | 69,481 | 579 | 3.38 | 65,058 | 524 | 3.20 | ||||||||||||||||||||||
Long-term debt | 444,131 | 4,034 | 3.64 | 446,975 | 4,316 | 3.89 | 255,709 | 2,766 | 4.32 | ||||||||||||||||||||||
Total interest-bearing liabilities (7) | 1,736,736 | 7,962 | 1.84 | 1,845,233 | 9,659 | 2.11 | 1,467,373 | 8,496 | 2.30 | ||||||||||||||||||||||
Noninterest-bearing sources: | |||||||||||||||||||||||||||||||
Noninterest-bearing deposits | 248,516 | 227,232 | 205,278 | ||||||||||||||||||||||||||||
Other liabilities | 192,198 | 217,903 | 99,637 | ||||||||||||||||||||||||||||
Shareholders' equity | 242,867 | 228,766 | 176,566 | ||||||||||||||||||||||||||||
Total liabilities and shareholders' equity | $ | 2,420,317 | $ | 2,519,134 | $ | 1,948,854 | |||||||||||||||||||||||||
Net interest spread | 2.56 | % | 2.63 | % | 3.10 | % | |||||||||||||||||||||||||
Impact of noninterest-bearing sources | 0.08 | 0.07 | 0.21 | ||||||||||||||||||||||||||||
Net interest income/yield on earning assets | $ | 11,942 | 2.64 | % | $ | 12,819 | 2.70 | % | $ | 13,406 | 3.31 | % | |||||||||||||||||||
For Footnotes, see page 106.
| Bank of America 2009 | 107 |
Glossary
Alt-A Mortgage – Alternative-A mortgage, a type of U.S. mortgage that, for various reasons, is considered riskier than A-paper, or "prime", and less risky than "subprime," the riskiest category. Alt-A interest rates, which are determined by credit risk, therefore tend to be between those of prime and subprime home loans. Typically, Alt-A mortgages are characterized by borrowers with less than full documentation, lower credit scores and higher LTVs.
Asset-Backed Commercial Paper Money Market Fund Liquidity Facility (AMLF) – A lending program created by the Federal Reserve on September 19, 2008 that provides nonrecourse loans to U.S. financial institutions for the purchase of U.S. dollar-denominated high-quality asset-backed commercial paper from money market mutual funds under certain conditions. This program is intended to assist money market funds that hold such paper in meeting demands for redemptions by investors and to foster liquidity in the asset-backed commercial paper market and money markets more generally. Financial institutions generally bear no credit risk associated with commercial paper purchased under the AMLF.
Assets in Custody – Consist largely of custodial and non-discretionary trust assets excluding brokerage assets administered for customers. Trust assets encompass a broad range of asset types including real estate, private company ownership interest, personal property and investments.
Assets Under Management (AUM) – The total market value of assets under the investment advisory and discretion of GWIM which generate asset management fees based on a percentage of the assets' market values. AUM reflect assets that are generally managed for institutional, high net-worth and retail clients and are distributed through various investment products including mutual funds, other commingled vehicles and separate accounts.
At-the-market Offering – A form of equity issuance where an exchange-listed company incrementally sells newly issued shares into the market through a designated broker/dealer at prevailing market prices, rather than via a traditional underwritten offering of a fixed number of shares at a fixed price all at once.
Bridge Financing – A loan or security that is expected to be replaced by permanent financing (debt or equity securities, loan syndication or asset sales) prior to the maturity date of the loan. Bridge loans may include an unfunded commitment, as well as funded amounts, and are generally expected to be retired in one year or less.
CDO-squared – A type of CDO where the underlying collateral includes tranches of other CDOs.
Client Brokerage Assets – Include client assets which are held in brokerage accounts. This includes non-discretionary brokerage and fee-based assets which generate brokerage income and asset management fee revenue.
Client Deposits – Includes GWIM client deposit accounts representing both consumer and commercial demand, regular savings, time, money market, sweep and foreign accounts.
Committed Credit Exposure – Includes any funded portion of a facility plus the unfunded portion of a facility on which the lender is legally bound to advance funds during a specified period under prescribed conditions.
Core Net Interest Income – Managed Basis – Net interest income on a fully taxable-equivalent basis excluding the impact of market-based activities and certain securitizations.
Credit Default Swap (CDS) – A derivative contract that provides protection against the deterioration of credit quality and allows one party to receive payment in the event of default by a third party under a borrowing arrangement.
Credit Card Accountability Responsibility and Disclosure Act of 2009 (CARD Act) – Legislation signed into law on May 22, 2009 to provide changes to credit card industry practices including significantly restricting credit card issuers' ability to change interest rates and assess fees to reflect individual consumer risk, change the way payments are applied and requiring changes to consumer credit card disclosures. The majority of the provisions became effective in February 2010.
Derivative – A contract or agreement whose value is derived from changes in an underlying index such as interest rates, foreign exchange rates or prices of securities. Derivatives utilized by the Corporation include swaps, financial futures and forward settlement contracts, and option contracts.
Emergency Economic Stabilization Act of 2008 (EESA) – Legislation signed into law on October 3, 2008 authorizing the U.S. Secretary of the Treasury to, among other things, establish the Troubled Asset Relief Program.
Excess Servicing Income – For certain assets that have been securitized, interest income, fee revenue and recoveries in excess of interest paid to the investors, gross credit losses and other trust expenses related to the securitized receivables are all classified as excess servicing income, which is a component of card income. Excess servicing income also includes the changes in fair value of the Corporation's card related retained interests.
Financial Stability Plan – A plan announced on February 10, 2009 by the U.S. Treasury pursuant to the EESA which outlines a series of initiatives including the Capital Assistance Program (CAP); the creation of a new Public-Private Investment Program (PPIP); the expansion of the Term Asset-Backed Securities Loan Facility (TALF); the extension of the FDIC's Temporary Liquidity Guarantee Program (TLGP) to October 31, 2009; the Small Business and Community Lending Initiative; a broad program to stabilize the housing market by encouraging lower mortgage rates and making it easier for homeowners to refinance and avoid foreclosure; and a new framework of governance and oversight related to the use of funds of the Financial Stability Plan.
Interest-only Strip – A residual interest in a securitization trust representing the right to receive future net cash flows from securitized assets after payments to third party investors and net credit losses. These arise when assets are transferred to a SPE as part of an asset securitization transaction qualifying for sale treatment under GAAP.
Interest Rate Lock Commitment (IRLC) – Commitment with a loan applicant in which the loan terms, including interest rate and price, are guaranteed for a designated period of time subject to credit approval.
Loan-to-value (LTV) – A commonly used credit quality metric that is reported in terms of ending and average LTV. Ending LTV is calculated as the outstanding carrying value of the loan at the end of the period divided by the estimated value of the property securing the loan. Estimated property values are primarily determined by utilizing the Case-Schiller Home Index, a widely used index based on data from repeat sales of single family homes. Case-Schiller indices are updated quarterly and are reported on a three-month or one-quarter lag. An additional metric related to LTV is combined loan-to-value (CLTV) which is similar to the LTV metric, yet combines the outstanding balance on the residential mortgage loan and the outstanding carrying value on the home equity loan or available line of credit, both of which are secured by the same property, divided by the estimated value of the property. A LTV of 100 percent reflects a loan that is currently secured by a property valued at an amount exactly equal to the carrying value or available line of the loan. Under certain circumstances, estimated values can also be determined by utilizing an automated valuation method (AVM) or Mortgage Risk Assessment Corporation (MRAC) index. An AVM is a tool that estimates the value of a prop -
| 108 | Bank of America 2009 |
erty by reference to large volumes of market data including sales of comparable properties and price trends specific to the MSA in which the property being valued is located. The MRAC index is similar to the Case-Schiller Home Index in that it is an index that is based on data from repeat sales of single family homes and is reported on a lag.
Letter of Credit – A document issued on behalf of a customer to a third party promising to pay the third party upon presentation of specified documents. A letter of credit effectively substitutes the issuer's credit for that of the customer.
Making Home Affordable Program (MHA) – A U.S. Treasury program to reduce the number of foreclosures and make it easier for homeowners to refinance loans. The program is comprised of the Home Affordable Modification Program (HAMP) which provides guidelines on loan modifications and is designed to help at-risk homeowners avoid foreclosure by reducing monthly mortgage payments and provides incentives to lenders to modify all eligible loans that fall under the program guidelines and the Home Affordable Refinance Program (HARP) which is available to homeowners who have a proven payment history on an existing mortgage owned by FNMA or FHLMC and is designed to help eligible homeowners refinance their mortgage loans to take advantage of current lower mortgage rates or to refinance ARMs into more stable fixed-rate mortgages. In addition, the Second Lien Program is a part of the MHA. For more information on this program see the separate definition for the Second Lien Program.
Managed Basis – Managed basis assumes that securitized loans were not sold and presents earnings on these loans in a manner similar to the way loans that have not been sold (i.e., held loans) are presented. Noninterest income, both on a held and managed basis, also includes the impact of adjustments to the interest-only strip that are recorded in card income.
Managed Net Losses – Represent net charge-offs on held loans combined with realized credit losses associated with the securitized loan portfolio.
Mortgage Servicing Right (MSR) – The right to service a mortgage loan when the underlying loan is sold or securitized. Servicing includes collections for principal, interest and escrow payments from borrowers and accounting for and remitting principal and interest payments to investors.
Net Interest Yield – Net interest income divided by average total interest-earning assets.
Nonperforming Loans and Leases – Includes loans and leases that have been placed on nonaccrual status, including nonaccruing loans whose contractual terms have been restructured in a manner that grants a concession to a borrower experiencing financial difficulties (troubled debt restructurings or TDRs). Loans accounted for under the fair value option, purchased impaired loans and loans held-for-sale are not reported as nonperforming loans and leases. Past due consumer credit card loans, consumer loans secured by personal property, unsecured consumer loans, consumer loans secured by real estate where repayments are insured by the Federal Housing Administration and business card loans are not placed on nonaccrual status and are, therefore, not reported as nonperforming loans and leases.
Option-adjusted Spread (OAS) – The spread that is added to the discount rate so that the sum of the discounted cash flows equals the market price, thus, it is a measure of the extra yield over the reference discount factor (i.e., the forward swap curve) that a company is expected to earn by holding the asset.
Primary Dealer Credit Facility (PDCF) – A facility announced on March 16, 2008 by the Federal Reserve to provide discount window loans to primary dealers that settle on the same business day and mature on the following business day, in exchange for a specified range of eligible collateral. The rate paid on the loan is the same as the primary credit rate
at the Federal Reserve Bank of New York. In addition, primary dealers are subject to a frequency-based fee after they exceed 45 days of use. The frequency-based fee is calculated on an escalating scale and communicated to the primary dealers in advance. The PDCF was available to primary dealers until February 1, 2010.
Purchased Impaired Loan – A loan purchased as an individual loan, in a portfolio of loans or in a business combination with evidence of deterioration in credit quality since origination for which it is probable, upon acquisition, that the investor will be unable to collect all contractually required payments. These loans are written down to fair value at the acquisition date.
Qualifying Special Purpose Entity (QSPE) – A SPE whose activities are strictly limited to holding and servicing financial assets and which meets the other criteria under applicable accounting guidance. A QSPE is generally not required to be consolidated by any party.
Return on Average Common Shareholders' Equity – Measure of the earnings contribution as a percentage of average common shareholders' equity.
Second Lien Program (2MP) – A MHA program announced on April 28, 2009 by the U.S. Treasury that focuses on creating a comprehensive affordability solution for homeowners. By focusing on shared efforts with lenders to reduce second mortgage payments, pay-for-success incentives for servicers, investors and borrowers, and a payment schedule for extinguishing second mortgages, the 2MP is designed to help up to 1.5 million homeowners. The program is designed to ensure that first and second lien holders are treated fairly and consistently with priority of liens, and offers automatic modification of a second lien when a first lien is modified. Details of the program are still being finalized as of the time of this filing.
Securitize/Securitization – A process by which financial assets are sold to a SPE, which then issues securities collateralized by those underlying assets, and the return on the securities issued is based on the principal and interest cash flow of the underlying assets.
Structured Investment Vehicle (SIV) – An entity that issues short duration debt and uses the proceeds from the issuance to purchase longer-term fixed income securities.
Subprime Loans – Although a standard industry definition for subprime loans (including subprime mortgage loans) does not exist, the Corporation defines subprime loans as specific product offerings for higher risk borrowers, including individuals with one or a combination of high credit risk factors, such as low FICO scores (generally less than 620 for secured products and 660 for unsecured products), high debt to income ratios and inferior payment history.
Super Senior CDO Exposure – Represents the most senior class of commercial paper or notes that are issued by CDO vehicles. These financial instruments benefit from the subordination of all other securities, including AAA-rated securities, issued by CDO vehicles.
Treasury Temporary Guarantee Program for Money Market Funds (TTGP) – A voluntary and temporary program announced on September 19, 2008 by the U.S. Treasury which provided for a guarantee to investors that they would receive $1.00 for each money market fund share held as of September 19, 2008 in the event that a participating fund no longer had a $1.00 per share net asset value and liquidated. With respect to such shares covered by this program, the guarantee payment would have been equal to any shortfall between the amount received by an investor in a liquidation and $1.00 per share. Eligible money market mutual funds paid a fee to the U.S. Treasury to participate in this program which expired on September 18, 2009.
Temporary Liquidity Guarantee Program (TLGP) – A program announced on October 14, 2008 by the FDIC which is comprised of the Debt Guaran -
| Bank of America 2009 | 109 |
tee Program (DGP) under which the FDIC guaranteed, for a fee, all newly issued senior unsecured debt (e.g., promissory notes, unsubordinated unsecured notes and commercial paper) up to prescribed limits, issued by participating entities through October 31, 2009, with an emergency guarantee facility available through April 30, 2010; and the Transaction Account Guarantee Program (TAGP) under which the FDIC will guarantee, for a fee, noninterest-bearing deposit accounts held at participating FDIC-insured depository institutions until June 30, 2010.
Term Auction Facility (TAF) – A temporary credit facility announced on December 12, 2007 and implemented by the Federal Reserve that allows a depository institution to place a bid for an advance from its local Federal Reserve Bank at an interest rate that is determined as the result of an auction and is aimed to help ensure that liquidity provisions can be disseminated efficiently even when the unsecured interbank markets are under stress. The TAF typically auctions term funds with 28-day or 84-day maturities and is available to all depository institutions that are judged to be in generally sound financial condition by their local Federal Reserve Bank. Additionally, all TAF credit must be fully collateralized.
Term Securities Lending Facility (TSLF) – A weekly loan facility established and announced by the Federal Reserve on March 11, 2008 to promote liquidity in U.S. Treasury and other collateral markets and foster the functioning of financial markets by offering U.S. Treasury securities held by the System Open Market Account (SOMA) for loan over a one-month term against other program-eligible general collateral. Loans are awarded to primary dealers based on competitive bidding, subject to a minimum fee requirement. The Open Market Trading Desk of the Federal Reserve Bank of New York auctions general U.S. Treasury collateral (treasury bills, notes, bonds and inflation-indexed securities) held by SOMA for loan against all collateral currently eligible for tri-party repurchase agreements arranged by the Open Market Trading Desk and separately against collateral and investment-grade corporate securities, municipal securities, MBS and ABS.
Tier 1 Common Capital – Tier 1 capital including CES, less preferred stock, qualifying trust preferred securities, hybrid securities and qualifying noncontrolling interest in subsidiaries.
Troubled Asset Relief Program (TARP) – A program established under the EESA by the U.S. Treasury to, among other things, invest in financial institutions through capital infusions and purchase mortgages, MBS and certain other financial instruments from financial institutions, in an aggregate amount up to $700 billion, for the purpose of stabilizing and providing liquidity to the U.S. financial markets.
Troubled Debt Restructuring (TDR) – Loans whose contractual terms have been restructured in a manner that grants a concession to a borrower experiencing financial difficulties. Concessions could include a reduction in the interest rate on the loan, payment extensions, forgiveness of principal, forbearance or other actions intended to maximize collection. TDRs are reported as nonperforming loans and leases while on nonaccrual status. TDRs that are on accrual status are reported as performing TDRs through the end of the calendar year in which the restructuring occurred or the year in which they are returned to accrual status. In addition, if accruing TDRs bear less than a market rate of interest at the time of modification, they are reported as performing TDRs throughout their remaining lives.
Unrecognized Tax Benefit (UTB) – The difference between the benefit recognized for a tax position, which is measured as the largest dollar amount of the position that is more-likely-than-not to be sustained upon settlement, and the tax benefit claimed on a tax return.
Value-at-risk (VAR) – A VAR model estimates a range of hypothetical scenarios to calculate a potential loss which is not expected to be exceeded with a specified confidence level. VAR is a key statistic used to measure and manage market risk.
Variable Interest Entity (VIE) – A term for an entity whose equity investors do not have a controlling financial interest. The entity may not have sufficient equity at risk to finance its activities without additional subordinated financial support from third parties. The equity investors may lack the ability to make significant decisions about the entity's activities, or they may not absorb the losses or receive the residual returns generated by the assets and other contractual arrangements of the VIE. The entity that will absorb a majority of expected variability (the sum of the absolute values of the expected losses and expected residual returns) consolidates the VIE and is referred to as the primary beneficiary.
| 110 | Bank of America 2009 |
Acronyms
| ABCP | Asset-backed commercial paper | |
| ABS | Asset-backed securities | |
| AFS | Available-for-sale | |
| ALMRC | Asset and Liability Market Risk Committee | |
| ALM | Asset and liability management | |
| ARM | Adjustable-rate mortgage | |
| ARS | Auction rate securities | |
| ASF | American Securitization Forum | |
| BPS | Basis points | |
| CDO | Collateralized debt obligation | |
| CES | Common Equivalent Securities | |
| CMBS | Commercial mortgage-backed securities | |
| CMO | Collateralized mortgage obligation | |
| CRA | Community Reinvestment Act | |
| CRC | Credit Risk Committee | |
| FASB | Financial Accounting Standards Board | |
| FDIC | Federal Deposit Insurance Corporation | |
| FFIEC | Federal Financial Institutions Examination Council | |
| FHA | Federal Housing Administration | |
| FHLB | Federal Home Loan Bank | |
| FHLMC | Federal Home Loan Mortgage Corporation | |
| FICC | Fixed income, currencies and commodities | |
| FNMA | Federal National Mortgage Association | |
| FTE | Fully taxable-equivalent | |
| GAAP | Generally accepted accounting principles in the United States of America | |
| GNMA | Government National Mortgage Association | |
| GRC | Global Markets Risk Committee | |
| GSE | Government-sponsored enterprise | |
| IPO | Initial public offering | |
| LHFS | Loans held-for-sale | |
| LIBOR | London InterBank Offered Rate | |
| MBS | Mortgage-backed securities | |
| MD&A | Management's Discussion and Analysis of Financial Condition and Results of Operations | |
| MSA | Metropolitan statistical area | |
| OCI | Other comprehensive income | |
| RMBS | Residential mortgage-backed securities | |
| ROC | Risk Oversight Committee | |
| ROTE | Return on average tangible shareholders' equity | |
| SBA | Small Business Administration | |
| SBLCs | Standby letters of credit | |
| SEC | Securities and Exchange Commission | |
| SPE | Special purpose entity | |
| Bank of America 2009 | 111 |
Item 7A. QUANTITATIVE AND QUALITATIVE DISCLOSURES ABOUT MARKET RISK
See Market Risk Management in the MD&A beginning on page 79 which is incorporated herein by reference.
Item 8. FINANCIAL STATEMENTS AND SUPPLEMENTARY DATA
Report of Management on Internal Control
Over Financial Reporting
The management of Bank of America Corporation is responsible for establishing and maintaining adequate internal control over financial reporting.
The Corporation's internal control over financial reporting is a process designed to provide reasonable assurance regarding the reliability of financial reporting and the preparation of financial statements for external purposes in accordance with accounting principles generally accepted in the United States of America. The Corporation's internal control over financial reporting includes those policies and procedures that (i) pertain to the maintenance of records that, in reasonable detail, accurately and fairly reflect the transactions and dispositions of the assets of the Corporation; (ii) provide reasonable assurance that transactions are recorded as necessary to permit preparation of financial statements in accordance with accounting principles generally accepted in the United States of America, and that receipts and expenditures of the Corporation are being made only in accordance with authorizations of management and directors of the Corporation; and (iii) provide reasonable assurance regarding prevention or timely detection of unauthorized acquisition, use, or disposition of the Corporation's assets that could have a material effect on the financial statements.
Because of its inherent limitations, internal control over financial reporting may not prevent or detect misstatements. Also, projections of any evaluation of effectiveness to future periods are subject to the risk that controls may become inadequate because of changes in conditions, or that the degree of compliance with the policies or procedures may deteriorate.
Management assessed the effectiveness of the Corporation's internal control over financial reporting as of December 31, 2009, based on the framework set forth by the Committee of Sponsoring Organizations of the
Treadway Commission in Internal Control – Integrated Framework . Based on that assessment, management concluded that, as of December 31, 2009, the Corporation's internal control over financial reporting is effective based on the criteria established in Internal Control – Integrated Framework .
The Corporation's internal control over financial reporting as of December 31, 2009 has been audited by PricewaterhouseCoopers, LLP, an independent registered public accounting firm, as stated in their accompanying report which expresses an unqualified opinion on the effectiveness of the Corporation's internal control over financial reporting as of December 31, 2009.

Brian T. Moynihan
Chief Executive Officer and President

Neil A. Cotty
Interim Chief Financial Officer
Chief Accounting Officer
| 112 | Bank of America 2009 |
Report of Independent Registered Public Accounting Firm
To the Board of Directors and Shareholders of Bank of America Corporation:
In our opinion, the accompanying Consolidated Balance Sheet and the related Consolidated Statement of Income, Consolidated Statement of Changes in Shareholders' Equity and Consolidated Statement of Cash Flows present fairly, in all material respects, the financial position of Bank of America Corporation and its subsidiaries at December 31, 2009 and 2008, and the results of their operations and their cash flows for each of the three years in the period ended December 31, 2009 in conformity with accounting principles generally accepted in the United States of America. Also in our opinion, the Corporation maintained, in all material respects, effective internal control over financial reporting as of December 31, 2009, based on criteria established in Internal Control – Integrated Framework issued by the Committee of Sponsoring Organizations of the Treadway Commission (COSO). The Corporation's management is responsible for these financial statements, for maintaining effective internal control over financial reporting and for its assessment of the effectiveness of internal control over financial reporting, included in the accompanying Report of Management on Internal Control Over Financial Reporting. Our responsibility is to express opinions on these financial statements and on the Corporation's internal control over financial reporting based on our integrated audits. We conducted our audits in accordance with the standards of the Public Company Accounting Oversight Board (United States). Those standards require that we plan and perform the audits to obtain reasonable assurance about whether the financial statements are free of material misstatement and whether effective internal control over financial reporting was maintained in all material respects. Our audits of the financial statements included examining, on a test basis, evidence supporting the amounts and disclosures in the financial statements, assessing the accounting principles used and significant estimates made by management, and evaluating the overall financial statement presentation. Our audit of internal control over financial report -
ing included obtaining an understanding of internal control over financial reporting, assessing the risk that a material weakness exists, and testing and evaluating the design and operating effectiveness of internal control based on the assessed risk. Our audits also included performing such other procedures as we considered necessary in the circumstances. We believe that our audits provide a reasonable basis for our opinions.
A company's internal control over financial reporting is a process designed to provide reasonable assurance regarding the reliability of financial reporting and the preparation of financial statements for external purposes in accordance with generally accepted accounting principles. A company's internal control over financial reporting includes those policies and procedures that (i) pertain to the maintenance of records that, in reasonable detail, accurately and fairly reflect the transactions and dispositions of the assets of the company; (ii) provide reasonable assurance that transactions are recorded as necessary to permit preparation of financial statements in accordance with generally accepted accounting principles, and that receipts and expenditures of the company are being made only in accordance with authorizations of management and directors of the company; and (iii) provide reasonable assurance regarding prevention or timely detection of unauthorized acquisition, use, or disposition of the company's assets that could have a material effect on the financial statements.
Because of its inherent limitations, internal control over financial reporting may not prevent or detect misstatements. Also, projections of any evaluation of effectiveness to future periods are subject to the risk that controls may become inadequate because of changes in conditions, or that the degree of compliance with the policies or procedures may deteriorate.

Charlotte, North Carolina
February 26, 2010
| Bank of America 2009 | 113 |
Bank of America Corporation and Subsidiaries
Consolidated Statement of Income
| Year Ended December 31 | ||||||||||||
| (Dollars in millions, except per share information) | 2009 | 2008 | 2007 | |||||||||
Interest income | ||||||||||||
Interest and fees on loans and leases | $ | 48,703 | $ | 56,017 | $ | 55,681 | ||||||
Interest on debt securities | 12,947 | 13,146 | 9,784 | |||||||||
Federal funds sold and securities borrowed or purchased under agreements to resell | 2,894 | 3,313 | 7,722 | |||||||||
Trading account assets | 7,944 | 9,057 | 9,417 | |||||||||
Other interest income | 5,428 | 4,151 | 4,700 | |||||||||
Total interest income | 77,916 | 85,684 | 87,304 | |||||||||
Interest expense | ||||||||||||
Deposits | 7,807 | 15,250 | 18,093 | |||||||||
Short-term borrowings | 5,512 | 12,362 | 21,967 | |||||||||
Trading account liabilities | 2,075 | 2,774 | 3,444 | |||||||||
Long-term debt | 15,413 | 9,938 | 9,359 | |||||||||
Total interest expense | 30,807 | 40,324 | 52,863 | |||||||||
Net interest income | 47,109 | 45,360 | 34,441 | |||||||||
Noninterest income | ||||||||||||
Card income | 8,353 | 13,314 | 14,077 | |||||||||
Service charges | 11,038 | 10,316 | 8,908 | |||||||||
Investment and brokerage services | 11,919 | 4,972 | 5,147 | |||||||||
Investment banking income | 5,551 | 2,263 | 2,345 | |||||||||
Equity investment income | 10,014 | 539 | 4,064 | |||||||||
Trading account profits (losses) | 12,235 | (5,911 | ) | (4,889 | ) | |||||||
Mortgage banking income | 8,791 | 4,087 | 902 | |||||||||
Insurance income | 2,760 | 1,833 | 761 | |||||||||
Gains on sales of debt securities | 4,723 | 1,124 | 180 | |||||||||
Other income (loss) | (14 | ) | (1,654 | ) | 1,295 | |||||||
Other-than-temporary impairment losses on available-for-sale debt securities: | ||||||||||||
Total other-than-temporary impairment losses | (3,508 | ) | (3,461 | ) | (398 | ) | ||||||
Less: Portion of other-than-temporary impairment losses recognized in other comprehensive income | 672 | – | – | |||||||||
Net impairment losses recognized in earnings on available-for-sale debt securities | (2,836 | ) | (3,461 | ) | (398 | ) | ||||||
Total noninterest income | 72,534 | 27,422 | 32,392 | |||||||||
Total revenue, net of interest expense | 119,643 | 72,782 | 66,833 | |||||||||
Provision for credit losses | 48,570 | 26,825 | 8,385 | |||||||||
Noninterest expense | ||||||||||||
Personnel | 31,528 | 18,371 | 18,753 | |||||||||
Occupancy | 4,906 | 3,626 | 3,038 | |||||||||
Equipment | 2,455 | 1,655 | 1,391 | |||||||||
Marketing | 1,933 | 2,368 | 2,356 | |||||||||
Professional fees | 2,281 | 1,592 | 1,174 | |||||||||
Amortization of intangibles | 1,978 | 1,834 | 1,676 | |||||||||
Data processing | 2,500 | 2,546 | 1,962 | |||||||||
Telecommunications | 1,420 | 1,106 | 1,013 | |||||||||
Other general operating | 14,991 | 7,496 | 5,751 | |||||||||
Merger and restructuring charges | 2,721 | 935 | 410 | |||||||||
Total noninterest expense | 66,713 | 41,529 | 37,524 | |||||||||
Income before income taxes | 4,360 | 4,428 | 20,924 | |||||||||
Income tax expense (benefit) | (1,916 | ) | 420 | 5,942 | ||||||||
Net income | $ | 6,276 | $ | 4,008 | $ | 14,982 | ||||||
Preferred stock dividends and accretion | 8,480 | 1,452 | 182 | |||||||||
Net income (loss) applicable to common shareholders | $ | (2,204 | ) | $ | 2,556 | $ | 14,800 | |||||
Per common share information | ||||||||||||
Earnings (loss) | $ | (0.29 | ) | $ | 0.54 | $ | 3.32 | |||||
Diluted earnings (loss) | (0.29 | ) | 0.54 | 3.29 | ||||||||
Dividends paid | 0.04 | 2.24 | 2.40 | |||||||||
Average common shares issued and outstanding (in thousands) | 7,728,570 | 4,592,085 | 4,423,579 | |||||||||
Average diluted common shares issued and outstanding (in thousands) | 7,728,570 | 4,596,428 | 4,463,213 | |||||||||
See accompanying Notes to Consolidated Financial Statements.
| 114 | Bank of America 2009 |
Bank of America Corporation and Subsidiaries
Consolidated Balance Sheet
| December 31 | ||||||||
| (Dollars in millions) | 2009 | 2008 | ||||||
Assets | ||||||||
Cash and cash equivalents | $ | 121,339 | $ | 32,857 | ||||
Time deposits placed and other short-term investments | 24,202 | 9,570 | ||||||
Federal funds sold and securities borrowed or purchased under agreements to resell (includes $57,775 and $2,330 measured at fair value and $189,844 and $82,099 pledged as collateral) | 189,933 | 82,478 | ||||||
Trading account assets (includes $30,921 and $69,348 pledged as collateral) | 182,206 | 134,315 | ||||||
Derivative assets | 80,689 | 62,252 | ||||||
Debt securities: | ||||||||
Available-for-sale (includes $122,708 and $158,939 pledged as collateral) | 301,601 | 276,904 | ||||||
Held-to-maturity, at cost (fair value – $9,684 and $685) | 9,840 | 685 | ||||||
Total debt securities | 311,441 | 277,589 | ||||||
Loans and leases (includes $4,936 and $5,413 measured at fair value and $118,113 and $166,891 pledged as collateral) | 900,128 | 931,446 | ||||||
Allowance for loan and lease losses | (37,200 | ) | (23,071 | ) | ||||
Loans and leases, net of allowance | 862,928 | 908,375 | ||||||
Premises and equipment, net | 15,500 | 13,161 | ||||||
Mortgage servicing rights (includes $19,465 and $12,733 measured at fair value) | 19,774 | 13,056 | ||||||
Goodwill | 86,314 | 81,934 | ||||||
Intangible assets | 12,026 | 8,535 | ||||||
Loans held-for-sale (includes $32,795 and $18,964 measured at fair value) | 43,874 | 31,454 | ||||||
Customer and other receivables | 81,996 | 37,608 | ||||||
Other assets (includes $55,909 and $55,113 measured at fair value) | 191,077 | 124,759 | ||||||
Total assets | $ | 2,223,299 | $ | 1,817,943 | ||||
Liabilities | ||||||||
Deposits in domestic offices: | ||||||||
Noninterest-bearing | $ | 269,615 | $ | 213,994 | ||||
Interest-bearing (includes $1,663 and $1,717 measured at fair value) | 640,789 | 576,938 | ||||||
Deposits in foreign offices: | ||||||||
Noninterest-bearing | 5,489 | 4,004 | ||||||
Interest-bearing | 75,718 | 88,061 | ||||||
Total deposits | 991,611 | 882,997 | ||||||
Federal funds purchased and securities loaned or sold under agreements to repurchase (includes | 255,185 | 206,598 | ||||||
Trading account liabilities | 65,432 | 51,723 | ||||||
Derivative liabilities | 43,728 | 30,709 | ||||||
Commercial paper and other short-term borrowings (includes $813 measured at | 69,524 | 158,056 | ||||||
Accrued expenses and other liabilities (includes $19,015 and $7,542 measured at fair value and $1,487 and $421 of reserve for unfunded lending commitments) | 127,854 | 42,516 | ||||||
Long-term debt (includes $45,451 measured at fair value at December 31, 2009) | 438,521 | 268,292 | ||||||
Total liabilities | 1,991,855 | 1,640,891 | ||||||
Commitments and contingencies ( Note 9 – Variable Interest Entities and Note 14 – Commitments and Contingencies ) | ||||||||
Shareholders' equity | ||||||||
Preferred stock, $0.01 par value; authorized – 100,000,000 shares; issued and outstanding – 5,246,660 and 8,202,042 shares | 37,208 | 37,701 | ||||||
Common stock and additional paid-in capital, $0.01 par value; authorized – 10,000,000,000 shares; issued and outstanding – 8,650,243,926 and 5,017,435,592 shares | 128,734 | 76,766 | ||||||
Retained earnings | 71,233 | 73,823 | ||||||
Accumulated other comprehensive income (loss) | (5,619 | ) | (10,825 | ) | ||||
Other | (112 | ) | (413 | ) | ||||
Total shareholders' equity | 231,444 | 177,052 | ||||||
Total liabilities and shareholders' equity | $ | 2,223,299 | $ | 1,817,943 | ||||
See accompanying Notes to Consolidated Financial Statements.
| Bank of America 2009 | 115 |
Bank of America Corporation and Subsidiaries
Consolidated Statement of Changes in Shareholders' Equity
| (Dollars in millions, shares in thousands) | Preferred Stock | Common Stock and Additional Paid-in Capital | Retained Earnings | Accumulated (Loss) | Other | Total Shareholders' Equity | Comprehensive Income (Loss) | ||||||||||||||||||||||||
| Shares | Amount | ||||||||||||||||||||||||||||||
Balance, December 31, 2006 | $ | 2,851 | 4,458,151 | $ | 61,574 | $ | 79,024 | $ | (7,711 | ) | $ | (466 | ) | $ | 135,272 | ||||||||||||||||
Cumulative adjustment for accounting changes: | |||||||||||||||||||||||||||||||
Leveraged leases | (1,381 | ) | (1,381 | ) | |||||||||||||||||||||||||||
Fair value option and measurement | (208 | ) | (208 | ) | |||||||||||||||||||||||||||
Income tax uncertainties | (146 | ) | (146 | ) | |||||||||||||||||||||||||||
Net income | 14,982 | 14,982 | $ | 14,982 | |||||||||||||||||||||||||||
Net change in available-for-sale debt and marketable | 9,269 | 9,269 | 9,269 | ||||||||||||||||||||||||||||
Net change in foreign currency translation adjustments | 149 | 149 | 149 | ||||||||||||||||||||||||||||
Net change in derivatives | (705 | ) | (705 | ) | (705 | ) | |||||||||||||||||||||||||
Employee benefit plan adjustments | 127 | 127 | 127 | ||||||||||||||||||||||||||||
Dividends paid: | |||||||||||||||||||||||||||||||
Common | (10,696 | ) | (10,696 | ) | |||||||||||||||||||||||||||
Preferred | (182 | ) | (182 | ) | |||||||||||||||||||||||||||
Issuance of preferred stock | 1,558 | 1,558 | |||||||||||||||||||||||||||||
Common stock issued under employee plans and | 53,464 | 2,544 | 10 | 2,554 | |||||||||||||||||||||||||||
Common stock repurchased | (73,730 | ) | (3,790 | ) | (3,790 | ) | |||||||||||||||||||||||||
Balance, December 31, 2007 | 4,409 | 4,437,885 | 60,328 | 81,393 | 1,129 | (456 | ) | 146,803 | 23,822 | ||||||||||||||||||||||
Net income | 4,008 | 4,008 | 4,008 | ||||||||||||||||||||||||||||
Net change in available-for-sale debt and marketable | (8,557 | ) | (8,557 | ) | (8,557 | ) | |||||||||||||||||||||||||
Net change in foreign currency translation adjustments | (1,000 | ) | (1,000 | ) | (1,000 | ) | |||||||||||||||||||||||||
Net change in derivatives | 944 | 944 | 944 | ||||||||||||||||||||||||||||
Employee benefit plan adjustments | (3,341 | ) | (3,341 | ) | (3,341 | ) | |||||||||||||||||||||||||
Dividends paid: | |||||||||||||||||||||||||||||||
Common | (10,256 | ) | (10,256 | ) | |||||||||||||||||||||||||||
Preferred | (1,272 | ) | (1,272 | ) | |||||||||||||||||||||||||||
Issuance of preferred stock and stock warrants | 33,242 | 1,500 | 34,742 | ||||||||||||||||||||||||||||
Stock issued in acquisition | 106,776 | 4,201 | 4,201 | ||||||||||||||||||||||||||||
Issuance of common stock | 455,000 | 9,883 | 9,883 | ||||||||||||||||||||||||||||
Common stock issued under employee plans and | 17,775 | 854 | 43 | 897 | |||||||||||||||||||||||||||
Other | 50 | (50 | ) | – | |||||||||||||||||||||||||||
Balance, December 31, 2008 | 37,701 | 5,017,436 | 76,766 | 73,823 | (10,825 | ) | (413 | ) | 177,052 | (7,946 | ) | ||||||||||||||||||||
Cumulative adjustment for accounting change: | |||||||||||||||||||||||||||||||
Other-than-temporary impairment on debt securities | 71 | (71 | ) | – | |||||||||||||||||||||||||||
Net income | 6,276 | 6,276 | 6,276 | ||||||||||||||||||||||||||||
Net change in available-for-sale debt and marketable | 3,593 | 3,593 | 3,593 | ||||||||||||||||||||||||||||
Net change in foreign currency translation adjustments | 211 | 211 | 211 | ||||||||||||||||||||||||||||
Net change in derivatives | 923 | 923 | 923 | ||||||||||||||||||||||||||||
Employee benefit plan adjustments | 550 | 550 | 550 | ||||||||||||||||||||||||||||
Dividends paid: | |||||||||||||||||||||||||||||||
Common | (326 | ) | (326 | ) | |||||||||||||||||||||||||||
Preferred | (4,537 | ) | (4,537 | ) | |||||||||||||||||||||||||||
Issuance of preferred stock and stock warrants | 26,800 | 3,200 | 30,000 | ||||||||||||||||||||||||||||
Repayment of preferred stock | (41,014 | ) | (3,986 | ) | (45,000 | ) | |||||||||||||||||||||||||
Issuance of Common Equivalent Securities | 19,244 | 19,244 | |||||||||||||||||||||||||||||
Stock issued in acquisition | 8,605 | 1,375,476 | 20,504 | 29,109 | |||||||||||||||||||||||||||
Issuance of common stock | 1,250,000 | 13,468 | 13,468 | ||||||||||||||||||||||||||||
Exchange of preferred stock | (14,797 | ) | 999,935 | 14,221 | 576 | – | |||||||||||||||||||||||||
Common stock issued under employee plans and | 7,397 | 575 | 308 | 883 | |||||||||||||||||||||||||||
Other | 669 | (664 | ) | (7 | ) | (2 | ) | ||||||||||||||||||||||||
Balance, December 31, 2009 | $ | 37,208 | 8,650,244 | $ | 128,734 | $ | 71,233 | $ | (5,619 | ) | $ | (112 | ) | $ | 231,444 | $ | 11,553 | ||||||||||||||
See accompanying Notes to Consolidated Financial Statements.
| 116 | Bank of America 2009 |
Bank of America Corporation and Subsidiaries
Consolidated Statement of Cash Flows
| Year Ended December 31 | ||||||||||||
| (Dollars in millions) | 2009 | 2008 | 2007 | |||||||||
Operating activities | ||||||||||||
Net income | $ | 6,276 | $ | 4,008 | $ | 14,982 | ||||||
Reconciliation of net income to net cash provided by operating activities: | ||||||||||||
Provision for credit losses | 48,570 | 26,825 | 8,385 | |||||||||
Gains on sales of debt securities | (4,723 | ) | (1,124 | ) | (180 | ) | ||||||
Depreciation and premises improvements amortization | 2,336 | 1,485 | 1,168 | |||||||||
Amortization of intangibles | 1,978 | 1,834 | 1,676 | |||||||||
Deferred income tax expense (benefit) | 370 | (5,801 | ) | (753 | ) | |||||||
Net decrease (increase) in trading and derivative instruments | 59,822 | (16,973 | ) | (8,108 | ) | |||||||
Net decrease (increase) in other assets | 28,553 | (6,391 | ) | (15,855 | ) | |||||||
Net (decrease) increase in accrued expenses and other liabilities | (16,601 | ) | (8,885 | ) | 4,190 | |||||||
Other operating activities, net | 3,150 | 9,056 | 5,531 | |||||||||
Net cash provided by operating activities | 129,731 | 4,034 | 11,036 | |||||||||
Investing activities | ||||||||||||
Net decrease in time deposits placed and other short-term investments | 19,081 | 2,203 | 2,191 | |||||||||
Net decrease in federal funds sold and securities borrowed or purchased under agreements to resell | 31,369 | 53,723 | 6,294 | |||||||||
Proceeds from sales of available-for-sale debt securities | 164,155 | 120,972 | 28,107 | |||||||||
Proceeds from paydowns and maturities of available-for-sale debt securities | 59,949 | 26,068 | 19,233 | |||||||||
Purchases of available-for-sale debt securities | (185,145 | ) | (184,232 | ) | (28,016 | ) | ||||||
Proceeds from maturities of held-to-maturity debt securities | 2,771 | 741 | 630 | |||||||||
Purchases of held-to-maturity debt securities | (3,914 | ) | (840 | ) | (314 | ) | ||||||
Proceeds from sales of loans and leases | 7,592 | 52,455 | 57,875 | |||||||||
Other changes in loans and leases, net | 21,257 | (69,574 | ) | (177,665 | ) | |||||||
Net purchases of premises and equipment | (2,240 | ) | (2,098 | ) | (2,143 | ) | ||||||
Proceeds from sales of foreclosed properties | 1,997 | 1,187 | 104 | |||||||||
Cash received (paid) upon acquisition, net | 31,804 | 6,650 | (19,816 | ) | ||||||||
Other investing activities, net | 9,249 | (10,185 | ) | 5,040 | ||||||||
Net cash provided by (used in) investing activities | 157,925 | (2,930 | ) | (108,480 | ) | |||||||
Financing activities | ||||||||||||
Net increase in deposits | 10,507 | 14,830 | 45,368 | |||||||||
Net decrease in federal funds purchased and securities loaned or sold under agreements to repurchase | (62,993 | ) | (34,529 | ) | (1,448 | ) | ||||||
Net (decrease) increase in commercial paper and other short-term borrowings | (126,426 | ) | (33,033 | ) | 32,840 | |||||||
Proceeds from issuance of long-term debt | 67,744 | 43,782 | 67,370 | |||||||||
Retirement of long-term debt | (101,207 | ) | (35,072 | ) | (28,942 | ) | ||||||
Proceeds from issuance of preferred stock | 49,244 | 34,742 | 1,558 | |||||||||
Repayment of preferred stock | (45,000 | ) | – | – | ||||||||
Proceeds from issuance of common stock | 13,468 | 10,127 | 1,118 | |||||||||
Common stock repurchased | – | – | (3,790 | ) | ||||||||
Cash dividends paid | (4,863 | ) | (11,528 | ) | (10,878 | ) | ||||||
Excess tax benefits of share-based payments | – | 42 | 254 | |||||||||
Other financing activities, net | (42 | ) | (56 | ) | (38 | ) | ||||||
Net cash provided by (used in) financing activities | (199,568 | ) | (10,695 | ) | 103,412 | |||||||
Effect of exchange rate changes on cash and cash equivalents | 394 | (83 | ) | 134 | ||||||||
Net increase (decrease) in cash and cash equivalents |
| 88,482
|
| (9,674 | ) | 6,102 | ||||||
Cash and cash equivalents at January 1 | 32,857 | 42,531 | 36,429 | |||||||||
Cash and cash equivalents at December 31 | $ | 121,339 | $ | 32,857 | $ | 42,531 | ||||||
Supplemental cash flow disclosures | ||||||||||||
Cash paid for interest | $ | 37,602 | $ | 36,387 | $ | 51,829 | ||||||
Cash paid for income taxes | 2,933 | 4,700 | 9,196 | |||||||||
| During | 2009, the Corporation exchanged $14.8 billion of preferred stock by issuing 1.0 billion shares of common stock valued at $11.5 billion. |
During 2009, the Corporation transferred credit card loans of $8.5 billion and the related allowance for loan and lease losses of $750 million in exchange for a $7.8 billion held-to-maturity debt security that was issued by the Corporation's U.S. Credit Card Securitization Trust.
The fair values of noncash assets acquired and liabilities assumed in the Merrill Lynch acquisition were $618.4 billion and $626.2 billion at January 1, 2009.
Approximately 1.4 billion shares of common stock, valued at approximately $20.5 billion and 376 thousand shares of preferred stock valued at $8.6 billion were issued in connection with the Merrill Lynch acquisition.
The Corporation securitized $14.0 billion and $26.1 billion of residential mortgage loans into mortgage-backed securities and $0 and $4.9 billion of automobile loans into asset-backed securities which were retained by the Corporation during 2009 and 2008.
The fair values of noncash assets acquired and liabilities assumed in the Countrywide acquisition were $157.4 billion and $157.8 billion at July 1, 2008.
Approximately 107 million shares of common stock, valued at approximately $4.2 billion were issued in connection with the Countrywide acquisition.
The fair values of noncash assets acquired and liabilities assumed in the LaSalle Bank Corporation acquisition were $115.8 billion and $97.1 billion at October 1, 2007.
The fair values of noncash assets acquired and liabilities assumed in the U.S. Trust Corporation acquisition were $12.9 billion and $9.8 billion at July 1, 2007.
See accompanying Notes to Consolidated Financial Statements.
| Bank of America 2009 | 117 |
Bank of America Corporation and Subsidiaries
Notes to Consolidated Financial Statements
NOTE 1 – Summary of Significant Accounting Principles
Bank of America Corporation (the Corporation), through its banking and nonbanking subsidiaries, provides a diverse range of financial services and products throughout the U.S. and in certain international markets. At December 31, 2009, the Corporation operated its banking activities primarily under two charters: Bank of America, National Association (Bank of America, N.A.) and FIA Card Services, N.A. In connection with certain acquisitions including Merrill Lynch & Co. Inc. (Merrill Lynch) and Countrywide Financial Corporation (Countrywide), the Corporation acquired banking subsidiaries that have been merged into Bank of America, N.A. with no impact on the Consolidated Financial Statements of the Corporation.
On January 1, 2009, the Corporation acquired Merrill Lynch through its merger with a subsidiary of the Corporation in exchange for common and preferred stock with a value of $29.1 billion. On July 1, 2008, the Corporation acquired all of the outstanding shares of Countrywide through its merger with a subsidiary of the Corporation in exchange for common stock with a value of $4.2 billion. On October 1, 2007, the Corporation acquired all the outstanding shares of ABN AMRO North America Holding Company, parent of LaSalle Bank Corporation (LaSalle), for $21.0 billion in cash. On July 1, 2007, the Corporation acquired all the outstanding shares of U.S. Trust Corporation for $3.3 billion in cash.
The results of operations of the acquired companies were included in the Corporation's results from their dates of acquisition.
Principles of Consolidation and Basis of Presentation
The Consolidated Financial Statements include the accounts of the Corporation and its majority-owned subsidiaries, and those variable interest entities (VIEs) where the Corporation is the primary beneficiary. Intercompany accounts and transactions have been eliminated. Results of operations of acquired companies are included from the dates of acquisition and for VIEs, from the dates that the Corporation became the primary beneficiary. Assets held in an agency or fiduciary capacity are not included in the Consolidated Financial Statements. The Corporation accounts for investments in companies for which it owns a voting interest of 20 percent to 50 percent and for which it has the ability to exercise significant influence over operating and financing decisions using the equity method of accounting. These investments are included in other assets and are subject to impairment testing. The Corporation's proportionate share of income or loss is included in equity investment income.
The preparation of the Consolidated Financial Statements in conformity with accounting principles generally accepted in the United States of America (GAAP) requires management to make estimates and assumptions that affect reported amounts and disclosures. Realized results could differ from those estimates and assumptions.
The Corporation evaluates subsequent events through the date of filing with the Securities and Exchange Commission (SEC). Certain prior period amounts have been reclassified to conform to current period presentation.
New Accounting Pronouncements
On July 1, 2009, the Corporation adopted new guidance that established the Financial Accounting Standards Board (FASB) Accounting Standards Codification (Codification) as the single source of authoritative GAAP. The Codification establishes a common referencing system for accounting standards and is generally organized by subject matter. Use of the Codification has no impact on the Corporation's financial condition or results of operations. In connection with the use of the Codification, this Form 10-K no longer makes reference to specific accounting standards by number or title.
In June 2009, the FASB issued new accounting guidance on transfers of financial assets and consolidation of VIEs. This new accounting guidance, which was effective on January 1, 2010, revises existing sale accounting criteria for transfers of financial assets and significantly changes the criteria by which an enterprise determines whether it must consolidate a VIE. The adoption of this new accounting guidance on January 1, 2010 resulted in the consolidation of certain qualifying special purpose entities (QSPEs) and VIEs that were not recorded on the Corporation's Consolidated Balance Sheet prior to that date. The adoption of this new accounting guidance resulted in a net incremental increase in assets, on a preliminary basis, of approximately $100 billion, including $70 billion resulting from consolidation of credit card trusts and $30 billion from consolidation of other special purpose entities (SPEs) including multi-seller conduits. These amounts are net of retained interests in securitizations held on the Consolidated Balance Sheet and an $11 billion increase in the allowance for loan losses, the majority of which relates to credit card receivables. This increase in the allowance for loan losses was recorded on January 1, 2010 as a charge net-of-tax to retained earnings for the cumulative effect of the adoption of this new accounting guidance. Initial recording of these assets and related allowance on the Corporation's Consolidated Balance Sheet had no impact on results of operations.
On January 1, 2009, the Corporation elected to early adopt new FASB guidance for determining whether a market is inactive and a transaction is distressed in order to apply the existing fair value measurements guidance. In addition, this new guidance requires enhanced disclosures regarding financial assets and liabilities that are recorded at fair value. The adoption of this new guidance did not have a material impact on the Corporation's financial condition or results of operations. The enhanced disclosures required under this new guidance are included in Note 20 – Fair Value Measurements .
On January 1, 2009, the Corporation elected to early adopt new FASB guidance on recognition and presentation of other-than-temporary impairment of debt securities that requires an entity to recognize the credit component of other-than-temporary impairment of a debt security in earnings and the noncredit component in other comprehensive income (OCI) when the entity does not intend to sell the security and it is more-likely-than-not that the entity will not be required to sell the security prior to recovery. This new guidance also requires expanded disclosures. In connection with the adoption of this new guidance, the Corporation recorded a cumulative-effect adjustment to reclassify $71 million, net-of-tax, from retained earnings to accumulated OCI as of January 1,
| 118 | Bank of America 2009 |
2009. This new guidance does not change the recognition of other-than- temporary impairment for equity securities. The expanded disclosures required by this new guidance are included in Note 5 – Securities .
On January 1, 2009, the Corporation adopted new FASB guidance that modifies the accounting for business combinations and requires, with limited exceptions, the acquirer in a business combination to recognize 100 percent of the assets acquired, liabilities assumed and any noncontrolling interest in the acquired company at the acquisition-date fair value. In addition, the guidance requires that acquisition-related transaction and restructuring costs be charged to expense as incurred, and requires that certain contingent assets acquired and liabilities assumed, as well as contingent consideration, be recognized at fair value. This new guidance also modifies the accounting for certain acquired income tax assets and liabilities.
Further, the new FASB guidance requires that assets acquired and liabilities assumed in a business combination that arise from contingencies be recognized at fair value on the acquisition date if fair value can be determined during the measurement period. If fair value cannot be determined, companies should typically account for the acquired contingencies under existing accounting guidance. This new guidance is effective for acquisitions consummated on or after January 1, 2009. The Corporation applied this new guidance to its January 1, 2009 acquisition of Merrill Lynch.
On January 1, 2009, the Corporation adopted new FASB guidance that defines unvested share-based payment awards that contain nonforfeitable rights to dividends as participating securities that should be included in computing earnings per share (EPS) using the two-class method. Additionally, all prior-period EPS data was adjusted retrospectively. The adoption did not have a material impact on the Corporation's financial condition or results of operations.
On January 1, 2009, the Corporation adopted new FASB guidance that requires expanded qualitative, quantitative and credit-risk disclosures about derivatives and hedging activities and their effects on the Corporation's financial position, financial performance and cash flows. The adoption of this new guidance did not impact the Corporation's financial condition or results of operations. The expanded disclosures are included in Note 4 – Derivatives .
On January 1, 2009, the Corporation adopted new FASB guidance requiring all entities to report noncontrolling interests in subsidiaries as equity in the Consolidated Financial Statements and to account for transactions between an entity and noncontrolling owners as equity transactions if the parent retains its controlling financial interest in the subsidiary. This new guidance also requires expanded disclosure that distinguishes between the interests of the controlling owners and the interests of the noncontrolling owners of a subsidiary. Consolidated subsidiaries in which there are noncontrolling owners are insignificant to the Corporation.
For 2009, the Corporation adopted new accounting guidance that requires disclosures on plan assets for defined pension and other postretirement plans, including how investment decisions are made, the major categories of plan assets, the inputs and valuation techniques used to measure the fair value of plan assets, the effect of Level 3 measurements on changes in plan assets and concentrations of risk within plan assets. The expanded disclosures are included in Note 17 – Employee Benefit Plans .
Cash and Cash Equivalents
Cash and cash equivalents include cash on hand, cash items in the process of collection, and amounts due from correspondent banks and the Federal Reserve Bank.
Securities Financing Agreements
Securities borrowed or purchased under agreements to resell and securities loaned or sold under agreements to repurchase (securities financing agreements) are treated as collateralized financing transactions. These agreements are recorded at the amounts at which the securities were acquired or sold plus accrued interest, except for certain securities financing agreements which the Corporation accounts for under the fair value option. Changes in the value of securities financing agreements that are accounted for under the fair value option are recorded in other income. For more information on securities financing agreements which the Corporation accounts for under the fair value option, see Note 20 – Fair Value Measurements . The Corporation's policy is to obtain possession of collateral with a market value equal to or in excess of the principal amount loaned under resale agreements. To ensure that the market value of the underlying collateral remains sufficient, collateral is generally valued daily and the Corporation may require counterparties to deposit additional collateral or may return collateral pledged when appropriate.
Substantially all securities financing agreements are transacted under master repurchase agreements which give the Corporation, in the event of default, the right to liquidate securities held and to offset receivables and payables with the same counterparty. The Corporation offsets securities financing agreements with the same counterparty on the Consolidated Balance Sheet where it has such a master agreement. In transactions where the Corporation acts as the lender in a securities lending agreement and receives securities that can be pledged or sold as collateral, it recognizes an asset on the Consolidated Balance Sheet at fair value, representing the securities received, and a liability for the same amount, representing the obligation to return those securities.
Collateral
The Corporation accepts collateral that it is permitted by contract or custom to sell or repledge. At December 31, 2009, the fair value of this collateral was $156.9 billion of which $126.4 billion was sold or repledged. At December 31, 2008, the fair value of this collateral was $144.5 billion of which $117.6 billion was sold or repledged. The primary source of this collateral is repurchase agreements. The Corporation also pledges securities and loans as collateral in transactions that include repurchase agreements, public and trust deposits, U.S. Department of the Treasury (U.S. Treasury) tax and loan notes, and other short-term borrowings. This collateral can be sold or repledged by the counterparties to the transactions.
In addition, the Corporation obtains collateral in connection with its derivative contracts. Required collateral levels vary depending on the credit risk rating and the type of counterparty. Generally, the Corporation accepts collateral in the form of cash, U.S. Treasury securities and other marketable securities. Based on provisions contained in legal netting agreements, the Corporation nets cash collateral against the applicable derivative fair value. The Corporation also pledges collateral on its own derivative positions which can be applied against derivative liabilities.
Trading Instruments
Financial instruments utilized in trading activities are carried at fair value. Fair value is generally based on quoted market prices or quoted market prices for similar assets and liabilities. If these market prices are not available, fair values are estimated based on dealer quotes, pricing models, discounted cash flow methodologies, or similar techniques where the determination of fair value may require significant management judgment or estimation. Realized and unrealized gains and losses are recognized in trading account profits (losses).
| Bank of America 2009 | 119 |
Derivatives and Hedging Activities
Derivatives are held on behalf of customers, for trading, as economic hedges, or as qualifying accounting hedges, with the determination made when the Corporation enters into the derivative contract. The designation may change based upon management's reassessment or changing circumstances. Derivatives utilized by the Corporation include swaps, financial futures and forward settlement contracts, and option contracts. A swap agreement is a contract between two parties to exchange cash flows based on specified underlying notional amounts, assets and/or indices. Financial futures and forward settlement contracts are agreements to buy or sell a quantity of a financial instrument, index, currency or commodity at a predetermined future date, and rate or price. An option contract is an agreement that conveys to the purchaser the right, but not the obligation, to buy or sell a quantity of a financial instrument (including another derivative financial instrument), index, currency or commodity at a predetermined rate or price during a period or at a date in the future. Option agreements can be transacted on organized exchanges or directly between parties.
All derivatives are recorded on the Consolidated Balance Sheet at fair value, taking into consideration the effects of legally enforceable master netting agreements that allow the Corporation to settle positive and negative positions and offset cash collateral held with the same counterparty on a net basis. For exchange-traded contracts, fair value is based on quoted market prices. For non-exchange traded contracts, fair value is based on dealer quotes, pricing models, discounted cash flow methodologies, or similar techniques for which the determination of fair value may require significant management judgment or estimation.
Valuations of derivative assets and liabilities reflect the value of the instrument including counterparty credit risk. These values also take into account the Corporation's own credit standing, thus including in the valuation of the derivative instrument the value of the net credit differential between the counterparties to the derivative contract.
Trading Derivatives and Economic Hedges
Derivatives held for trading purposes are included in derivative assets or derivative liabilities with changes in fair value included in trading account profits (losses).
Derivatives used as economic hedges are also included in derivative assets or derivative liabilities. Changes in the fair value of derivatives that serve as economic hedges of mortgage servicing rights (MSRs), interest rate lock commitments (IRLCs) and first mortgage loans held-for-sale (LHFS) that are originated by the Corporation are recorded in mortgage banking income. Changes in the fair value of derivatives that serve as asset and liability management (ALM) economic hedges that do not qualify or were not designated as accounting hedges are recorded in other income (loss). Credit derivatives used by the Corporation as economic hedges do not qualify as accounting hedges despite being effective economic hedges, and changes in the fair value of these derivatives are included in other income (loss).
Derivatives Used For Hedge Accounting Purposes (Accounting Hedges)
For accounting hedges, the Corporation formally documents at inception all relationships between hedging instruments and hedged items, as well as the risk management objectives and strategies for undertaking various accounting hedges. Additionally, the Corporation uses dollar offset or regression analysis at the inception of a hedge and for each reporting period thereafter to assess whether the derivative used in its hedging transaction is expected to be and has been highly effective in offsetting changes in the fair value or cash flows of a hedged item. The Corporation discontinues hedge accounting when it is determined that a derivative is
not expected to be or has ceased to be highly effective as a hedge, and then reflects changes in fair value of the derivative in earnings after termination of the hedge relationship.
The Corporation uses its accounting hedges as either fair value hedges, cash flow hedges or hedges of net investments in foreign operations. The Corporation manages interest rate and foreign currency exchange rate sensitivity predominantly through the use of derivatives. Fair value hedges are used to protect against changes in the fair value of the Corporation's assets and liabilities that are due to interest rate or foreign exchange volatility. Cash flow hedges are used primarily to minimize the variability in cash flows of assets or liabilities, or forecasted transactions caused by interest rate or foreign exchange fluctuations. For terminated cash flow hedges, the maximum length of time over which forecasted transactions are hedged is 26 years, with a substantial portion of the hedged transactions being less than 10 years. For open or future cash flow hedges, the maximum length of time over which forecasted transactions are or will be hedged is less than seven years.
Changes in the fair value of derivatives designated as fair value hedges are recorded in earnings, together and in the same income statement line item with changes in the fair value of the related hedged item. Changes in the fair value of derivatives designated as cash flow hedges are recorded in accumulated OCI and are reclassified into the line item in the income statement in which the hedged item is recorded and in the same period the hedged item affects earnings. Hedge ineffectiveness and gains and losses on the excluded component of a derivative in assessing hedge effectiveness are recorded in earnings in the same income statement line item. The Corporation records changes in the fair value of derivatives used as hedges of the net investment in foreign operations, to the extent effective, as a component of accumulated OCI.
If a derivative instrument in a fair value hedge is terminated or the hedge designation removed, the previous adjustments to the carrying amount of the hedged asset or liability are subsequently accounted for in the same manner as other components of the carrying amount of that asset or liability. For interest-earning assets and interest-bearing liabilities, such adjustments are amortized to earnings over the remaining life of the respective asset or liability. If a derivative instrument in a cash flow hedge is terminated or the hedge designation is removed, related amounts in accumulated OCI are reclassified into earnings in the same period or periods during which the hedged forecasted transaction affects earnings. If it is probable that a forecasted transaction will not occur, any related amounts in accumulated OCI are reclassified into earnings in that period.
Interest Rate Lock Commitments
The Corporation enters into IRLCs in connection with its mortgage banking activities to fund residential mortgage loans at specified times in the future. IRLCs that relate to the origination of mortgage loans that will be held for sale are considered derivative instruments under applicable accounting guidance. As such, these IRLCs are recorded at fair value with changes in fair value recorded in mortgage banking income.
Effective January 1, 2008, the Corporation adopted new accounting guidance that requires that the expected net future cash flows related to servicing of a loan be included in the measurement of all written loan commitments accounted for at fair value through earnings. In estimating the fair value of an IRLC, the Corporation assigns a probability to the loan commitment based on an expectation that it will be exercised and the loan will be funded. The fair value of the commitments is derived from the fair value of related mortgage loans which is based on observable market data. Changes to the fair value of IRLCs are recognized based on interest rate changes, changes in the probability that the commitment will be exercised and the passage of time. Changes from the expected future
| 120 | Bank of America 2009 |
cash flows related to the customer relationship are excluded from the valuation of IRLCs. Prior to January 1, 2008, the Corporation did not record any unrealized gain or loss at the inception of a loan commitment, which is the time the commitment is issued to the borrower, as applicable accounting guidance at that time did not allow expected net future cash flows related to servicing of a loan to be included in the measurement of written loan commitments that are accounted for at fair value through earnings.
Outstanding IRLCs expose the Corporation to the risk that the price of the loans underlying the commitments might decline from inception of the rate lock to funding of the loan. To protect against this risk, the Corporation utilizes forward loan sales commitments and other derivative instruments, including interest rate swaps and options, to economically hedge the risk of potential changes in the value of the loans that would result from the commitments. The changes in the fair value of these derivatives are recorded in mortgage banking income.
Securities
Debt securities are classified based on management's intention on the date of purchase and recorded on the Consolidated Balance Sheet as debt securities as of the trade date. Debt securities which management has the intent and ability to hold to maturity are classified as held-to-maturity (HTM) and reported at amortized cost. Debt securities that are bought and held principally for the purpose of resale in the near term are classified as trading and are carried at fair value with unrealized gains and losses included in trading account profits (losses). Other debt securities are classified as available-for-sale (AFS) and carried at fair value with net unrealized gains and losses included in accumulated OCI on an after-tax basis.
The Corporation regularly evaluates each AFS and HTM debt security whose value has declined below amortized cost to assess whether the decline in fair value is other-than-temporary. In determining whether an impairment is other-than-temporary, the Corporation considers the severity and duration of the decline in fair value, the length of time expected for recovery, the financial condition of the issuer, and other qualitative factors, as well as whether the Corporation either plans to sell the security or it is more-likely-than-not that it will be required to sell the security before recovery of its amortized cost. Beginning in 2009, under new accounting guidance for impairments of debt securities that are deemed to be other-than-temporary, the credit component of an other-than-temporary impairment loss is recognized in earnings and the non-credit component is recognized in accumulated OCI in situations where the Corporation does not intend to sell the security and it is more- likely-than-not that the Corporation will not be required to sell the security prior to recovery. Prior to January 1, 2009, unrealized losses (both the credit and non-credit components) on AFS debt securities that were deemed to be other-than-temporary were included in current period earnings. If there is an other-than-temporary impairment in the fair value of any individual security classified as HTM, the Corporation writes down the security to fair value with a corresponding charge to other income.
Interest on debt securities, including amortization of premiums and accretion of discounts, is included in interest income. Realized gains and losses from the sales of debt securities, which are included in gains (losses) on sales of debt securities, are determined using the specific identification method.
Marketable equity securities are classified based on management's intention on the date of purchase and recorded on the Consolidated Balance Sheet as of the trade date. Marketable equity securities that are bought and held principally for the purpose of resale in the near term are classified as trading and are carried at fair value with unrealized gains and losses included in trading account profits (losses). Other marketable
equity securities are accounted for as AFS and classified in other assets. All AFS marketable equity securities are carried at fair value with net unrealized gains and losses included in accumulated OCI on an after-tax basis. If there is an other-than-temporary decline in the fair value of any individual AFS marketable equity security, the Corporation reclassifies the associated net unrealized loss out of accumulated OCI with a corresponding charge to equity investment income. Dividend income on all AFS marketable equity securities is included in equity investment income. Realized gains and losses on the sale of all AFS marketable equity securities, which are recorded in equity investment income, are determined using the specific identification method.
Equity investments without readily determinable fair values are recorded in other assets. Impairment testing is based on applicable accounting guidance and the cost basis is reduced when an impairment is deemed to be other-than-temporary.
Certain equity investments held by Global Principal Investments, the Corporation's diversified equity investor in private equity, real estate and other alternative investments, are subject to investment company accounting under applicable accounting guidance, and accordingly, are carried at fair value with changes in fair value reported in equity investment income. These investments are included in other assets. Initially, the transaction price of the investment is generally considered to be the best indicator of fair value. Thereafter, valuation of direct investments is based on an assessment of each individual investment using methodologies that include publicly traded comparables derived by multiplying a key performance metric (e.g., earnings before interest, taxes, depreciation and amortization) of the portfolio company by the relevant valuation multiple observed for comparable companies, acquisition comparables, entry level multiples and discounted cash flows, and are subject to appropriate discounts for lack of liquidity or marketability. Certain factors that may influence changes in fair value include but are not limited to, recapitalizations, subsequent rounds of financing and offerings in the equity or debt capital markets. For fund investments, the Corporation generally records the fair value of its proportionate interest in the fund's capital as reported by the fund's respective managers.
Other investments held by Global Principal Investments are accounted for under either the equity method or at cost, depending on the Corporation's ownership interest, and are reported in other assets.
Loans and Leases
Loans measured at historical cost are reported at their outstanding principal balances net of any unearned income, charge-offs, unamortized deferred fees and costs on originated loans, and for purchased loans, net of any premiums or discounts. Loan origination fees and certain direct origination costs are deferred and recognized as adjustments to income over the lives of the related loans. Unearned income, discounts and premiums are amortized to interest income using a level yield methodology. The Corporation elects to account for certain loans under the fair value option. Fair values for these loans are based on market prices, where available, or discounted cash flow analyses using market-based credit spreads of comparable debt instruments or credit derivatives of the specific borrower or comparable borrowers. Results of discounted cash flow analyses may be adjusted, as appropriate, to reflect other market conditions or the perceived credit risk of the borrower.
Purchased Impaired Loans
The Corporation purchases loans with and without evidence of credit quality deterioration since origination. Evidence of credit quality deterioration as of the purchase date may include statistics such as past due status, refreshed borrower credit scores and refreshed loan-to-value (LTV) ratios, some of which are not immediately available as of the purchase date. The
| Bank of America 2009 | 121 |
Corporation continues to evaluate this information and other credit-related information as it becomes available. Interest income on purchased non-impaired loans is recognized using a level yield methodology based on the contractually required payments receivable. For purchased impaired loans, applicable accounting guidance addresses the accounting for differences between contractual cash flows and expected cash flows from the Corporation's initial investment in loans if those differences are attributable, at least in part, to credit quality. The excess of the cash flows expected to be collected measured as of the acquisition date over the estimated fair value is referred to as the accretable yield and is recognized in interest income over the remaining life of the loan using a level yield methodology. The difference between contractually required payments as of acquisition date and the cash flows expected to be collected is referred to as the nonaccretable difference.
The initial fair values for purchased impaired loans are determined by discounting both principal and interest cash flows expected to be collected using an observable discount rate for similar instruments with adjustments that management believes a market participant would consider in determining fair value. The Corporation estimates the cash flows expected to be collected upon acquisition using internal credit risk, interest rate and prepayment risk models that incorporate management's best estimate of current key assumptions such as default rates, loss severity and payment speeds.
Subsequent decreases to expected principal cash flows result in a charge to provision for credit losses and a corresponding increase to a valuation allowance included in the allowance for loan and lease losses. Subsequent increases in expected principal cash flows result in a recovery of any previously recorded allowance for loan and lease losses, to the extent applicable, and a reclassification from nonaccretable difference to accretable yield for any remaining increase. Changes in expected interest cash flows may result in reclassifications to/from the nonaccretable difference. Loan disposals, which may include sales of loans, receipt of payments in full from the borrower, foreclosure or troubled debt restructuring (TDR), result in removal of the loan from the purchased impaired loan pool at its allocated carrying amount.
Leases
The Corporation provides equipment financing to its customers through a variety of lease arrangements. Direct financing leases are carried at the aggregate of lease payments receivable plus estimated residual value of the leased property less unearned income. Leveraged leases, which are a form of financing leases, are carried net of nonrecourse debt. Unearned income on leveraged and direct financing leases is accreted to interest income over the lease terms using methods that approximate the interest method.
Allowance for Credit Losses
The allowance for credit losses, which includes the allowance for loan and lease losses and the reserve for unfunded lending commitments, represents management's estimate of probable losses inherent in the Corporation's lending activities. The allowance for loan and lease losses and the reserve for unfunded lending commitments exclude amounts for loans and unfunded lending commitments accounted for under the fair value option as the fair values of these instruments already reflect a credit component. The allowance for loan and lease losses represents the estimated probable credit losses in funded consumer and commercial loans and leases while the reserve for unfunded lending commitments, including standby letters of credit (SBLCs) and binding unfunded loan commitments, represents estimated probable credit losses on these unfunded credit instruments based on utilization assumptions. Credit exposures deemed to be uncollectible, excluding derivative assets, trad -
ing account assets and loans carried at fair value, are charged against these accounts. Cash recovered on previously charged off amounts is recorded as a recovery to these accounts.
The Corporation performs periodic and systematic detailed reviews of its lending portfolios to identify credit risks and to assess the overall collectability of those portfolios. The allowance on certain homogeneous loan portfolios, which generally consist of consumer loans (e.g., consumer real estate and credit card loans) and certain commercial loans (e.g., business card and small business portfolios), is based on aggregated portfolio segment evaluations generally by product type. Loss forecast models are utilized for these portfolios which consider a variety of factors including, but not limited to, historical loss experience, estimated defaults or foreclosures based on portfolio trends, delinquencies, economic conditions and credit scores. These models are updated on a quarterly basis to incorporate information reflecting the current economic environment. The loss forecasts also incorporate the estimated increased volume and impact of consumer real estate loan modification programs, including losses associated with estimated re-default after modification.
The remaining commercial portfolios are reviewed on an individual loan basis. Loans subject to individual reviews are analyzed and segregated by risk according to the Corporation's internal risk rating scale. These risk classifications, in conjunction with an analysis of historical loss experience, current economic conditions, industry performance trends, geographic or obligor concentrations within each portfolio segment, and any other pertinent information (including individual valuations on nonperforming loans) result in the estimation of the allowance for credit losses. The historical loss experience is updated quarterly to incorporate the most recent data reflecting the current economic environment.
If necessary, a specific allowance is established for individual impaired loans. A loan is considered impaired when, based on current information and events, it is probable that the Corporation will be unable to collect all amounts due, including principal and interest, according to the contractual terms of the agreement, and once a loan has been identified as individually impaired, management measures impairment. Individually impaired loans are measured based on the present value of payments expected to be received, observable market prices, or for loans that are solely dependent on the collateral for repayment, the estimated fair value of the collateral less estimated costs to sell. If the recorded investment in impaired loans exceeds this amount, a specific allowance is established as a component of the allowance for loan and lease losses.
Purchased impaired loans are recorded at fair value and applicable accounting guidance prohibits the carrying over or creation of valuation allowances in the initial accounting for impaired loans acquired in a transfer. This applies to the purchase of an individual loan, a pool of loans and portfolios of loans acquired in a purchase business combination. Subsequent to acquisition, decreases in expected principal cash flows of purchased impaired loans are recorded as a valuation allowance included in the allowance for loan and lease losses. Subsequent increases in expected principal cash flows result in a recovery of any previously recorded allowance for loan and lease losses, to the extent applicable. Write-downs on purchased impaired loans in excess of the nonaccretable difference are charged against the allowance for loan and lease losses. For more information on the purchased impaired portfolios associated with acquisitions, see Note 6 – Outstanding Loans and Leases .
The allowance for loan and lease losses includes two components that are allocated to cover the estimated probable losses in each loan and lease category based on the results of the Corporation's detailed review process described above. The first component covers those commercial loans that are either nonperforming or impaired and
| 122 | Bank of America 2009 |
consumer real estate loans that have been modified as TDRs. These loans are subject to impairment measurement at the loan level based on the present value of expected future cash flows discounted at the loan's contractual effective interest rate. Where the present value is less than the recorded investment in the loan, impairment is recognized through the provision for credit losses with a corresponding increase in the allowance for loan and lease losses. The second component covers consumer loans and performing commercial loans and leases. Included within this second component of the allowance for loan and lease losses and determined separately from the procedures outlined above are reserves which are maintained to cover uncertainties that affect the Corporation's estimate of probable losses including domestic and global economic uncertainty and large single name defaults. Management evaluates the adequacy of the allowance for loan and lease losses based on the combined total of these two components.
In addition to the allowance for loan and lease losses, the Corporation also estimates probable losses related to unfunded lending commitments, such as letters of credit and financial guarantees, and binding unfunded loan commitments. The reserve for unfunded lending commitments excludes commitments accounted for under the fair value option. Unfunded lending commitments are subject to individual reviews and are analyzed and segregated by risk according to the Corporation's internal risk rating scale. These risk classifications, in conjunction with an analysis of historical loss experience, utilization assumptions, current economic conditions, performance trends within specific portfolio segments and any other pertinent information, result in the estimation of the reserve for unfunded lending commitments.
The allowance for credit losses related to the loan and lease portfolio is reported separately on the Consolidated Balance Sheet whereas the reserve for unfunded lending commitments is reported on the Consolidated Balance Sheet in accrued expenses and other liabilities. Provision for credit losses related to the loan and lease portfolio and unfunded lending commitments is reported in the Consolidated Statement of Income.
Nonperforming Loans and Leases, Charge-offs and Delinquencies
Nonperforming loans and leases generally include loans and leases that have been placed on nonaccrual status including nonaccruing loans whose contractual terms have been restructured in a manner that grants a concession to a borrower experiencing financial difficulties. Loans accounted for under the fair value option, purchased impaired loans and LHFS are not reported as nonperforming loans and leases.
In accordance with the Corporation's policies, non-bankrupt credit card loans and unsecured consumer loans are charged off no later than the end of the month in which the account becomes 180 days past due. The outstanding balance of real estate-secured loans that is in excess of the estimated property value, less cost to sell, is charged off no later than the end of the month in which the account becomes 180 days past due unless repayment of the loan is guaranteed by the Federal Housing Administration (FHA). Personal property-secured loans are charged off no later than the end of the month in which the account becomes 120 days past due. Accounts in bankruptcy are charged off for credit card and certain unsecured accounts 60 days after bankruptcy notification. For secured products, accounts in bankruptcy are written down to the collateral value, less cost to sell, by the end of the month in which the account becomes 60 days past due. Consumer credit card loans, consumer loans secured by personal property and unsecured consumer loans are not placed on nonaccrual status prior to charge-off and therefore are not reported as nonperforming loans. Real estate-secured loans are generally placed on nonaccrual status and classified as non -
performing at 90 days past due. However, consumer loans secured by real estate where repayments are guaranteed by the FHA are not placed on nonaccrual status, and therefore, are not reported as nonperforming loans. Interest accrued but not collected is reversed when a consumer loan is placed on nonaccrual status. Interest collections on nonaccruing consumer loans for which the ultimate collectability of principal is uncertain are applied as principal reductions; otherwise, such collections are credited to interest income when received. These loans may be restored to accrual status when all principal and interest is current and full repayment of the remaining contractual principal and interest is expected, or when the loan otherwise becomes well-secured and is in the process of collection. Consumer loans whose contractual terms have been modified in a TDR and are current at the time of restructuring remain on accrual status if there is demonstrated performance prior to the restructuring and payment in full under the restructured terms is expected. Otherwise, the loans are placed on nonaccrual status and reported as nonperforming until there is sustained repayment performance for a reasonable period, generally six months. Consumer TDRs that are on accrual status are reported as performing TDRs through the end of the calendar year in which the restructuring occurred or the year in which the loans are returned to accrual status. In addition, if accruing consumer TDRs bear less than a market rate of interest at the time of modification, they are reported as performing TDRs throughout the remaining lives of the loans.
Commercial loans and leases, excluding business card loans, that are past due 90 days or more as to principal or interest, or where reasonable doubt exists as to timely collection, including loans that are individually identified as being impaired, are generally placed on nonaccrual status and classified as nonperforming unless well-secured and in the process of collection. Commercial loans and leases whose contractual terms have been modified in a TDR are placed on nonaccrual status and reported as nonperforming until the loans have performed for an adequate period of time under the restructured agreement. Accruing commercial TDRs are reported as performing TDRs through the end of the calendar year in which the loans are returned to accrual status. In addition, if accruing commercial TDRs bear less than a market rate of interest at the time of modification, they are reported as performing TDRs throughout the remaining lives of the loans. Interest accrued but not collected is reversed when a commercial loan is placed on nonaccrual status. Interest collections on nonaccruing commercial loans and leases for which the ultimate collectability of principal is uncertain are applied as principal reductions; otherwise, such collections are credited to income when received. Commercial loans and leases may be restored to accrual status when all principal and interest is current and full repayment of the remaining contractual principal and interest is expected, or when the loan otherwise becomes well-secured and is in the process of collection. Business card loans are charged off no later than the end of the month in which the account becomes 180 days past due or where 60 days have elapsed since receipt of notification of bankruptcy filing, whichever comes first. These loans are not placed on nonaccrual status prior to charge-off and therefore are not reported as nonperforming loans.
The entire balance of a consumer and commercial loan is contractually delinquent if the minimum payment is not received by the specified due date on the customer's billing statement. Interest and fees continue to accrue on past due loans until the date the loan goes into nonaccrual status, if applicable.
Purchased impaired loans are recorded at fair value at the acquisition date. Although the purchased impaired loans may be contractually delinquent, the Corporation does not classify these loans as nonperforming as the loans were written down to fair value at the acquisition date and the accretable yield is recognized in interest income over the remaining life of
| Bank of America 2009 | 123 |
the loan. In addition, reported net charge-offs exclude write-downs on purchased impaired loan pools as the fair value already considers the estimated credit losses.
Loans Held-for-Sale
Loans that are intended to be sold in the foreseeable future, including residential mortgages, loan syndications, and to a lesser degree, commercial real estate, consumer finance and other loans, are reported as LHFS and are carried at the lower of aggregate cost or market value (fair value). The Corporation accounts for certain LHFS, including first mortgage LHFS, under the fair value option. Fair values for LHFS are based on quoted market prices, where available, or are determined by discounting estimated cash flows using interest rates approximating the Corporation's current origination rates for similar loans and adjusted to reflect the inherent credit risk. Mortgage loan origination costs related to LHFS which the Corporation accounts for under the fair value option are recognized in noninterest expense when incurred. Mortgage loan origination costs for LHFS carried at the lower of cost or market value (fair value) are capitalized as part of the carrying amount of the loans and recognized as a reduction of mortgage banking income upon the sale of such loans. LHFS that are on nonaccrual status and are reported as nonperforming are reported separately from nonperforming loans and leases.
Premises and Equipment
Premises and equipment are stated at cost less accumulated depreciation and amortization. Depreciation and amortization are recognized using the straight-line method over the estimated useful lives of the assets. Estimated lives range up to 40 years for buildings, up to 12 years for furniture and equipment, and the shorter of lease term or estimated useful life for leasehold improvements.
Mortgage Servicing Rights
The Corporation accounts for consumer-related MSRs at fair value with changes in fair value recorded in mortgage banking income, while commercial-related and residential reverse mortgage MSRs are accounted for using the amortization method (i.e., lower of cost or market) with impairment recognized as a reduction in mortgage banking income. To reduce the volatility of earnings to interest rate and market value fluctuations, certain securities and derivatives such as options and interest rate swaps may be used as economic hedges of the MSRs, but are not designated as accounting hedges. These economic hedges are carried at fair value with changes in fair value recognized in mortgage banking income.
The Corporation estimates the fair value of the consumer-related MSRs using a valuation model that calculates the present value of estimated future net servicing income. This is accomplished through an option-adjusted spread (OAS) valuation approach that factors in prepayment risk. This approach consists of projecting servicing cash flows under multiple interest rate scenarios and discounting these cash flows using risk-adjusted discount rates. The key economic assumptions used in valuations of MSRs include weighted-average lives of the MSRs and the OAS levels. The OAS represents the spread that is added to the discount rate so that the sum of the discounted cash flows equals the market price, therefore it is a measure of the extra yield over the reference discount factor (i.e., the forward swap curve) that the Corporation expects to earn by holding the asset. These variables can, and generally do, change from quarter to quarter as market conditions and projected interest rates change, and could have an adverse impact on the value of the MSRs and could result in a corresponding reduction in mortgage banking income.
Goodwill and Intangible Assets
Goodwill is calculated as the purchase premium after adjusting for the fair value of net assets acquired. Goodwill is not amortized but is reviewed for potential impairment on an annual basis, or when events or circumstances indicate a potential impairment, at the reporting unit level. A reporting unit, as defined under applicable accounting guidance, is a business segment or one level below a business segment. Under applicable accounting guidance, the goodwill impairment analysis is a two-step test. The first step of the goodwill impairment test involves comparing the fair value of each reporting unit with its carrying amount including goodwill. If the fair value of the reporting unit exceeds its carrying amount, goodwill of the reporting unit is considered not impaired; however, if the carrying amount of the reporting unit exceeds its fair value, the second step must be performed to measure potential impairment.
The second step involves calculating an implied fair value of goodwill for each reporting unit for which the first step indicated possible impairment. The implied fair value of goodwill is determined in the same manner as the amount of goodwill recognized in a business combination, which is the excess of the fair value of the reporting unit, as determined in the first step, over the aggregate fair values of the assets, liabilities and identifiable intangibles as if the reporting unit was being acquired in a business combination. Measurement of the fair values of the assets and liabilities of a reporting unit is consistent with the requirements of the fair value measurements accounting guidance, which defines fair value as the price that would be received to sell an asset or paid to transfer a liability in an orderly transaction between market participants at the measurement date. The adjustments to measure the assets, liabilities and intangibles at fair value are for the purpose of measuring the implied fair value of goodwill and such adjustments are not reflected in the Consolidated Balance Sheet. If the implied fair value of goodwill exceeds the goodwill assigned to the reporting unit, there is no impairment. If the goodwill assigned to a reporting unit exceeds the implied fair value of goodwill, an impairment charge is recorded for the excess. An impairment loss recognized cannot exceed the amount of goodwill assigned to a reporting unit. An impairment loss establishes a new basis in the goodwill and subsequent reversals of goodwill impairment losses are not permitted under applicable accounting guidance. In 2009, 2008 and 2007, goodwill was tested for impairment and it was determined that goodwill was not impaired at any of these dates.
For intangible assets subject to amortization, an impairment loss is recognized if the carrying amount of the intangible asset is not recoverable and exceeds fair value. The carrying amount of the intangible asset is considered not recoverable if it exceeds the sum of the undiscounted cash flows expected to result from the use of the asset.
Special Purpose Financing Entities
In the ordinary course of business, the Corporation supports its customers' financing needs by facilitating customers' access to different funding sources, assets and risks. In addition, the Corporation utilizes certain financing arrangements to meet its balance sheet management, funding, liquidity, and market or credit risk management needs. These financing entities may be in the form of corporations, partnerships, limited liability companies or trusts, and are generally not consolidated on the Corporation's Consolidated Balance Sheet. The majority of these activities are basic term or revolving securitization vehicles for mortgages, credit cards or other types of loans which are generally funded through term-amortizing debt structures. Other SPEs finance their activities by issuing short-term commercial paper. The securities issued by these vehicles are designed to be repaid from the underlying cash flows of the vehicles' assets or the reissuance of commercial paper.
| 124 | Bank of America 2009 |
Securitizations
The Corporation securitizes, sells and services interests in residential mortgage loans and credit card loans, and from time to time, automobile, other consumer and commercial loans. The securitization vehicles are typically QSPEs which, in accordance with applicable accounting guidance, are legally isolated, bankruptcy remote and beyond the control of the seller, and are not consolidated in the Corporation's Consolidated Financial Statements. When the Corporation securitizes assets, it may retain a portion of the securities, subordinated tranches, interest-only strips, subordinated interests in accrued interest and fees on the securitized receivables and, in some cases, overcollateralization and cash reserve accounts, all of which are generally considered retained interests in the securitized assets. The Corporation may also retain senior tranches in these securitizations. Gains and losses upon sale of assets to a securitization vehicle are based on an allocation of the previous carrying amount of the assets to the retained interests. Carrying amounts of assets transferred are allocated in proportion to the relative fair values of the assets sold and interests retained.
Quoted market prices are primarily used to obtain fair values of senior retained interests. Generally, quoted market prices for retained residual interests are not available; therefore, the Corporation estimates fair values based upon the present value of the associated expected future cash flows. This may require management to estimate credit losses, prepayment speeds, forward interest yield curves, discount rates and other factors that impact the value of retained interests.
Interest-only strips retained in connection with credit card securitizations are classified in other assets and carried at fair value with changes in fair value recorded in card income. Other retained interests are recorded in other assets, AFS debt securities or trading account assets and generally are carried at fair value with changes recorded in income or accumulated OCI, or are recorded as HTM debt securities and carried at amortized cost. If the fair value of such retained interests has declined below carrying amount and there has been an adverse change in estimated contractual cash flows of the underlying assets, then such decline is determined to be other-than-temporary and the retained interest is written down to fair value with a corresponding charge to other income.
Other Special Purpose Financing Entities
Other special purpose financing entities (e.g., Corporation-sponsored multi-seller conduits, collateralized debt obligation vehicles and asset acquisition conduits) are generally funded with short-term commercial paper or long-term debt. These financing entities are usually contractually limited to a narrow range of activities that facilitate the transfer of or access to various types of assets or financial instruments and provide the investors in the transaction with protection from creditors of the Corporation in the event of bankruptcy or receivership of the Corporation. In certain situations, the Corporation provides liquidity commitments and/or loss protection agreements.
The Corporation determines whether these entities should be consolidated by evaluating the degree to which it maintains control over the financing entity and will receive the risks and rewards of the assets in the financing entity. In making this determination, the Corporation considers whether the entity is a QSPE, which is generally not required to be consolidated by the seller or investors in the entity. For non-QSPE structures or VIEs, the Corporation assesses whether it is the primary beneficiary of the entity. In accordance with applicable accounting guidance, the entity that will absorb a majority of expected variability (the sum of the absolute values of the expected losses and expected residual returns) consolidates the VIE and is referred to as the primary beneficiary. As certain events occur, the Corporation reevaluates which parties will absorb varia -
bility and whether the Corporation has become or is no longer the primary beneficiary. Reconsideration events may occur when VIEs acquire additional assets, issue new variable interests or enter into new or modified contractual arrangements. A reconsideration event may also occur when the Corporation acquires new or additional interests in a VIE.
Fair Value
The Corporation measures the fair values of its financial instruments in accordance with accounting guidance that requires an entity to base fair value on exit price and maximize the use of observable inputs and minimize the use of unobservable inputs to determine the exit price. The Corporation categorizes its financial instruments, based on the priority of inputs to the valuation technique, into a three-level hierarchy, as described below. Trading account assets and liabilities, derivative assets and liabilities, AFS debt and marketable equity securities, MSRs, and certain other assets are carried at fair value in accordance with applicable accounting guidance. The Corporation has also elected to account for certain assets and liabilities under the fair value option, including certain corporate loans and loan commitments, LHFS, commercial paper and other short-term borrowings, securities financing agreements, asset-backed secured financings, long-term deposits and long-term debt. The following describes the three-level hierarchy.
| Level 1 | Unadjusted quoted prices in active markets for identical assets or liabilities. Level 1 assets and liabilities include debt and equity securities and derivative contracts that are traded in an active exchange market, as well as certain U.S. Treasury securities that are highly liquid and are actively traded in over-the-counter markets. |
| Level 2 | Observable inputs other than Level 1 prices, such as quoted prices for similar assets or liabilities, quoted prices in markets that are not active, or other inputs that are observable or can be corroborated by observable market data for substantially the full term of the assets or liabilities. Level 2 assets and liabilities include debt securities with quoted prices that are traded less frequently than exchange-traded instruments and derivative contracts where value is determined using a pricing model with inputs that are observable in the market or can be derived principally from or corroborated by observable market data. This category generally includes U.S. government and agency mortgage-backed debt securities, corporate debt securities, derivative contracts, residential mortgage loans and certain LHFS. |
| Level 3 | Unobservable inputs that are supported by little or no market activity and that are significant to the overall fair value of the assets or liabilities. Level 3 assets and liabilities include financial instruments for which the determination of fair value requires significant management judgment or estimation. The fair value for such assets and liabilities is generally determined using pricing models, discounted cash flow methodologies or similar techniques that incorporate the assumptions a market participant would use in pricing the asset or liability. This category generally includes certain private equity investments and other principal investments, retained residual interests in securitizations, residential MSRs, asset-backed securities (ABS), highly structured, complex or long-dated derivative contracts, certain LHFS, IRLCs and certain collateralized debt obligations (CDOs) where independent pricing information cannot be obtained for a significant portion of the underlying assets. |
| Bank of America 2009 | 125 |
Income Taxes
There are two components of income tax expense: current and deferred. Current income tax expense approximates taxes to be paid or refunded for the current period. Deferred income tax expense results from changes in deferred tax assets and liabilities between periods. These gross deferred tax assets and liabilities represent decreases or increases in taxes expected to be paid in the future because of future reversals of temporary differences in the bases of assets and liabilities as measured by tax laws and their bases as reported in the financial statements. Deferred tax assets are also recognized for tax attributes such as net operating loss carryforwards and tax credit carryforwards. Valuation allowances are recorded to reduce deferred tax assets to the amounts management concludes are more-likely-than-not to be realized.
Income tax benefits are recognized and measured based upon a two-step model: 1) a tax position must be more-likely-than-not to be sustained based solely on its technical merits in order to be recognized, and 2) the benefit is measured as the largest dollar amount of that position that is more-likely-than-not to be sustained upon settlement. The difference between the benefit recognized and the tax benefit claimed on a tax return is referred to as an unrecognized tax benefit (UTB). The Corporation records income tax-related interest and penalties, if applicable, within income tax expense.
Retirement Benefits
The Corporation has established retirement plans covering substantially all full-time and certain part-time employees. Pension expense under these plans is charged to current operations and consists of several components of net pension cost based on various actuarial assumptions regarding future experience under the plans.
In addition, the Corporation has established unfunded supplemental benefit plans and supplemental executive retirement plans (SERPs) for selected officers of the Corporation and its subsidiaries that provide benefits that cannot be paid from a qualified retirement plan due to Internal Revenue Code restrictions. The SERPs have been frozen and the executive officers do not accrue any additional benefits. These plans are nonqualified under the Internal Revenue Code and assets used to fund benefit payments are not segregated from other assets of the Corporation; therefore, in general, a participant's or beneficiary's claim to benefits under these plans is as a general creditor. In addition, the Corporation has established several postretirement healthcare and life insurance benefit plans.
Accumulated Other Comprehensive Income
The Corporation records unrealized gains and losses on AFS debt and marketable equity securities, gains and losses on cash flow accounting hedges, unrecognized actuarial gains and losses, transition obligation and prior service costs on pension and postretirement plans, foreign currency translation adjustments and related hedges of net investments in foreign operations in accumulated OCI, net-of-tax. Unrealized gains and losses on AFS debt and marketable equity securities are reclassified to earnings as the gains or losses are realized upon sale of the securities. Unrealized losses on AFS securities deemed to represent other-than- temporary impairment are reclassified to earnings at the time of the charge. Beginning in 2009, for AFS debt securities that the Corporation does not intend to sell or it is more-likely-than-not that it will not be
required to sell, only the credit component of an unrealized loss is reclassified to earnings. Gains or losses on derivatives accounted for as cash flow hedges are reclassified to earnings when the hedged transaction affects earnings. Translation gains or losses on foreign currency translation adjustments are reclassified to earnings upon the substantial sale or liquidation of investments in foreign operations.
Earnings Per Common Share
EPS is computed by dividing net income allocated to common shareholders by the weighted average common shares outstanding. Net income allocated to common shareholders represents net income applicable to common shareholders (net income adjusted for preferred stock dividends including dividends declared, accretion of discounts on preferred stock including accelerated accretion when preferred stock is repaid early, and cumulative dividends related to the current dividend period that have not been declared as of period end) less income allocated to participating securities (see discussion below). Diluted earnings per common share is computed by dividing income allocated to common shareholders by the weighted average common shares outstanding plus amounts representing the dilutive effect of stock options outstanding, restricted stock, restricted stock units, outstanding warrants, and the dilution resulting from the conversion of convertible preferred stock, if applicable.
On January 1, 2009, the Corporation adopted new accounting guidance on earnings per share that defines unvested share-based payment awards that contain nonforfeitable rights to dividends as participating securities that are included in computing EPS using the two-class method. The two-class method is an earnings allocation formula under which EPS is calculated for common stock and participating securities according to dividends declared and participating rights in undistributed earnings. Under this method, all earnings (distributed and undistributed) are allocated to participating securities and common shares based on their respective rights to receive dividends.
In an exchange of non-convertible preferred stock, income allocated to common shareholders is adjusted for the difference between the carrying value of the preferred stock and the fair value of the common stock exchanged. In an induced conversion of convertible preferred stock, income allocated to common shareholders is reduced by the excess of the fair value of the common stock exchanged over the fair value of the common stock that would have been issued under the original conversion terms.
Foreign Currency Translation
Assets, liabilities and operations of foreign branches and subsidiaries are recorded based on the functional currency of each entity. For certain of the foreign operations, the functional currency is the local currency, in which case the assets, liabilities and operations are translated, for consolidation purposes, from the local currency to the U.S. dollar reporting currency at period-end rates for assets and liabilities and generally at average rates for operations. The resulting unrealized gains or losses as well as gains and losses from certain hedges, are reported as a component of accumulated OCI on an after-tax basis. When the foreign entity's functional currency is determined to be the U.S. dollar, the resulting remeasurement currency gains or losses on foreign currency-denominated assets or liabilities are included in earnings.
| 126 | Bank of America 2009 |
Credit Card and Deposit Arrangements
Endorsing Organization Agreements
The Corporation contracts with other organizations to obtain their endorsement of the Corporation's loan and deposit products. This endorsement may provide to the Corporation exclusive rights to market to the organization's members or to customers on behalf of the Corporation. These organizations endorse the Corporation's loan and deposit products and provide the Corporation with their mailing lists and marketing activities. These agreements generally have terms that range from two to five years. The Corporation typically pays royalties in exchange for their endorsement. Compensation costs related to the credit card agreements are recorded as contra-revenue in card income.
Cardholder Reward Agreements
The Corporation offers reward programs that allow its cardholders to earn points that can be redeemed for a broad range of rewards including cash, travel and discounted products. The Corporation establishes a rewards liability based upon the points earned that are expected to be redeemed and the average cost per point redeemed. The points to be redeemed are estimated based on past redemption behavior, card product type, account transaction activity and other historical card performance. The liability is reduced as the points are redeemed. The estimated cost of the rewards programs is recorded as contra-revenue in card income.
Insurance Income & Insurance Expense
Property and casualty and credit life and disability premiums are recognized over the term of the policies on a pro-rata basis for all policies except for certain of the lender-placed auto insurance and the guaranteed auto protection (GAP) policies. For GAP insurance, revenue recognition is correlated to the exposure and accelerated over the life of the contract. For lender-placed auto insurance, premiums are recognized when collections become probable due to high cancellation rates experienced early in the life of the policy. Mortgage reinsurance premiums are recognized as earned. Insurance expense includes insurance claims and commissions, both of which are recorded in other general operating expense.
NOTE 2 – Merger and Restructuring Activity
Merrill Lynch
On January 1, 2009, the Corporation acquired Merrill Lynch through its merger with a subsidiary of the Corporation in exchange for common and preferred stock with a value of $29.1 billion, creating a financial services franchise with significantly enhanced wealth management, investment banking and international capabilities. Under the terms of the merger agreement, Merrill Lynch common shareholders received 0.8595 of a share of Bank of America Corporation common stock in exchange for each share of Merrill Lynch common stock. In addition, Merrill Lynch non-convertible preferred shareholders received Bank of America Corporation preferred stock having substantially identical terms. Merrill Lynch convertible preferred stock remains outstanding and is convertible into Bank of America common stock at an equivalent exchange ratio. With the acquisition, the Corporation has one of the largest wealth management businesses in the world with approximately 15,000 financial advisors and more than $2.1 trillion in client assets. Global investment management capabilities include an economic ownership interest of approximately 34 percent in BlackRock, Inc. (BlackRock), a publicly traded investment management company. In addition, the acquisition adds strengths in debt and equity underwriting, sales and trading, and merger and acquisition advice, creating significant opportunities to deepen relationships with corporate and institutional clients around the globe. Merrill Lynch's results of operations were included in the Corporation's results beginning January 1, 2009.
The purchase price was allocated to the acquired assets and liabilities based on their estimated fair values at the Merrill Lynch acquisition date as summarized in the following table. Goodwill of $5.1 billion was calculated as the purchase premium after adjusting for the fair value of net assets acquired and represents the value expected from the synergies created from combining the Merrill Lynch wealth management and corporate and investment banking businesses with the Corporation's capabilities in consumer and commercial banking as well as the economies of scale expected from combining the operations of the two companies. No goodwill is expected to be deductible for federal income tax purposes. The goodwill was allocated principally to the Global Wealth & Investment Management (GWIM) and Global Markets business segments.
Merrill Lynch Purchase Price Allocation
| (Dollars in billions, except per share amounts) | ||||
Purchase price | ||||
Merrill Lynch common shares exchanged (in millions) | 1,600 | |||
Exchange ratio | 0.8595 | |||
The Corporation's common shares issued (in millions) | 1,375 | |||
Purchase price per share of the Corporation's common stock (1) | $ | 14.08 | ||
Total value of the Corporation's common stock and cash exchanged for fractional shares | $ | 19.4 | ||
Merrill Lynch preferred stock | 8.6 | |||
Fair value of outstanding employee stock awards | 1.1 | |||
Total purchase price | $ | 29.1 | ||
Allocation of the purchase price | ||||
Merrill Lynch stockholders' equity | 19.9 | |||
Merrill Lynch goodwill and intangible assets | (2.6 | ) | ||
Pre-tax adjustments to reflect acquired assets and liabilities at fair value: | ||||
Derivatives and securities | (1.9 | ) | ||
Loans | (6.1 | ) | ||
Intangible assets (2) | 5.4 | |||
Other assets/liabilities | (0.8 | ) | ||
Long-term debt | 16.0 | |||
Pre-tax total adjustments | 12.6 | |||
Deferred income taxes | (5.9 | ) | ||
After-tax total adjustments | 6.7 | |||
Fair value of net assets acquired | 24.0 | |||
Goodwill resulting from the Merrill Lynch acquisition | $ | 5.1 | ||
| (1) | The value of the shares of common stock exchanged with Merrill Lynch shareholders was based upon the closing price of the Corporation's common stock at December 31, 2008, the last trading day prior to the date of acquisition. |
| (2) | Consists of trade name of $1.5 billion and customer relationship and core deposit intangibles of $3.9 billion. The amortization life is 10 years for the customer relationship and core deposit intangibles which are primarily amortized on a straight-line basis. |
| Bank of America 2009 | 127 |
Condensed Statement of Net Assets Acquired
The following condensed statement of net assets acquired reflects the values assigned to Merrill Lynch's net assets as of the acquisition date.
| (Dollars in billions) | January 1, 2009 | ||
Assets | |||
Federal funds sold and securities borrowed or purchased under agreements to resell | $ | 138.8 | |
Trading account assets | 87.9 | ||
Derivative assets | 96.4 | ||
Investment securities | 70.5 | ||
Loans and leases | 55.9 | ||
Intangible assets | 5.4 | ||
Other assets | 195.3 | ||
Total assets | $ | 650.2 | |
Liabilities | |||
Deposits | $ | 98.1 | |
Federal funds purchased and securities loaned or sold under agreements to repurchase | 111.6 | ||
Trading account liabilities | 18.1 | ||
Derivative liabilities | 72.0 | ||
Commercial paper and other short-term borrowings | 37.9 | ||
Accrued expenses and other liabilities | 99.6 | ||
Long-term debt | 188.9 | ||
Total liabilities | 626.2 | ||
Fair value of net assets acquired | $ | 24.0 | |
Contingencies
The fair value of net assets acquired includes certain contingent liabilities that were recorded as of the acquisition date. Merrill Lynch has been named as a defendant in various pending legal actions and proceedings arising in connection with its activities as a global diversified financial services institution. Some of these legal actions and proceedings include claims for substantial compensatory and/or punitive damages or claims for indeterminate amounts of damages. Merrill Lynch is also involved in investigations and/or proceedings by governmental and self-regulatory agencies. Due to the number of variables and assumptions involved in assessing the possible outcome of these legal actions, sufficient information did not exist to reasonably estimate the fair value of these contingent liabilities. As such, these contingences have been measured in accordance with accounting guidance on contingencies which states that a loss is recognized when it is probable of occurring and the loss amount can be reasonably estimated. For further information, see Note 14 – Commitments and Contingencies.
In connection with the Merrill Lynch acquisition, on January 1, 2009, the Corporation recorded certain guarantees, primarily standby liquidity facilities and letters of credit, with a fair value of approximately $1 billion. At the time of acquisition, the maximum amount that could be drawn from these guarantees was approximately $20 billion.
Countrywide
On July 1, 2008, the Corporation acquired Countrywide through its merger with a subsidiary of the Corporation. Under the terms of the merger agreement, Countrywide shareholders received 0.1822 of a share of Bank of America Corporation common stock in exchange for each share of Countrywide common stock. The acquisition of Countrywide significantly expanded the Corporation's mortgage originating and servicing capabilities, making it a leading mortgage originator and servicer. As provided by the merger agreement, 583 million shares of Countrywide common stock were exchanged for 107 million shares of the Corporation's common stock. Countrywide's results of operations were included in the Corporation's results beginning July 1, 2008.
The Countrywide purchase price was allocated to the assets acquired and liabilities assumed based on their fair values at the Countrywide
acquisition date as summarized in the following table. No goodwill is deductible for federal income tax purposes. All the goodwill was allocated to the Home Loans & Insurance business segment.
Countrywide Purchase Price Allocation
| (Dollars in billions) | ||||
Purchase price (1) | $ | 4.2 | ||
Allocation of the purchase price | ||||
Countrywide stockholders' equity (2) | 8.4 | |||
Pre-tax adjustments to reflect assets acquired and liabilities assumed at fair value: | ||||
Loans | (9.8 | ) | ||
Investments in other financial instruments | (0.3 | ) | ||
Mortgage servicing rights | (1.5 | ) | ||
Other assets | (0.8 | ) | ||
Deposits | (0.2 | ) | ||
Notes payable and other liabilities | (0.9 | ) | ||
Pre-tax total adjustments | (13.5 | ) | ||
Deferred income taxes | 4.9 | |||
After-tax total adjustments | (8.6 | ) | ||
Fair value of net assets acquired | (0.2 | ) | ||
Goodwill resulting from the Countrywide acquisition | $ | 4.4 | ||
| (1) | The value of the shares of common stock exchanged with Countrywide shareholders was based upon the average of the closing prices of the Corporation's common stock for the period commencing two trading days before and ending two trading days after January 11, 2008, the date of the Countrywide merger agreement. |
| (2) | Represents the remaining Countrywide shareholders' equity as of the acquisition date after the cancellation of the $2.0 billion of Series B convertible preferred shares owned by the Corporation. |
The Corporation acquired certain loans for which there was, at the time of the merger, evidence of deterioration of credit quality since origination and for which it was probable that all contractually required payments would not be collected. For more information, see the Countrywide purchased impaired loan discussion in Note 6 – Outstanding Loans and Leases.
Other Acquisitions
On October 1, 2007, the Corporation acquired all the outstanding shares of LaSalle, for $21.0 billion in cash. LaSalle's results of operations were included in the Corporation's results beginning October 1, 2007.
On July 1, 2007, the Corporation acquired all the outstanding shares of U.S. Trust Corporation for $3.3 billion in cash. U.S. Trust Corporation's results of operations were included in the Corporation's results beginning July 1, 2007.
Unaudited Pro Forma Condensed Combined Financial Information
If the Merrill Lynch and Countrywide acquisitions had been completed on January 1, 2008, total revenue, net of interest expense would have been $66.8 billion, net loss from continuing operations would have been $26.0 billion, and basic and diluted loss per common share would have been $5.37 for 2008. These results include the impact of amortizing certain purchase accounting adjustments such as intangible assets as well as fair value adjustments to loans, securities and debt. The pro forma financial information does not include the impact of possible business model changes nor does it consider any potential impacts of current market conditions or revenues, expense efficiencies, asset dispositions, share repurchases or other factors. For 2009, Merrill Lynch contributed $23.3 billion in revenue, net of interest expense, and $4.7 billion in net income. These amounts exclude the impact of intercompany transfers of businesses and are before the consideration of certain merger-related costs, revenue opportunities and certain consolidating tax benefits that were recognized in legacy Bank of America legal entities.
| 128 | Bank of America 2009 |
Merger and Restructuring Charges
Merger and restructuring charges are recorded in the Consolidated Statement of Income and include incremental costs to integrate the operations of the Corporation and its recent acquisitions. These charges represent costs associated with these one-time activities and do not represent ongoing costs of the fully integrated combined organization. On January 1, 2009, the Corporation adopted new accounting guidance, on a prospective basis, that requires that acquisition-related transaction and restructuring costs be charged to expense as incurred. Previously, these expenses were recorded as an adjustment to goodwill.
The following table presents severance and employee-related charges, systems integrations and related charges, and other merger-related charges.
| (Dollars in millions) | 2009 | 2008 | 2007 | ||||||
Severance and employee-related charges | $ | 1,351 | $ | 138 | $ | 106 | |||
Systems integrations and related charges | 1,155 | 640 | 240 | ||||||
Other | 215 | 157 | 64 | ||||||
Total merger and restructuring charges | $ | 2,721 | $ | 935 | $ | 410 | |||
Included for 2009 are merger-related charges of $1.8 billion related to the Merrill Lynch acquisition, $843 million related to the Countrywide acquisition, and $97 million related to the LaSalle acquisition. Included for 2008 are merger-related charges of $623 million related to the LaSalle acquisition, $205 million related to the Countrywide acquisition, and $107 million related to the U.S. Trust Corporation acquisition. Included for 2007 are merger-related charges of $233 million related to the 2006 MBNA Corporation (MBNA) acquisition, $109 million related to the U.S. Trust Corporation acquisition and $68 million related to the LaSalle acquisition.
During 2009, the $1.8 billion merger-related charges for the Merrill Lynch acquisition included $1.2 billion for severance and other employee-related costs, $480 million of system integration costs, and $129 million in other merger-related costs.
Merger-related Exit Cost and Restructuring Reserves
The following table presents the changes in exit cost and restructuring reserves for 2009 and 2008. Exit cost reserves were established in purchase accounting resulting in an increase in goodwill. Restructuring reserves are established by a charge to merger and restructuring charges.
Exit costs were not recorded in purchase accounting for the Merrill Lynch acquisition in accordance with amendments to the accounting guidance for business combinations which were effective January 1, 2009.
| Exit Cost Reserves | Restructuring Reserves | |||||||||||||||||
| (Dollars in millions) | 2009 | 2008 | 2009 | 2008 | ||||||||||||||
Balance, January 1 | $ | 523 | $ | 377 | $ | 86 | $ | 108 | ||||||||||
Exit costs and restructuring charges: | ||||||||||||||||||
Merrill Lynch | n/a | n/a | 949 | n/a | ||||||||||||||
Countrywide | – | 588 | 191 | 71 | ||||||||||||||
LaSalle | (24 | ) | 31 | (6 | ) | 25 | ||||||||||||
U.S. Trust Corporation | – | (3 | ) | (1 | ) | 40 | ||||||||||||
MBNA | – | (6 | ) | – | (3 | ) | ||||||||||||
Cash payments | (387 | ) | (464 | ) | (816 | ) | (155 | ) | ||||||||||
Balance, December 31 | $ | 112 | $ | 523 | $ | 403 | $ | 86 | ||||||||||
| n/a | = not applicable |
At December 31, 2008, there were $523 million of exit cost reserves related principally to the Countrywide acquisition, including $347 million for severance, relocation and other employee-related costs and $176 million for contract terminations. During 2009, $24 million of exit cost reserve adjustments were recorded for the LaSalle acquisition primarily due to lower than expected contract terminations. Cash payments of $387 million during 2009 consisted of $271 million in severance, relocation and other employee-related costs and $116 million in contract terminations. At December 31, 2009, exit cost reserves of $112 million related principally to Countrywide.
At December 31, 2008, there were $86 million of restructuring reserves related to the Countrywide, LaSalle and U.S. Trust Corporation acquisitions related to severance and other employee-related costs. During 2009, $1.1 billion was added to the restructuring reserves related to severance and other employee-related costs primarily associated with the Merrill Lynch acquisition. Cash payments of $816 million during 2009 were all related to severance and other employee-related costs. As of December 31, 2009, restructuring reserves of $403 million included $328 million for Merrill Lynch and $74 million for Countrywide.
Payments under exit cost and restructuring reserves associated with the U.S. Trust Corporation acquisition were completed in 2009 while payments associated with the LaSalle, Countrywide and Merrill Lynch acquisitions will continue into 2010.
NOTE 3 – Trading Account Assets and Liabilities
The following table presents the components of trading account assets and liabilities at December 31, 2009 and 2008.
| December 31 | ||||||
| (Dollars in millions) | 2009 | 2008 | ||||
Trading account assets | ||||||
U.S. government and agency securities (1) | $ | 44,585 | $ | 60,038 | ||
Corporate securities, trading loans and other | 57,009 | 34,056 | ||||
Equity securities | 33,562 | 20,258 | ||||
Foreign sovereign debt | 28,143 | 13,614 | ||||
Mortgage trading loans and asset-backed securities | 18,907 | 6,349 | ||||
Total trading account assets | $ | 182,206 | $ | 134,315 | ||
Trading account liabilities | ||||||
U.S. government and agency securities | $ | 26,519 | $ | 27,286 | ||
Equity securities | 18,407 | 12,128 | ||||
Foreign sovereign debt | 12,897 | 7,252 | ||||
Corporate securities and other | 7,609 | 5,057 | ||||
Total trading account liabilities | $ | 65,432 | $ | 51,723 | ||
| (1) | Includes $23.5 billion and $52.6 billion at December 31, 2009 and 2008 of government-sponsored enterprise (GSE) obligations. |
| Bank of America 2009 | 129 |
NOTE 4 – Derivatives
Derivative Balances
Derivatives are held for trading, as economic hedges, or as qualifying accounting hedges . The Corporation enters into derivatives to facilitate client transactions, for proprietary trading purposes and to manage risk exposures. The following table identifies derivative instruments included
on the Corporation's Consolidated Balance Sheet in derivative assets and liabilities at December 31, 2009 and 2008. Balances are provided on a gross basis, prior to the application of the impact of counterparty and collateral netting. Total derivative assets and liabilities are adjusted on an aggregate basis to take into consideration the effects of legally enforceable master netting agreements and have been reduced by the cash collateral applied.
| December 31, 2009 | |||||||||||||||||||||||||
| Gross Derivative Assets | Gross Derivative Liabilities | ||||||||||||||||||||||||
| (Dollars in billions) | Contract/ Notional (1) | Trading Derivatives and Economic Hedges | Qualifying Accounting Hedges (2) | Total | Trading Derivatives and Economic Hedges | Qualifying Accounting Hedges (2) | Total | ||||||||||||||||||
Interest rate contracts | |||||||||||||||||||||||||
Swaps | $ | 45,261.5 | $ | 1,121.3 | $ | 5.6 | $ | 1,126.9 | $ | 1,105.0 | $ | 0.8 | $ | 1,105.8 | |||||||||||
Futures and forwards | 11,842.1 | 7.1 | – | 7.1 | 6.1 | – | 6.1 | ||||||||||||||||||
Written options | 2,865.5 | – | – | – | 84.1 | – | 84.1 | ||||||||||||||||||
Purchased options | 2,626.7 | 84.1 | – | 84.1 | – | – | – | ||||||||||||||||||
Foreign exchange contracts | |||||||||||||||||||||||||
Swaps | 661.9 | 23.7 | 4.6 | 28.3 | 27.3 | 0.5 | 27.8 | ||||||||||||||||||
Spot, futures and forwards | 1,750.8 | 24.6 | 0.3 | 24.9 | 25.6 | 0.1 | 25.7 | ||||||||||||||||||
Written options | 383.6 | – | – | – | 13.0 | – | 13.0 | ||||||||||||||||||
Purchased options | 355.3 | 12.7 | – | 12.7 | – | – | – | ||||||||||||||||||
Equity contracts | |||||||||||||||||||||||||
Swaps | 58.5 | 2.0 | – | 2.0 | 2.0 | – | 2.0 | ||||||||||||||||||
Futures and forwards | 79.0 | 3.0 | – | 3.0 | 2.2 | – | 2.2 | ||||||||||||||||||
Written options | 283.4 | – | – | – | 25.1 | 0.4 | 25.5 | ||||||||||||||||||
Purchased options | 273.7 | 27.3 | – | 27.3 | – | – | – | ||||||||||||||||||
Commodity contracts | |||||||||||||||||||||||||
Swaps | 65.3 | 6.9 | 0.1 | 7.0 | 6.8 | – | 6.8 | ||||||||||||||||||
Futures and forwards | 387.8 | 10.4 | – | 10.4 | 9.6 | – | 9.6 | ||||||||||||||||||
Written options | 54.9 | – | – | – | 7.9 | – | 7.9 | ||||||||||||||||||
Purchased options | 50.9 | 7.6 | – | 7.6 | – | – | – | ||||||||||||||||||
Credit derivatives | |||||||||||||||||||||||||
Purchased credit derivatives: | |||||||||||||||||||||||||
Credit default swaps | 2,800.5 | 105.5 | – | 105.5 | 45.2 | – | 45.2 | ||||||||||||||||||
Total return swaps/other | 21.7 | 1.5 | – | 1.5 | 0.4 | – | 0.4 | ||||||||||||||||||
Written credit derivatives: | |||||||||||||||||||||||||
Credit default swaps | 2,788.8 | 44.1 | – | 44.1 | 98.4 | – | 98.4 | ||||||||||||||||||
Total return swaps/other | 33.1 | 1.8 | – | 1.8 | 1.1 | – | 1.1 | ||||||||||||||||||
Gross derivative assets/liabilities | $ | 1,483.6 | $ | 10.6 | 1,494.2 | $ | 1,459.8 | $ | 1.8 | 1,461.6 | |||||||||||||||
Less: Legally enforceable master netting agreements | (1,355.1 | ) | (1,355.1 | ) | |||||||||||||||||||||
Less: Cash collateral applied | (58.4 | ) | (62.8 | ) | |||||||||||||||||||||
Total derivative assets/liabilities | $ | 80.7 | $ | 43.7 | |||||||||||||||||||||
| (1) | Represents the total contract/notional amount of the derivatives outstanding and includes both written and purchased credit derivatives. |
| (2) | Excludes $4.4 billion of long-term debt designated as a hedge of foreign currency risk. |
| 130 | Bank of America 2009 |
| December 31, 2008 | |||||||||||||||||||||||||
| Gross Derivative Assets | Gross Derivative Liabilities | ||||||||||||||||||||||||
| (Dollars in billions) | Contract/ Notional (1) | Trading Derivatives and Economic Hedges | Qualifying Accounting Hedges (2) | Total | Trading Derivatives and Economic Hedges | Qualifying Accounting Hedges (2) | Total | ||||||||||||||||||
Interest rate contracts | |||||||||||||||||||||||||
Swaps | $ | 26,577.4 | $ | 1,213.2 | $ | 2.2 | $ | 1,215.4 | $ | 1,186.0 | $ | – | $ | 1,186.0 | |||||||||||
Futures and forwards | 4,432.1 | 5.1 | – | 5.1 | 7.9 | – | 7.9 | ||||||||||||||||||
Written options | 1,731.1 | – | – | – | 62.7 | – | 62.7 | ||||||||||||||||||
Purchased options | 1,656.6 | 60.3 | – | 60.3 | – | – | – | ||||||||||||||||||
Foreign exchange contracts | |||||||||||||||||||||||||
Swaps | 438.9 | 17.5 | 3.6 | 21.1 | 20.5 | 1.3 | 21.8 | ||||||||||||||||||
Spot, futures and forwards | 1,376.5 | 52.3 | – | 52.3 | 51.3 | – | 51.3 | ||||||||||||||||||
Written options | 199.8 | – | – | – | 7.5 | – | 7.5 | ||||||||||||||||||
Purchased options | 175.7 | 8.0 | – | 8.0 | – | – | – | ||||||||||||||||||
Equity contracts | |||||||||||||||||||||||||
Swaps | 34.7 | 1.8 | – | 1.8 | 1.0 | – | 1.0 | ||||||||||||||||||
Futures and forwards | 14.1 | 0.3 | – | 0.3 | 0.1 | – | 0.1 | ||||||||||||||||||
Written options | 214.1 | – | – | – | 31.6 | 0.1 | 31.7 | ||||||||||||||||||
Purchased options | 217.5 | 32.6 | – | 32.6 | – | – | – | ||||||||||||||||||
Commodity contracts | |||||||||||||||||||||||||
Swaps | 2.1 | 2.4 | – | 2.4 | 2.1 | – | 2.1 | ||||||||||||||||||
Futures and forwards | 9.6 | 1.2 | – | 1.2 | 1.0 | – | 1.0 | ||||||||||||||||||
Written options | 17.6 | – | – | – | 3.8 | – | 3.8 | ||||||||||||||||||
Purchased options | 15.6 | 3.7 | – | 3.7 | – | – | – | ||||||||||||||||||
Credit derivatives | |||||||||||||||||||||||||
Purchased credit derivatives: | |||||||||||||||||||||||||
Credit default swaps | 1,025.9 | 125.7 | – | 125.7 | 3.4 | – | 3.4 | ||||||||||||||||||
Total return swaps | 6.6 | 1.8 | – | 1.8 | 0.2 | – | 0.2 | ||||||||||||||||||
Written credit derivatives: | |||||||||||||||||||||||||
Credit default swaps | 1,000.0 | 3.4 | – | 3.4 | 118.8 | – | 118.8 | ||||||||||||||||||
Total return swaps | 6.2 | 0.4 | – | 0.4 | 0.1 | – | 0.1 | ||||||||||||||||||
Gross derivative assets/liabilities | $ | 1,529.7 | $ | 5.8 | 1,535.5 | $ | 1,498.0 | $ | 1.4 | 1,499.4 | |||||||||||||||
Less: Legally enforceable master netting agreements | (1,438.4 | ) | (1,438.4 | ) | |||||||||||||||||||||
Less: Cash collateral applied | (34.8 | ) | (30.3 | ) | |||||||||||||||||||||
Total derivative assets/liabilities | $ | 62.3 | $ | 30.7 | |||||||||||||||||||||
| (1) | Represents the total contract/notional amount of the derivatives outstanding and includes both written and purchased credit derivatives. |
| (2) | Excludes $2.0 billion of long-term debt designated as a hedge of foreign currency risk. |
ALM and Risk Management Derivatives
The Corporation's ALM and risk management activities include the use of derivatives to mitigate risk to the Corporation including both derivatives that are designated as hedging instruments and economic hedges. Interest rate, commodity, credit and foreign exchange contracts are utilized in the Corporation's ALM and risk management activities.
The Corporation maintains an overall interest rate risk management strategy that incorporates the use of interest rate contracts to minimize significant fluctuations in earnings that are caused by interest rate volatility. The Corporation's goal is to manage interest rate sensitivity so that movements in interest rates do not significantly adversely affect earnings. As a result of interest rate fluctuations, hedged fixed-rate assets and liabilities appreciate or depreciate in fair value. Gains or losses on the derivative instruments that are linked to the hedged fixed-rate assets and liabilities are expected to substantially offset this unrealized appreciation or depreciation.
Interest rate contracts, which are generally non-leveraged generic interest rate and basis swaps, options, futures and forwards, are used by the Corporation in the management of its interest rate risk position. Non-leveraged generic interest rate swaps involve the exchange of fixed-rate and variable-rate interest payments based on the contractual underlying notional amount. Basis swaps involve the exchange of interest payments based on the contractual underlying notional amounts, where both the pay rate and the receive rate are floating rates based on differ -
ent indices. Option products primarily consist of caps, floors and swaptions. Futures contracts used for the Corporation's ALM activities are primarily index futures providing for cash payments based upon the movements of an underlying rate index.
Interest rate and market risk can be substantial in the mortgage business. Market risk is the risk that values of mortgage assets or revenues will be adversely affected by changes in market conditions such as interest rate movements. To hedge interest rate risk in mortgage banking production income, the Corporation utilizes forward loan sale commitments and other derivative instruments including purchased options. The Corporation also utilizes derivatives such as interest rate options, interest rate swaps, forward settlement contracts and euro-dollar futures as economic hedges of the fair value of MSRs. For additional information on MSRs, see Note 22 – Mortgage Servicing Rights .
The Corporation uses foreign currency contracts to manage the foreign exchange risk associated with certain foreign currency-denominated assets and liabilities, as well as the Corporation's investments in foreign subsidiaries. Foreign exchange contracts, which include spot and forward contracts, represent agreements to exchange the currency of one country for the currency of another country at an agreed-upon price on an agreed-upon settlement date. Exposure to loss on these contracts will increase or decrease over their respective lives as currency exchange and interest rates fluctuate.
| Bank of America 2009 | 131 |
The Corporation enters into derivative commodity contracts such as futures, swaps, options and forwards as well as non-derivative commodity contracts to provide price risk management services to customers or to manage price risk associated with its physical and financial commodity positions. The non-derivative commodity contracts and physical inventories of commodities expose the Corporation to earnings volatility. Cash flow and fair value accounting hedges provide a method to mitigate a portion of this earnings volatility.
The Corporation purchases credit derivatives to manage credit risk related to certain funded and unfunded credit exposures. Credit derivatives include credit default swaps, total return swaps and swaptions. These derivatives are accounted for as economic hedges and changes in fair value are recorded in other income.
Derivatives Designated as Accounting Hedges
The Corporation uses various types of interest rate, commodity and foreign exchange derivative contracts to protect against changes in the fair value of its assets and liabilities due to fluctuations in interest rates, exchange rates and commodity prices (fair value hedges). The Corporation also uses these types of contracts to protect against changes in the cash flows of its assets and liabilities, and other forecasted transactions (cash flow hedges). The Corporation hedges its net investment in consolidated foreign operations determined to have functional currencies other than the U.S. dollar using forward exchange contracts that typically settle in 90 days, cross-currency basis swaps, and by issuing foreign currency-denominated debt.
The following table summarizes certain information related to the Corporation's derivatives designated as fair value hedges for 2009 and 2008.
| Amounts Recognized in Income | |||||||||||||||||||||||||
| 2009 | 2008 | ||||||||||||||||||||||||
| (Dollars in millions) | Derivative | Hedged Item | Hedge Ineffectiveness | Derivative | Hedged Item | Hedge Ineffectiveness | |||||||||||||||||||
Derivatives designated as fair value hedges | |||||||||||||||||||||||||
Interest rate risk on long-term debt (1) | $ | (4,858 | ) | $ | 4,082 | $ | (776 | ) | $ | 4,340 | $ | (4,143 | ) | $ | 197 | ||||||||||
| Interest rate and foreign currency risk on long-term debt (1) | 932 | (858 | ) | 74 | 294 | (444 | ) | (150 | ) | ||||||||||||||||
Interest rate risk on available-for-sale securities (2 , 3 ) | 791 | (1,141 | ) | (350 | ) | 32 | (51 | ) | (19 | ) | |||||||||||||||
Commodity price risk on commodity inventory ( 4 ) | (51 | ) | 51 | - | n/a | n/a | n/a | ||||||||||||||||||
Total (5) | $ | (3,186 | ) | $ | 2,134 | $ | (1,052 | ) | $ | 4,666 | $ | (4,638 | ) | $ | 28 | ||||||||||
| (1) | Amounts are recorded in interest expense on long-term debt. |
| (2) | Amounts are recorded in interest income on AFS securities. |
| (3 ) | Measurement of ineffectiveness in 2009 includes $354 million of interest costs on short forward contracts. The Corporation considers this as part of the cost of hedging, and is offset by the fixed coupon receipt on the AFS security that is recognized in interest income on securities. |
| ( 4 ) | Amounts are recorded in trading account profits (losses). |
| (5) | For 2007, hedge ineffectiveness recognized in net interest income was $55 million. |
| n/a | = not applicable |
The following table summarizes certain information related to the Corporation's derivatives designated as cash flow hedges and net investment hedges for 2009 and 2008. During the next 12 months, net losses in accumulated OCI of approximately $937 million ($590 million
after-tax) on derivative instruments that qualify as cash flow hedges are expected to be reclassified into earnings. These net losses reclassified into earnings are expected to reduce net interest income related to the respective hedged items.
| 2009 | 2008 | |||||||||||||||||||||||||
| (Dollars in millions, amounts pre-tax) | Amounts Recognized in OCI on Derivatives | Amounts Reclassified from OCI into Income | Hedge Ineffectiveness and Amount Excluded from Effectiveness Testing (1) | Amounts Recognized in OCI on Derivatives | Amounts Reclassified from OCI into Income | Hedge Ineffectiveness and Amount Excluded from Effectiveness Testing (1) | ||||||||||||||||||||
Derivatives designated as cash flow hedges | ||||||||||||||||||||||||||
| Interest rate risk on variable rate portfolios (2, 3, 4, 5) | $ | 579 | $ | (1,214 | ) | $ | 71 | $ | (82 | ) | $ | (1,334 | ) | $ | (7 | ) | ||||||||||
Commodity price risk on forecasted purchases | 72 | 70 | (2 | ) | n/a | n/a | n/a | |||||||||||||||||||
Price risk on equity investments included in available-for-sale securities | (331 | ) | – | – | 243 | – | – | |||||||||||||||||||
Total (7) | $ | 320 | $ | (1,144 | ) | $ | 69 | $ | 161 | $ | (1,334 | ) | $ | (7 | ) | |||||||||||
Net investment hedges | ||||||||||||||||||||||||||
Foreign exchange risk (8) | $ | (2,997 | ) | $ | – | $ | (142 | ) | $ | 2,814 | $ | – | $ | (192 | ) | |||||||||||
| (1) | Amounts related to derivatives designated as cash flow hedges represent hedge ineffectiveness and amounts related to net investment hedges represent amounts excluded from effectiveness testing. |
| (2) | Amounts reclassified from OCI reduced interest income on assets by $110 million and $224 million during 2009 and 2008, and increased interest expense on liabilities by $1.1 billion during both 2009 and 2008. |
| (3) | Hedge ineffectiveness of $73 million and $(10) million was recorded in interest income and $(2) million and $3 million was recorded in interest expense during 2009 and 2008. |
| (4) | Amounts recognized in OCI on derivatives exclude amounts related to terminated hedges of AFS securities of $(9) million and $206 million for 2009 and 2008. |
| (5) | Amounts reclassified from OCI exclude amounts related to derivative interest accruals which increased interest income by $104 million for 2009 and amounts which increased interest expense $73 million for 2008. |
| (6) | Gains reclassified from OCI into income were recorded in trading account profits (losses) during 2009, 2008 and 2007 were $44 million, $0 and $18 million, respectively, related to the discontinuance of cash flow hedging because it was probable that the original forecasted transaction would not occur. |
| (7) | For 2007, hedge ineffectiveness recognized in net interest income was $4 million. |
| (8) | Amounts recognized in OCI on derivatives exclude losses of $387 million related to long-term debt designated as a net investment hedge for 2009. |
| n/a | = not applicable |
| 132 | Bank of America 2009 |
Economic Hedges
Derivatives designated as economic hedges are used by the Corporation to reduce certain risk exposure but are not accounted for as accounting hedges. The following table presents gains (losses) on these derivatives for 2009 and 2008. These gains (losses) are largely offset by the income or expense that is recorded on the economically hedged item.
| (Dollars in millions) | 2009 | 2008 | ||||||
Price risk on mortgage banking production income (1, 2) | $ | 8,898 | $ | 892 | ||||
Interest rate risk on mortgage banking servicing income (1) | (3,792 | ) | 8,610 | |||||
Credit risk on loans and leases (3) | (698 | ) | 309 | |||||
Interest rate and foreign currency risk on long-term debt and other foreign exchange transactions (3) | 1,572 | (1,316 | ) | |||||
Other (3) | 14 | 34 | ||||||
Total | $ | 5,994 | $ | 8,529 | ||||
| (1) | Gains (losses) on these derivatives are recorded in mortgage banking income. |
| (2) | Includes gains on IRLCs related to the origination of mortgage loans that are held for sale, which are considered derivative instruments, of $8.4 billion for 2009 and $1.6 billion for 2008. |
| (3) | Gains (losses) on these derivatives are recorded in other income. |
Sales and Trading Revenue
The Corporation enters into trading derivatives to facilitate client transactions, for proprietary trading purposes, and to manage risk exposures arising from trading assets and liabilities. It is the Corporation's policy to include these derivative instruments in its trading activities which include derivative and non-derivative cash instruments. The resulting risk from these derivatives is managed on a portfolio basis as part of the Corporation's Global Markets business segment. The related sales and trading
revenue generated within Global Markets is recorded on different income statement line items including trading account profits (losses) and net interest income as well as other revenue categories. However, the vast majority of income related to derivative instruments is recorded in trading account profits (losses). The following table identifies the amounts in the income statement line items attributable to the Corporation's sales and trading revenue categorized by primary risk for 2009 and 2008.
| 2009 | 2008 | |||||||||||||||||||||||||||||||
| (Dollars in millions) | Trading Account Profits | Other Revenues (1) | Net Interest Income | Total | Trading Profits | Other Revenues (1) | Net Interest Income | Total | ||||||||||||||||||||||||
Interest rate risk | $ | 3,145 | $ | 33 | $ | 1,068 | $ | 4,246 | $ | 1,083 | $ | 47 | $ | 276 | $ | 1,406 | ||||||||||||||||
Foreign exchange risk | 972 | 6 | 26 | 1,004 | 1,320 | 6 | 13 | 1,339 | ||||||||||||||||||||||||
Equity risk | 2,041 | 2,613 | 246 | 4,900 | (66 | ) | 686 | 99 | 719 | |||||||||||||||||||||||
Credit risk | 4,433 | (2,576 | ) | 4,637 | 6,494 | (8,276 | ) | (6,881 | ) | 4,380 | (10,777 | ) | ||||||||||||||||||||
Other risk | 1,084 | 13 | (469 | ) | 628 | 130 | 58 | (14 | ) | 174 | ||||||||||||||||||||||
Total sales and trading revenue | $ | 11,675 | $ | 89 | $ | 5,508 | $ | 17,272 | $ | (5,809 | ) | $ | (6,084 | ) | $ | 4,754 | $ | (7,139 | ) | |||||||||||||
| (1) | Represents investment and brokerage services and other income recorded in Global Markets that the Corporation includes in its definition of sales and trading revenue. |
Credit Derivatives
The Corporation enters into credit derivatives primarily to facilitate client transactions and to manage credit risk exposures. Credit derivatives derive value based on an underlying third party-referenced obligation or a portfolio of referenced obligations and generally require the Corporation as the seller of credit protection to make payments to a buyer upon the occurrence of a predefined credit event. Such credit events generally
include bankruptcy of the referenced credit entity and failure to pay under the obligation, as well as acceleration of indebtedness and payment repudiation or moratorium. For credit derivatives based on a portfolio of referenced credits or credit indices, the Corporation may not be required to make payment until a specified amount of loss has occurred and/or may only be required to make payment up to a specified amount.
| Bank of America 2009 | 133 |
Credit derivative instruments in which the Corporation is the seller of credit protection and their expiration at December 31, 2009 and 2008 are summarized below. These instruments are classified as investment and non-investment grade based on the credit quality of the underlying
reference obligation. The Corporation considers ratings of BBB- or higher as meeting the definition of investment grade. Non-investment grade includes non-rated credit derivative instruments.
| December 31, 2009 | |||||||||||||||
| Carrying Value | |||||||||||||||
| (Dollars in millions) | Less than One Year | One to Three | Three to Five Years | Over Five Years | Total | ||||||||||
Credit default swaps: | |||||||||||||||
Investment grade | $ | 454 | $ | 5,795 | $ | 5,831 | $ | 24,586 | $ | 36,666 | |||||
Non-investment grade | 1,342 | 14,012 | 16,081 | 30,274 | 61,709 | ||||||||||
Total | 1,796 | 19,807 | 21,912 | 54,860 | 98,375 | ||||||||||
Total return swaps/other: | |||||||||||||||
Investment grade | 1 | 20 | 5 | 540 | 566 | ||||||||||
Non-investment grade | – | 194 | 3 | 291 | 488 | ||||||||||
Total | 1 | 214 | 8 | 831 | 1,054 | ||||||||||
Total credit derivatives | $ | 1,797 | $ | 20,021 | $ | 21,920 | $ | 55,691 | $ | 99,429 | |||||
| Maximum Payout/Notional | |||||||||||||||
Credit default swaps: | |||||||||||||||
Investment grade | $ | 147,501 | $ | 411,258 | $ | 596,103 | $ | 335,526 | $ | 1,490,388 | |||||
Non-investment grade | 123,907 | 417,834 | 399,896 | 356,735 | 1,298,372 | ||||||||||
Total | 271,408 | 829,092 | 995,999 | 692,261 | 2,788,760 | ||||||||||
Total return swaps/other: | |||||||||||||||
Investment grade | 31 | 60 | 1,081 | 8,087 | 9,259 | ||||||||||
Non-investment grade | 2,035 | 1,280 | 2,183 | 18,352 | 23,850 | ||||||||||
Total | 2,066 | 1,340 | 3,264 | 26,439 | 33,109 | ||||||||||
Total credit derivatives | $ | 273,474 | $ | 830,432 | $ | 999,263 | $ | 718,700 | $ | 2,821,869 | |||||
| December 31, 2008 | |||||||||||||||
| Carrying Value | |||||||||||||||
| (Dollars in millions) | Less than One Year | One to Three Years | Three to Five Years | Over Five Years | Total | ||||||||||
Credit default swaps: | |||||||||||||||
Investment grade | $ | 1,039 | $ | 13,062 | $ | 32,594 | $ | 29,153 | $ | 75,848 | |||||
Non-investment grade | 1,483 | 9,222 | 19,243 | 13,012 | 42,960 | ||||||||||
Total | 2,522 | 22,284 | 51,837 | 42,165 | 118,808 | ||||||||||
Total return swaps/other: | |||||||||||||||
Non-investment grade | 36 | 8 | – | 13 | 57 | ||||||||||
Total credit derivatives | $ | 2,558 | $ | 22,292 | $ | 51,837 | $ | 42,178 | $ | 118,865 | |||||
| Maximum Payout/Notional | |||||||||||||||
Credit default swaps: | |||||||||||||||
Investment grade | $ | 49,535 | $ | 169,508 | $ | 395,768 | $ | 187,075 | $ | 801,886 | |||||
Non-investment grade | 17,217 | 48,829 | 89,650 | 42,452 | 198,148 | ||||||||||
Total | 66,752 | 218,337 | 485,418 | 229,527 | 1,000,034 | ||||||||||
Total return swaps/other: | |||||||||||||||
Non-investment grade | 1,178 | 628 | 37 | 4,360 | 6,203 | ||||||||||
Total credit derivatives | $ | 67,930 | $ | 218,965 | $ | 485,455 | $ | 233,887 | $ | 1,006,237 | |||||
The notional amount represents the maximum amount payable by the Corporation for most credit derivatives. However, the Corporation does not solely monitor its exposure to credit derivatives based on notional amount because this measure does not take into consideration the probability of occurrence. As such, the notional amount is not a reliable indicator of the Corporation's exposure to these contracts. Instead, a risk framework is used to define risk tolerances and establish limits to help ensure that certain credit risk-related losses occur within acceptable, predefined limits.
The Corporation economically hedges its market risk exposure to credit derivatives by entering into a variety of offsetting derivative contracts and security positions. For example, in certain instances, the Corporation may purchase credit protection with identical underlying referenced names to offset its exposure. The carrying value and notional amount of written credit derivatives for which the Corporation held purchased credit derivatives with identical underlying referenced names at December 31, 2009 was $79.4 billion and $2.3 trillion compared to $92.4 billion and $819.4 billion at December 31, 2008.
| 134 | Bank of America 2009 |
Credit Risk Management of Derivatives and Credit-related Contingent Features
The Corporation executes the majority of its derivative contracts in the over-the-counter market with large, international financial institutions, including broker/dealers and, to a lesser degree, with a variety of non-financial companies. Substantially all of the derivative transactions are executed on a daily margin basis. Therefore, events such as a credit downgrade (depending on the ultimate rating level) or a breach of credit covenants would typically require an increase in the amount of collateral required of the counterparty, where applicable, and/or allow the Corporation to take additional protective measures such as early termination of all trades. Further, as discussed above, the Corporation enters into legally enforceable master netting agreements which reduce risk by permitting the closeout and netting of transactions with the same counterparty upon the occurrence of certain events.
Substantially all of the Corporation's derivative contracts contain credit risk-related contingent features, primarily in the form of International Swaps and Derivatives Association, Inc. (ISDA) master agreements that enhance the creditworthiness of these instruments as compared to other obligations of the respective counterparty with whom the Corporation has transacted (e.g., other debt or equity). These contingent features may be for the benefit of the Corporation, as well as its counterparties with respect to changes in the Corporation's creditworthiness. At December 31, 2009, the Corporation received cash and securities collateral of $74.6 billion and posted cash and securities collateral of $69.1 billion in the normal course of business under derivative agreements.
In connection with certain over-the-counter derivatives contracts and other trading agreements, the Corporation could be required to provide additional collateral or to terminate transactions with certain counterparties in the event of a downgrade of the senior debt ratings of Bank of America Corporation and its subsidiaries. The amount of additional collateral required depends on the contract and is usually a fixed incremental
amount and/or the market value of the exposure. At December 31, 2009, the amount of additional collateral and termination payments that would be required for such derivatives and trading agreements was approximately $2.1 billion if the long-term credit rating of Bank of America Corporation and its subsidiaries was incrementally downgraded by one level by all ratings agencies. A second incremental one level downgrade by the ratings agencies would require approximately $1.2 billion in additional collateral.
The Corporation records counterparty credit risk valuation adjustments on derivative assets in order to properly reflect the credit quality of the counterparty. These adjustments are necessary as the market quotes on derivatives do not fully reflect the credit risk of the counterparties to the derivative assets. The Corporation considers collateral and legally enforceable master netting agreements that mitigate its credit exposure to each counterparty in determining the counterparty credit risk valuation adjustment. All or a portion of these counterparty credit risk valuation adjustments can be reversed or otherwise adjusted in future periods due to changes in the value of the derivative contract, collateral and creditworthiness of the counterparty. During 2009, credit valuation gains of $1.8 billion for counterparty credit risk related to derivative assets and during 2008, losses of $3.2 billion were recognized in trading account profits (losses). At December 31, 2009 and 2008, the cumulative counterparty credit risk valuation adjustment that was included in the derivative asset balance was $7.6 billion and $4.0 billion.
In addition, the fair value of the Corporation's or its subsidiaries' derivative liabilities is adjusted to reflect the impact of the Corporation's credit quality. During 2009, credit valuation losses of $801 million and during 2008, gains of $364 million were recognized in trading account profits (losses) for changes in the Corporation's or its subsidiaries' credit risk. At December 31, 2009 and 2008, the Corporation's cumulative credit risk valuation adjustment that was included in the derivative liabilities balance was $608 million and $573 million.
| Bank of America 2009 | 135 |
NOTE 5 – Securities
The amortized cost, gross unrealized gains and losses in accumulated OCI, and fair value of AFS debt and marketable equity securities at December 31, 2009 and 2008 were:
| (Dollars in millions) | Amortized Cost | Gross Unrealized Gains | Gross Unrealized Losses | Fair Value | |||||||||
Available-for-sale debt securities, December 31, 2009 | |||||||||||||
U.S. Treasury and agency securities | $ | 22,648 | $ | 414 | $ | (37 | ) | $ | 23,025 | ||||
Mortgage-backed securities: | |||||||||||||
Agency | 164,677 | 2,415 | (846 | ) | 166,246 | ||||||||
Agency-collateralized mortgage obligations | 25,330 | 464 | (13 | ) | 25,781 | ||||||||
Non-agency residential (1) | 37,940 | 1,191 | (4,028 | ) | 35,103 | ||||||||
Non-agency commercial | 6,354 | 671 | (116 | ) | 6,909 | ||||||||
Foreign securities | 4,732 | 61 | (896 | ) | 3,897 | ||||||||
Corporate bonds | 6,136 | 182 | (126 | ) | 6,192 | ||||||||
Other taxable securities (2) | 19,475 | 245 | (478 | ) | 19,242 | ||||||||
Total taxable securities | 287,292 | 5,643 | (6,540 | ) | 286,395 | ||||||||
Tax-exempt securities | 15,334 | 115 | (243 | ) | 15,206 | ||||||||
Total available-for-sale debt securities | $ | 302,626 | $ | 5,758 | $ | (6,783 | ) | $ | 301,601 | ||||
Available-for-sale marketable equity securities (3) | $ | 6,020 | $ | 3,895 | $ | (507 | ) | $ | 9,408 | ||||
Available-for-sale debt securities, December 31, 2008 | |||||||||||||
U.S. Treasury and agency securities | $ | 4,540 | $ | 121 | $ | (14 | ) | $ | 4,647 | ||||
Mortgage-backed securities: | |||||||||||||
Agency | 191,913 | 3,064 | (146 | ) | 194,831 | ||||||||
Non-agency residential | 40,139 | 860 | (8,825 | ) | 32,174 | ||||||||
Non-agency commercial | 3,085 | – | (512 | ) | 2,573 | ||||||||
Foreign securities | 5,675 | 6 | (678 | ) | 5,003 | ||||||||
Corporate bonds | 5,560 | 31 | (1,022 | ) | 4,569 | ||||||||
Other taxable securities (2) | 24,832 | 11 | (1,300 | ) | 23,543 | ||||||||
Total taxable securities | 275,744 | 4,093 | (12,497 | ) | 267,340 | ||||||||
Tax-exempt securities | 10,501 | 44 | (981 | ) | 9,564 | ||||||||
Total available-for-sale debt securities | $ | 286,245 | $ | 4,137 | $ | (13,478 | ) | $ | 276,904 | ||||
Available-for-sale marketable equity securities (3) | $ | 18,892 | $ | 7,717 | $ | (1,537 | ) | $ | 25,072 | ||||
| (1) | Includes approximately 85 percent of prime bonds, 10 percent of Alt-A bonds and five percent of subprime bonds. |
| (2) | Includes substantially all ABS. |
| (3) | Recorded in other assets on the Corporation's Consolidated Balance Sheet. |
At December 31, 2009, the amortized cost and fair value of HTM debt securities was $9.8 billion and $9.7 billion, which includes ABS that were issued by the Corporation's credit card securitization trust and retained by the Corporation with an amortized cost of $6.6 billion and a fair value of $6.4 billion. At December 31, 2008, both the amortized cost and fair value of HTM debt securities were $685 million. The accumulated net unrealized gains (losses) on AFS debt and marketable equity securities included in accumulated OCI were $(628) million and $2.1 billion, net of the related income tax expense (benefit) of $(397) million and $1.3 billion. At December 31, 2009 and 2008, the Corporation had nonperforming AFS debt securities of $467 million and $291 million.
During 2009, the Corporation transferred $5.6 billion of auction rate securities (ARS) from trading account assets to AFS debt securities due to the Corporation's decision to hold these securities. During 2008, the Corporation reclassified $12.6 billion of AFS debt securities to trading account assets in connection with the Countrywide acquisition as the Corporation realigned its AFS portfolio. Further, the Corporation transferred $1.7 billion of leveraged lending bonds from trading account assets to AFS debt securities due to the Corporation's decision to hold these bonds.
During 2009, the Corporation recorded other-than-temporary impairment losses on AFS and HTM debt securities as follows:
| 2009 | ||||||||||||||||||||||||
| (Dollars in millions) | Non-agency Residential MBS | Non-agency Commercial MBS | Foreign Securities | Corporate Bonds | Other Taxable Securities (1) | Total | ||||||||||||||||||
Total other-than-temporary impairment losses (unrealized | $ | (2,240 | ) | $ | (6 | ) | $ | (360 | ) | $ | (87 | ) | $ | (815 | ) | $ | (3,508 | ) | ||||||
Unrealized other-than-temporary impairment losses | 672 | – | – | – | – | 672 | ||||||||||||||||||
Net impairment losses recognized in earnings ( 3) | $ | (1,568 | ) | $ | (6 | ) | $ | (360 | ) | $ | (87 | ) | $ | (815 | ) | $ | (2,836 | ) | ||||||
| (1) | Includes $31 million of other-than-temporary impairment losses on HTM debt securities. |
| (2) | Represents the noncredit component of other-than-temporary impairment losses on AFS debt securities. For 2009, for certain securities, the Corporation recognized credit losses in excess of unrealized losses in OCI. In these instances, a portion of the credit losses recognized in earnings has been offset by an unrealized gain. Balances above exclude $582 million of gross gains recorded in OCI related to these securities for 2009. |
| (3) | Represents the credit component of other-than-temporary impairment losses on AFS and HTM debt securities. |
| 136 | Bank of America 2009 |
Activity related to the credit component recognized in earnings on debt securities held by the Corporation for which a portion of the other-than-temporary impairment loss remains in OCI for 2009 is as follows:
| (Dollars in millions) | 2009 | ||
Balance, January 1, 2009 | $ | – | |
Credit component of other-than-temporary impairment not reclassified to OCI in connection with the cumulative-effect transition adjustment (1) | 22 | ||
Additions for the credit component on debt securities on which other-than temporary impairment was not previously recognized (2) | 420 | ||
Balance, December 31, 2009 | $ | 442 | |
| (1) | As of January 1, 2009, the Corporation had securities with $134 million of other-than-temporary impairment previously recognized in earnings of which $22 million represented the credit component and $112 million represented the noncredit component which was reclassified to OCI through a cumulative-effect transition adjustment. |
| (2) | During 2009, the Corporation recognized $2.4 billion of other-than-temporary impairment losses on debt securities in which no portion of other-than-temporary impairment loss remained in OCI. Other-than-temporary impairment losses related to these securities are excluded from these amounts. |
As of December 31, 2009, those debt securities with other-than-temporary impairment for which a portion of the other-than-temporary impairment loss remains in OCI consisted entirely of non-agency residential Mortgage-backed Securities (MBS). The Corporation estimates the portion of loss attributable to credit using a discounted cash flow model. The Corporation estimates the expected cash flows of the underlying collateral using internal credit risk, interest rate and prepayment risk models that incorporate management's best estimate of current key assumptions such as default rates, loss severity and prepayment rates. Assumptions
used can vary widely from loan to loan, and are influenced by such factors as loan interest rate, geographical location of the borrower, borrower characteristics and collateral type. The Corporation then uses a third party vendor to determine how the underlying collateral cash flows will be distributed to each security issued from the structure. Expected principal and interest cash flows on the impaired debt security are discounted using the book yield of each individual impaired debt security.
Based on the expected cash flows derived from the model, the Corporation expects to recover the unrealized losses in accumulated OCI on non-agency residential MBS. Significant assumptions used in the valuation of non-agency residential MBS were as follows at December 31, 2009.
| Range (1) | |||||||||||
| Weighted- average | 10 th Percentile (2) | 90 th Percentile (2) | |||||||||
Prepayment speed (3) | 14.0 | % | 3.0 | % | 32.7 | % | |||||
Loss severity (4) | 51.0 | 21.8 | 61.3 | ||||||||
Life default rate (5) | 48.4 | 1.1 | 98.7 | ||||||||
| (1) | Represents the range of inputs/assumptions based upon the underlying collateral. |
| (2) | The value of a variable below which the indicated percentile of observations will fall. |
| (3) | Annual constant prepayment speed. |
| (4) | Loss severity rates are projected considering collateral characteristics such as LTV, creditworthiness of borrowers (FICO score) and geographic concentration. Weighted-average severity by collateral type was 47 percent for prime bonds, 52 percent for Alt-A bonds and 55 percent for subprime bonds. |
| (5) | Default rates are projected by considering collateral characteristics including, but not limited to LTV, FICO and geographic concentration. Weighted-average life default rate by collateral type was 36 percent for prime bonds, 56 percent for Alt-A bonds and 65 percent for subprime bonds. |
| Bank of America 2009 | 137 |
The following table presents the current fair value and the associated gross unrealized losses on investments in securities with gross unrealized losses at December 31, 2009 and 2008. The table also discloses
whether these securities have had gross unrealized losses for less than twelve months, or for twelve months or longer.
| Less than Twelve Months | Twelve Months or Longer | Total | |||||||||||||||||||
| (Dollars in millions) | Fair Value | Gross Unrealized Losses | Fair Value | Gross Unrealized Losses | Fair Value | Gross Unrealized Losses | |||||||||||||||
Temporarily-impaired available-for-sale debt securities at December 31, 2009 | |||||||||||||||||||||
U.S. Treasury and agency securities | $ | 4,655 | $ | (37 | ) | $ | – | $ | – | $ | 4,655 | $ | (37 | ) | |||||||
Mortgage-backed securities: | |||||||||||||||||||||
Agency | 53,979 | (817 | ) | 740 | (29 | ) | 54,719 | (846 | ) | ||||||||||||
Agency-collateralized mortgage obligations | 965 | (10 | ) | 747 | (3 | ) | 1,712 | (13 | ) | ||||||||||||
Non-agency residential | 6,907 | (557 | ) | 13,613 | (3,370 | ) | 20,520 | (3,927 | ) | ||||||||||||
Non-agency commercial | 1,263 | (35 | ) | 1,711 | (81 | ) | 2,974 | (116 | ) | ||||||||||||
Foreign securities | 169 | (27 | ) | 3,355 | (869 | ) | 3,524 | (896 | ) | ||||||||||||
Corporate bonds | 1,157 | (71 | ) | 294 | (55 | ) | 1,451 | (126 | ) | ||||||||||||
Other taxable securities | 3,779 | (70 | ) | 932 | (408 | ) | 4,711 | (478 | ) | ||||||||||||
Total taxable securities | 72,874 | (1,624 | ) | 21,392 | (4,815 | ) | 94,266 | (6,439 | ) | ||||||||||||
Tax-exempt securities | 4,716 | (93 | ) | 1,989 | (150 | ) | 6,705 | (243 | ) | ||||||||||||
Total temporarily-impaired available-for-sale | 77,590 | (1,717 | ) | 23,381 | (4,965 | ) | 100,971 | (6,682 | ) | ||||||||||||
Temporarily-impaired available-for-sale marketable | 338 | (113 | ) | 1,554 | (394 | ) | 1,892 | (507 | ) | ||||||||||||
Total temporarily-impaired available-for-sale securities | 77,928 | (1,830 | ) | 24,935 | (5,359 | ) | 102,863 | (7,189 | ) | ||||||||||||
Other-than-temporarily impaired available-for-sale | |||||||||||||||||||||
Mortgage-backed securities: | |||||||||||||||||||||
Non-agency residential | 51 | (17 | ) | 1,076 | (84 | ) | 1,127 | (101 | ) | ||||||||||||
Total temporarily-impaired and other-than-temporarily impaired available-for-sale securities | $ | 77,979 | $ | (1,847 | ) | $ | 26,011 | $ | (5,443 | ) | $ | 103,990 | $ | (7,290 | ) | ||||||
Temporarily-impaired available-for-sale debt securities at December 31, 2008 | |||||||||||||||||||||
U.S. Treasury and agency securities | $ | 306 | $ | (14 | ) | $ | – | $ | – | $ | 306 | $ | (14 | ) | |||||||
Mortgage-backed securities: | |||||||||||||||||||||
Agency | 2,282 | (12 | ) | 7,508 | (134 | ) | 9,790 | (146 | ) | ||||||||||||
Non-agency residential | 19,853 | (6,750 | ) | 1,783 | (2,075 | ) | 21,636 | (8,825 | ) | ||||||||||||
Non-agency commercial | 215 | (26 | ) | 2,358 | (486 | ) | 2,573 | (512 | ) | ||||||||||||
Foreign securities | 3,491 | (562 | ) | 1,126 | (116 | ) | 4,617 | (678 | ) | ||||||||||||
Corporate bonds | 2,573 | (934 | ) | 666 | (88 | ) | 3,239 | (1,022 | ) | ||||||||||||
Other taxable securities | 12,870 | (1,077 | ) | 501 | (223 | ) | 13,371 | (1,300 | ) | ||||||||||||
Total taxable securities | 41,590 | (9,375 | ) | 13,942 | (3,122 | ) | 55,532 | (12,497 | ) | ||||||||||||
Tax-exempt securities | 6,386 | (682 | ) | 1,540 | (299 | ) | 7,926 | (981 | ) | ||||||||||||
Total temporarily-impaired available-for-sale | 47,976 | (10,057 | ) | 15,482 | (3,421 | ) | 63,458 | (13,478 | ) | ||||||||||||
Temporarily-impaired available-for-sale marketable | 3,431 | (499 | ) | 1,555 | (1,038 | ) | 4,986 | (1,537 | ) | ||||||||||||
Total temporarily-impaired available-for-sale securities | $ | 51,407 | $ | (10,556 | ) | $ | 17,037 | $ | (4,459 | ) | $ | 68,444 | $ | (15,015 | ) | ||||||
| (1) | Includes other-than-temporarily impaired available-for-sale debt securities in which a portion of the other-than-temporary impairment loss remains in OCI. |
The impairment of AFS debt and marketable equity securities is based on a variety of factors, including the length of time and extent to which the market value has been less than cost, the financial condition of the issuer of the security, and the Corporation's intent and ability to hold the security to recovery.
At December 31, 2009, the amortized cost of approximately 12,000 AFS securities exceeded their fair value by $7.3 billion. Included in the $7.3 billion of gross unrealized losses on AFS securities at December 31, 2009, was $1.9 billion of gross unrealized losses that have existed for less than twelve months and $5.4 billion of gross unrealized losses that have existed for a period of twelve months or longer. Of the gross unreal -
ized losses existing for twelve months or longer, $3.6 billion, or 66 percent, of the gross unrealized losses are related to approximately 500 MBS primarily due to continued deterioration in collateralized mortgage obligation values driven by illiquidity in the markets. In addition, of the gross unrealized losses existing for twelve months or longer, $394 million, or seven percent, is related to approximately 800 AFS marketable equity securities primarily due to the overall decline in the market during 2008. The Corporation has no intent to sell these securities and it is not more-likely-than-not that the Corporation will be required to sell these securities before recovery of amortized cost.
| 138 | Bank of America 2009 |
The amortized cost and fair value of the Corporation's investment in AFS debt securities from the Federal National Mortgage Association (FNMA), Government National Mortgage Association (GNMA) and the
Federal Home Loan Mortgage Corporation (FHLMC) that exceeded 10 percent of consolidated shareholders' equity at December 31, 2009 and 2008 were:
| December 31 | ||||||||||||||
| 2009 | 2008 | |||||||||||||
| (Dollars in millions) | Amortized Cost | Fair Value | Amortized Cost | Fair Value | ||||||||||
Federal National Mortgage Association | $ | 100,321 | $ | 101,096 | $ | 102,908 | $ | 104,126 | ||||||
Government National Mortgage Association | 60,610 | 61,121 | 43,713 | 44,627 | ||||||||||
Federal Home Loan Mortgage Corporation | 29,076 | 29,810 | 46,114 | 46,859 | ||||||||||
Securities are pledged or assigned to secure borrowed funds, government and trust deposits and for other purposes. The carrying value of pledged securities was $122.7 billion and $158.9 billion at December 31, 2009 and 2008.
The expected maturity distribution of the Corporation's MBS and the contractual maturity distribution of the Corporation's other debt secu -
rities, and the yields of the Corporation's AFS debt securities portfolio at December 31, 2009 are summarized in the following table. Actual maturities may differ from the contractual or expected maturities since borrowers may have the right to prepay obligations with or without prepayment penalties.
| December 31, 2009 | ||||||||||||||||||||||||||||||||||||||
| Due in One Year or Less | Due after One Year through Five Years | Due after Five Years through Ten Years | Due after Ten Years | Total | ||||||||||||||||||||||||||||||||||
| (Dollars in millions) | Amount | Yield (1) | Amount | Yield (1) | Amount | Yield (1) | Amount | Yield (1) | Amount | Yield (1) | ||||||||||||||||||||||||||||
Fair value of available-for-sale debt securities | ||||||||||||||||||||||||||||||||||||||
U.S. Treasury and agency securities | $ | 231 | 1.94 | % | $ | 1,888 | 3.31 | % | $ | 2,774 | 4.78 | % | $ | 18,132 | 4.73 | % | $ | 23,025 | 4.59 | % | ||||||||||||||||||
Mortgage-backed securities: | ||||||||||||||||||||||||||||||||||||||
Agency | 28 | 5.48 | 78,579 | 4.81 | 33,351 | 4.66 | 54,288 | 4.52 | 166,246 | 4.69 | ||||||||||||||||||||||||||||
Agency-collateralized mortgage obligations | 495 | 3.83 | 12,360 | 2.39 | 12,778 | 2.53 | 148 | 0.98 | 25,781 | 2.48 | ||||||||||||||||||||||||||||
Non-agency residential | 757 | 8.58 | 18,068 | 9.34 | 4,790 | 7.61 | 11,488 | 4.09 | 35,103 | 7.38 | ||||||||||||||||||||||||||||
Non-agency commercial | 132 | 4.22 | 3,729 | 5.91 | 2,779 | 10.89 | 269 | 6.17 | 6,909 | 7.63 | ||||||||||||||||||||||||||||
Foreign securities | 105 | 3.03 | 1,828 | 6.33 | 96 | 5.60 | 1,868 | 3.21 | 3,897 | 4.53 | ||||||||||||||||||||||||||||
Corporate bonds | 592 | 1.22 | 3,311 | 3.68 | 1,662 | 7.47 | 627 | 2.59 | 6,192 | 4.31 | ||||||||||||||||||||||||||||
Other taxable securities | 12,297 | 1.17 | 5,921 | 3.92 | 203 | 7.19 | 821 | 4.00 | 19,242 | 2.24 | ||||||||||||||||||||||||||||
Total taxable securities | 14,637 | 1.82 | 125,684 | 5.24 | 58,433 | 4.81 | 87,641 | 4.45 | 286,395 | 4.73 | ||||||||||||||||||||||||||||
Tax-exempt securities (2) | 6,413 | 0.28 | 1,772 | 6.38 | 3,450 | 6.39 | 3,571 | 5.29 | 15,206 | 3.56 | ||||||||||||||||||||||||||||
Total available-for-sale debt securities | $ | 21,050 | 1.35 | $ | 127,456 | 5.25 | $ | 61,883 | 4.89 | $ | 91,212 | 4.48 | $ | 301,601 | 4.67 | |||||||||||||||||||||||
Amortized cost of available-for-sale debt securities | $ | 21,271 | $ | 127,395 | $ | 61,103 | $ | 92,857 | $ | 302,626 | ||||||||||||||||||||||||||||
| (1) | Yields are calculated based on the amortized cost of the securities. |
| (2) | Yields of tax-exempt securities are calculated on a fully taxable-equivalent (FTE) basis. |
The components of realized gains and losses on sales of debt securities for 2009, 2008 and 2007 were:
| (Dollars in millions) | 2009 | 2008 | 2007 | |||||||||
Gross gains | $ | 5,047 | $ | 1,367 | $ | 197 | ||||||
Gross losses | (324 | ) | (243 | ) | (17 | ) | ||||||
Net gains on sales of debt securities | $ | 4,723 | $ | 1,124 | $ | 180 | ||||||
The income tax expense attributable to realized net gains on sales of debt securities was $1.7 billion, $416 million and $67 million in 2009, 2008 and 2007, respectively.
Certain Corporate and Strategic Investments
At December 31, 2009 and 2008, the Corporation owned approximately 11 percent, or 25.6 billion common shares and 19 percent, or 44.7 billion common shares of China Construction Bank (CCB). During 2009, the Corporation sold its initial investment of 19.1 billion common shares in CCB for a pre-tax gain of $7.3 billion. These shares were accounted for at
fair value and recorded as AFS marketable equity securities in other assets with an offset, net-of-tax, in accumulated OCI. The remaining investment of 25.6 billion common shares is accounted for at cost, is recorded in other assets and is non-transferable until August 2011. At December 31, 2009 and 2008, the cost of the CCB investment was $9.2 billion and $12.0 billion, the carrying value was $9.2 billion and $19.7 billion, and the fair value was $22.0 billion and $24.5 billion. Dividend income on this investment is recorded in equity investment income. The Corporation remains a significant shareholder in CCB and intends to continue the important long-term strategic alliance with CCB originally entered into in 2005. As part of this alliance, the Corporation expects to continue to provide advice and assistance to CCB.
At December 31, 2009 and 2008, the Corporation owned approximately 188.4 million and 171.3 million preferred shares and 56.5 million and 51.3 million common shares of Itaú Unibanco Holding S.A. (Itaú Unibanco). During 2009, the Corporation received a dividend of 17.1 million preferred shares and 5.2 million common shares. The Itaú Unibanco investment is accounted for at fair value and recorded as AFS marketable equity securities in other assets with an offset, net-of-tax, in accumulated OCI. Dividend income on this investment is recorded in
| Bank of America 2009 | 139 |
equity investment income. At December 31, 2009 and 2008, the cost of this investment was $2.6 billion and the fair value was $5.4 billion and $2.5 billion.
At December 31, 2009 and 2008, the Corporation had a 24.9 percent, or $2.5 billion and $2.1 billion, investment in Grupo Financiero Santander, S.A., the subsidiary of Grupo Santander, S.A. This investment is recorded in other assets and is accounted for under the equity method of accounting with income being recorded in equity investment income.
As part of the acquisition of Merrill Lynch, the Corporation acquired an economic ownership in BlackRock, a publicly traded investment company. At December 31, 2009, the carrying value was $10.0 billion representing approximately a 34 percent economic ownership interest in BlackRock. This investment is recorded in other assets and is accounted for using the equity method of accounting with income being recorded in equity investment income. During 2009, BlackRock completed its purchase of Barclays Global Investors, an asset management business, from Barclays PLC which had the effect of diluting the Corporation's ownership interest in BlackRock from approximately 50 percent to approximately 34 percent and, for accounting purposes, was treated as a sale of a portion of the Corporation's ownership interest. As a result, upon the closing of this transaction, the Corporation recorded an adjustment to its investment in
BlackRock, resulting in a pre-tax gain of $1.1 billion. The summarized earnings information for BlackRock, which represents 100 percent of BlackRock, includes revenues of $4.7 billion, operating income and income before income taxes of $1.3 billion, and net income of $875 million in 2009.
On June 26, 2009, the Corporation entered into a joint venture agreement with First Data Corporation (First Data) creating Banc of America Merchant Services, LLC. Under the terms of the agreement, the Corporation contributed its merchant processing business to the joint venture and First Data contributed certain merchant processing contracts and personnel resources. The Corporation recorded in other income a pre-tax gain of $3.8 billion related to this transaction. The Corporation owns approximately 46.5 percent of this joint venture, 48.5 percent is owned by First Data, with the remaining stake held by a third party investor. The third party investor has the right to put their interest to the joint venture which would have the effect of increasing the Corporation's ownership interest to 49 percent. The investment in the joint venture, which was initially recorded at a fair value of $4.7 billion, is being accounted for under the equity method of accounting with income being recorded in equity investment income. The carrying value at December 31, 2009 was $4.7 billion.
NOTE 6 – Outstanding Loans and Leases
Outstanding loans and leases at December 31, 2009 and 2008 were:
| December 31 | ||||||
| (Dollars in millions) | 2009 | 2008 | ||||
Consumer | ||||||
Residential mortgage (1) | $ | 242,129 | $ | 248,063 | ||
Home equity | 149,126 | 152,483 | ||||
Discontinued real estate (2) | 14,854 | 19,981 | ||||
Credit card – domestic | 49,453 | 64,128 | ||||
Credit card – foreign | 21,656 | 17,146 | ||||
Direct/Indirect consumer (3) | 97,236 | 83,436 | ||||
Other consumer (4) | 3,110 | 3,442 | ||||
Total consumer | 577,564 | 588,679 | ||||
Commercial | ||||||
Commercial – domestic (5) | 198,903 | 219,233 | ||||
Commercial real estate (6) | 69,447 | 64,701 | ||||
Commercial lease financing | 22,199 | 22,400 | ||||
Commercial – foreign | 27,079 | 31,020 | ||||
Total commercial loans | 317,628 | 337,354 | ||||
Commercial loans measured at fair value (7) | 4,936 | 5,413 | ||||
Total commercial | 322,564 | 342,767 | ||||
Total loans and leases | $ | 900,128 | $ | 931,446 | ||
| (1) | Includes foreign residential mortgages of $552 million at December 31, 2009 mainly from the Merrill Lynch acquisition. The Corporation did not have any material foreign residential mortgage loans prior to January 1, 2009. |
| (2) | Includes $13.4 billion and $18.2 billion of pay option loans and $1.5 billion and $1.8 billion of subprime loans at December 31, 2009 and 2008. The Corporation no longer originates these products. |
| (3) | Includes dealer financial services loans of $41.6 billion and $40.1 billion, consumer lending of $19.7 billion and $28.2 billion, securities-based lending margin loans of $12.9 billion and $0, and foreign consumer loans of $7.8 billion and $1.8 billion at December 31, 2009 and 2008. |
| (4) | Includes consumer finance loans of $2.3 billion and $2.6 billion, and other foreign consumer loans of $709 million and $618 million at December 31, 2009 and 2008. |
| (5) | Includes small business commercial – domestic loans, primarily credit card related, of $17.5 billion and $19.1 billion at December 31, 2009 and 2008. |
| (6) | Includes domestic commercial real estate loans of $66.5 billion and $63.7 billion and foreign commercial real estate loans of $3.0 billion and $979 million at December 31, 2009 and 2008. |
| (7) | Certain commercial loans are accounted for under the fair value option and include commercial – domestic loans of $3.0 billion and $3.5 billion, commercial – foreign loans of $1.9 billion and $1.7 billion, and commercial real estate loans of $90 million and $203 million at December 31, 2009 and 2008. See Note 20 – Fair Value Measurements for additional discussion of fair value for certain financial instruments. |
The Corporation mitigates a portion of its credit risk through synthetic securitizations which are cash collateralized and provide mezzanine risk protection of $2.5 billion which will reimburse the Corporation in the event that losses exceed 10 bps of the original pool balance. As of December 31, 2009 and 2008, $70.7 billion and $109.3 billion of mortgage loans were protected by these agreements. The decrease in these credit protected pools was due to approximately $12.1 billion in loan sales, a terminated transaction of $6.6 billion and principal payments
during the year. During 2009, $669 million was recognized in other income for amounts that will be reimbursed under these structures. As of December 31, 2009, the Corporation had a receivable of $1.0 billion from these structures for reimbursement of losses. In addition, the Corporation has entered into credit protection agreements with GSEs totaling $6.6 billion and $9.6 billion as of December 31, 2009 and 2008, providing full protection on conforming residential mortgage loans that become severely delinquent.
| 140 | Bank of America 2009 |
Nonperforming Loans and Leases
The following table presents the Corporation's nonperforming loans and leases, including nonperforming TDRs at December 31, 2009 and 2008. This table excludes performing TDRs and loans accounted for under the fair value option. Nonperforming LHFS are excluded from nonperforming loans and leases as they are recorded at the lower of cost or fair value. In addition, purchased impaired loans and past due consumer
credit card, consumer non-real estate-secured loans and leases, and business card loans are not considered nonperforming loans and leases and are therefore excluded from nonperforming loans and leases. Real estate-secured, past due consumer loans repurchased pursuant to the Corporation's servicing agreements with GNMA are not reported as nonperforming as repayments are guaranteed by the FHA.
Nonperforming Loans and Leases
| December 31 | ||||||
| (Dollars in millions) | 2009 | 2008 | ||||
Consumer | ||||||
Residential mortgage | $ | 16,596 | $ | 7,057 | ||
Home equity | 3,804 | 2,637 | ||||
Discontinued real estate | 249 | 77 | ||||
Direct/Indirect consumer | 86 | 26 | ||||
Other consumer | 104 | 91 | ||||
Total consumer | 20,839 | 9,888 | ||||
Commercial | ||||||
Commercial – domestic (1) | 5,125 | 2,245 | ||||
Commercial real estate | 7,286 | 3,906 | ||||
Commercial lease financing | 115 | 56 | ||||
Commercial – foreign | 177 | 290 | ||||
Total commercial | 12,703 | 6,497 | ||||
Total nonperforming loans and leases | $ | 33,542 | $ | 16,385 | ||
| (1) | Includes small business commercial – domestic loans of $200 million and $205 million at December 31, 2009 and 2008. |
Included in certain loan categories in the nonperforming table above are TDRs that were classified as nonperforming. At December 31, 2009 and 2008, the Corporation had $2.9 billion and $209 million of residential mortgages, $1.7 billion and $302 million of home equity, $486 million and $44 million of commercial – domestic loans, and $43 million and $5 million of discontinued real estate loans that were TDRs and classified as nonperforming. In addition to these amounts, the Corporation had performing TDRs that were on accrual status of $2.3 billion and $320 million of residential mortgages, $639 million and $1 million of home equity, $91 million and $13 million of commercial – domestic loans, and $35 million and $66 million of discontinued real estate.
Impaired Loans and Troubled Debt Restructurings
A loan is considered impaired when, based on current information and events, it is probable that the Corporation will be unable to collect all amounts due from the borrower in accordance with the contractual terms of the loan. Impaired loans include nonperforming commercial loans, commercial performing TDRs, and both performing and nonperforming consumer real estate TDRs. As defined in applicable accounting guidance, impaired loans exclude nonperforming consumer loans not modified in a TDR, and all commercial loans and leases accounted for under the fair value option. Purchased impaired loans are reported and discussed separately below.
At December 31, 2009 and 2008, the Corporation had $12.7 billion and $6.5 billion of commercial impaired loans and $7.7 billion and $903 million of consumer impaired loans. The average recorded investment in the commercial and consumer impaired loans for 2009, 2008 and 2007 was approximately $15.1 billion, $5.0 billion and $1.2 billion, respectively. At December 31, 2009 and 2008, the recorded investment in impaired loans requiring an allowance for loan and lease losses was $18.6 billion and $6.9 billion, and the related allowance for loan and lease losses was $3.0 billion and $720 million. For 2009, 2008 and 2007, interest income recognized on impaired loans totaled $266 million, $105 million and $130 million, respectively.
At December 31, 2009 and 2008, remaining commitments to lend additional funds to debtors whose terms have been modified in a commercial or consumer TDR were immaterial.
The Corporation seeks to assist customers that are experiencing financial difficulty through renegotiating credit card and consumer lending loans while ensuring compliance with Federal Financial Institutions Examination Council (FFIEC) guidelines. At December 31, 2009 and 2008, the Corporation had renegotiated consumer credit card – domestic held loans of $4.2 billion and $2.3 billion of which $3.1 billion and $1.7 billion were current or less than 30 days past due under the modified terms. In addition, at December 31, 2009 and 2008, the Corporation had renegotiated consumer credit card – foreign held loans of $898 million and $517 million of which $471 million and $287 million were current or less than 30 days past due under the modified terms, and consumer lending loans of $2.0 billion and $1.3 billion of which $1.5 billion and $854 million were current or less than 30 days past due under the modified terms. These renegotiated loans are excluded from nonperforming loans.
Purchased Impaired Loans
Purchased impaired loans are acquired loans with evidence of credit quality deterioration since origination for which it is probable at purchase date that the Corporation will be unable to collect all contractually required payments. In connection with the Countrywide acquisition in 2008, the Corporation acquired purchased impaired loans, substantially all of which are residential mortgage, home equity and discontinued real estate, with an unpaid principal balance of $47.7 billion and $55.4 billion and a carrying amount of $37.5 billion and $42.2 billion at December 31, 2009 and 2008. At December 31, 2009, the unpaid principal balance of Merrill Lynch purchased impaired consumer and commercial loans was $2.4 billion and $2.0 billion and the carrying amount of these loans was $2.1 billion and $692 million. As of the acquisition date of January 1, 2009, these loans had an unpaid principal balance of $2.7 billion and $2.9 billion and a fair value of $2.3 billion and $1.9 billion.
| Bank of America 2009 | 141 |
The following table provides details on purchased impaired loans obtained in the Merrill Lynch acquisition. This information is provided only for acquisitions that occurred in the current year.
Acquired Loan Information for Merrill Lynch as of January 1, 2009
| (Dollars in millions) | ||||
Contractually required payments including interest | $ | 6,205 | ||
Less: Nonaccretable difference | (1,357 | ) | ||
Cash flows expected to be collected (1) | 4,848 | |||
Less: Accretable yield | (627 | ) | ||
Fair value of loans acquired | $ | 4,221 | ||
| (1) | Represents undiscounted expected principal and interest cash flows upon acquisition. |
Consumer purchased impaired loans are accounted for on a pool basis. Pooled loans that are modified subsequent to acquisition are reviewed to compare modified contractual cash flows to the purchased impaired loan carrying value. If the present value of the modified cash flows is lower than the carrying value, the loan is removed from the purchased impaired loan pool at its carrying value, as well as any related allowance for loan and lease losses, and classified as a TDR. The carrying value of purchased impaired loan TDRs totaled $2.3 billion at December 31, 2009 of which $1.9 billion were on accrual status. The carrying value of these modified loans, net of allowance, was approximately 69 percent of the unpaid principal balance.
The Corporation recorded a $750 million provision for credit losses establishing a corresponding valuation allowance within the allowance for loan and lease losses for purchased impaired loans at December 31, 2008. The Corporation recorded $3.7 billion in provision, including a $3.5 billion addition to the allowance for loan and lease losses, related to the purchased impaired loan portfolio during 2009 due to a decrease in expected principal cash flows. The amount of the allowance for loan and lease losses associated with the purchased impaired loan portfolio was
$3.9 billion at December 31, 2009, primarily related to Countrywide.
The following table shows activity for the accretable yield on purchased impaired loans acquired from Countrywide and Merrill Lynch for 2009 and 2008. The decrease in expected cash flows during 2009 of $1.4 billion is primarily attributable to lower expected interest cash flows due to increased credit losses, faster prepayment assumptions and lower rates.
Accretable Yield Activity
| (Dollars in millions) | ||||
Accretable yield, July 1, 2008 (1) | $ | 19,549 | ||
Accretion | (1,667 | ) | ||
Disposals/transfers | (589 | ) | ||
Reclassifications to nonaccretable difference | (4,433 | ) | ||
Accretable yield, January 1, 2009 | 12,860 | |||
Merrill Lynch balance | 627 | |||
Accretion | (2,859 | ) | ||
Disposals/transfers (2) | (1,482 | ) | ||
Reclassifications to nonaccretable difference | (1,431 | ) | ||
Accretable yield, December 31, 2009 | $ | 7,715 | ||
| (1) | Represents the accretable yield of loans acquired from Countrywide at July 1, 2008. |
| (2) | Includes $1.2 billion in accretable yield related to loans restructured in TDRs in which the present value of modified cash flows was lower than expectations upon acquisition. These TDRs were removed from the purchased impaired loan pool. |
Loans Held-for-Sale
The Corporation had LHFS of $43.9 billion and $31.5 billion at December 31, 2009 and 2008. Proceeds from sales, securitizations and paydowns of LHFS were $365.1 billion, $142.1 billion and $107.1 billion for 2009, 2008 and 2007. Proceeds used for originations and purchases of LHFS were $369.4 billion, $127.5 billion and $123.0 billion for 2009, 2008 and 2007.
NOTE 7 – Allowance for Credit Losses
The following table summarizes the changes in the allowance for credit losses for 2009, 2008 and 2007.
| (Dollars in millions) | 2009 | 2008 | 2007 | |||||||||
Allowance for loan and lease losses, January 1 | $ | 23,071 | $ | 11,588 | $ | 9,016 | ||||||
Loans and leases charged off | (35,483 | ) | (17,666 | ) | (7,730 | ) | ||||||
Recoveries of loans and leases previously charged off | 1,795 | 1,435 | 1,250 | |||||||||
Net charge-offs | (33,688 | ) | (16,231 | ) | (6,480 | ) | ||||||
Provision for loan and lease losses | 48,366 | 26,922 | 8,357 | |||||||||
Write-downs on consumer purchased impaired loans (1) | (179 | ) | n/a | n/a | ||||||||
Other | (370 | ) | 792 | 695 | ||||||||
Allowance for loan and lease losses, December 31 | 37,200 | 23,071 | 11,588 | |||||||||
Reserve for unfunded lending commitments, January 1 | 421 | 518 | 397 | |||||||||
Provision for unfunded lending commitments | 204 | (97 | ) | 28 | ||||||||
Other | 862 | - | 93 | |||||||||
Reserve for unfunded lending commitments, December 31 | 1,487 | 421 | 518 | |||||||||
Allowance for credit losses, December 31 | $ | 38,687 | $ | 23,492 | $ | 12,106 | ||||||
| (1) | Represents the write-downs on certain pools of purchased impaired loans that exceed the original purchase accounting adjustments. |
n/a = not applicable
The Corporation recorded $3.7 billion in provision, including a $3.5 billion addition to the allowance for loan and leases losses, during 2009 specifically for the purchased impaired loan portfolio. The amount of the allowance for loan and lease losses associated with the purchased impaired loan portfolio was $3.9 billion at December 31, 2009.
In the above table, the 2009 "other" amount under allowance for loan and lease losses includes a $750 million reduction in the allowance for loan and lease losses related to $8.5 billion of credit card loans that were exchanged for a $7.8 billion HTM debt security that was issued by the Corporation's U.S. Credit Card Securitization Trust and retained by the
| 142 | Bank of America 2009 |
Corporation. This reduction was partially offset by a $340 million increase associated with the reclassification to other assets of the December 31, 2008 amount expected to be reimbursable under residential mortgage cash collateralized synthetic securitizations. The 2008 "other" amount under allowance for loan and lease losses, includes the $1.2 billion addition of the Countrywide allowance for loan losses as of July 1, 2008. The 2007 "other" amount under allowance for loan and lease losses includes the $725 million and $25 million additions of the LaSalle and U.S. Trust Corporation allowance for loan losses as of October 1, 2007 and July 1, 2007.
In the previous table, the 2009 "other" amount under the reserve for unfunded lending commitments represents the fair value of the acquired Merrill Lynch reserve excluding those accounted for under the fair value option, net of accretion and the impact of funding previously unfunded portions. The 2007 "other" amount under the reserve for unfunded lending commitments includes the $124 million addition of the LaSalle reserve as of October 1, 2007.
NOTE 8 – Securitizations
The Corporation routinely securitizes loans and debt securities. These securitizations are a source of funding for the Corporation in addition to transferring the economic risk of the loans or debt securities to third parties. In a securitization, various classes of debt securities may be issued and are generally collateralized by a single class of transferred assets which most often consist of residential mortgages, but may also include commercial mortgages, credit card receivables, home equity loans, automobile loans or MBS. The securitized loans may be serviced by the
Corporation or by third parties. With each securitization, the Corporation may retain a portion of the securities, subordinated tranches, interest-only strips, subordinated interests in accrued interest and fees on the securitized receivables or, in some cases, overcollateralization and cash reserve accounts, all of which are referred to as retained interests. These retained interests are recorded in other assets, AFS debt securities, or trading account assets and are generally carried at fair value or amounts that approximate fair value with changes recorded in income or accumulated OCI, or are recorded as HTM debt securities and carried at amortized cost. Changes in the fair value of credit card related interest- only strips are recorded in card income. In addition, the Corporation may enter into derivatives with the securitization trust to mitigate the trust's interest rate or foreign currency risk. These derivatives are entered into at market terms and are generally senior in payment. The Corporation also may serve as the underwriter and distributor of the securitization, serve as the administrator of the trust, and from time to time, make markets in securities issued by the securitization trusts.
First Lien Mortgage-related Securitizations
As part of its mortgage banking activities, the Corporation securitizes a portion of the residential mortgage loans it originates or purchases from third parties in conjunction with or shortly after loan closing or purchase. In addition, the Corporation may, from time to time, securitize commercial mortgages and first lien residential mortgages that it originates or purchases from other entities.
The following table summarizes selected information related to mortgage securitizations at and for the years ended December 31, 2009 and 2008.
| Residential Mortgage | ||||||||||||||||||||||||||||||||||
| Agency | Non-Agency | |||||||||||||||||||||||||||||||||
| Prime | Subprime | Alt-A | Commercial Mortgage | |||||||||||||||||||||||||||||||
| (Dollars in millions) | 2009 | 2008 | 2009 | 2008 | 2009 | 2008 | 2009 | 2008 | 2009 | 2008 | ||||||||||||||||||||||||
For the Year Ended December 31 | ||||||||||||||||||||||||||||||||||
Cash proceeds from new securitizations (1) | $ | 346,448 | $ | 123,653 | $ | – | $ | 1,038 | $ | – | $ | 1,377 | $ | – | $ | – | $ | 313 | $ | 3,557 | ||||||||||||||
Gains on securitizations (2,3) | 73 | 25 | – | 2 | – | 24 | – | – | – | 29 | ||||||||||||||||||||||||
Cash flows received on residual interests | – | – | 25 | 6 | 71 | 33 | 5 | 4 | 23 | – | ||||||||||||||||||||||||
At December 31 | ||||||||||||||||||||||||||||||||||
Principal balance outstanding (4) | 1,255,650 | 1,123,916 | 81,012 | 111,683 | 83,065 | 57,933 | 147,072 | 136,027 | 65,397 | 55,403 | ||||||||||||||||||||||||
Residual interests held | – | – | 9 | – | 2 | 13 | – | – | 48 | 7 | ||||||||||||||||||||||||
Senior securities held (5, 6) : | ||||||||||||||||||||||||||||||||||
Trading account assets | $ | 2,295 | $ | 1,308 | $ | 201 | $ | 367 | $ | 12 | $ | – | $ | 431 | $ | 278 | $ | 469 | $ | 168 | ||||||||||||||
Available-for-sale debt securities | 13,786 | 12,507 | 3,845 | 4,559 | 188 | 121 | 561 | 569 | 1,215 | 16 | ||||||||||||||||||||||||
Total senior securities held | $ | 16,081 | $ | 13,815 | $ | 4,046 | $ | 4,926 | $ | 200 | $ | 121 | $ | 992 | $ | 847 | $ | 1,684 | $ | 184 | ||||||||||||||
Subordinated securities held (5, 7) : | ||||||||||||||||||||||||||||||||||
Trading account assets | $ | – | $ | – | $ | – | $ | 23 | $ | – | $ | 3 | $ | – | $ | 1 | $ | 122 | $ | 136 | ||||||||||||||
Available-for-sale debt securities | – | – | 13 | 20 | 22 | 1 | 4 | 17 | 23 | – | ||||||||||||||||||||||||
Total subordinated securities held | $ | – | $ | – | $ | 13 | $ | 43 | $ | 22 | $ | 4 | $ | 4 | $ | 18 | $ | 145 | $ | 136 | ||||||||||||||
| (1) | The Corporation sells residential mortgage loans to GSEs in the normal course of business and receives MBS in exchange which may then be sold into the market to third party investors for cash proceeds. |
| (2) | Net of hedges |
| (3) | Substantially all of the residential mortgages securitized are initially classified as LHFS and accounted for under the fair value option. As such, gains are recognized on these LHFS prior to securitization. During 2009 and 2008, the Corporation recognized $5.5 billion and $1.6 billion of gains on these LHFS. |
| (4) | Generally, the Corporation as transferor will service the sold loans and thus recognize a MSR upon securitization. |
| (5) | As a holder of these securities, the Corporation receives scheduled interest and principal payments. During 2009 and 2008, there were no significant other-than-temporary impairment losses recorded on those securities classified as AFS debt securities. |
| (6) | At December 31, 2009 and 2008, substantially all of the residential mortgage held senior securities were valued using quoted market prices. At December 31, 2009, substantially all of the commercial mortgage held senior securities were valued using quoted market prices while at December 31, 2008 substantially all were valued using model valuations. |
| (7) | At December 31, 2009, substantially all of the residential mortgage held subordinated securities and all of the commercial mortgage held subordinated securities were valued using quoted market prices while at December 31, 2008 substantially all were valued using model valuations. |
In addition to the amounts included in the table above, during 2009, the Corporation purchased $49.2 billion of MBS from third parties and resecuritized them compared to $12.2 billion during 2008. Net gains,
which include net interest income earned during the holding period, totaled $213 million and $80 million in 2009 and 2008. At December 31, 2009 and 2008, the Corporation retained $543 million
| Bank of America 2009 | 143 |
and $1.0 billion of the senior securities issued in these transactions which were valued using quoted market prices and recorded in trading account assets.
The Corporation has consumer MSRs from the sale or securitization of mortgage loans. Servicing fee and ancillary fee income on consumer mortgage loans serviced, including securitizations where the Corporation has continuing involvement, were $6.2 billion and $3.5 billion in 2009 and 2008. Servicing advances on consumer mortgage loans, including securitizations where the Corporation has continuing involvement, were $19.3 billion and $8.8 billion at December 31, 2009 and 2008. In addition, the Corporation has retained commercial MSRs from the sale or securitization of commercial mortgage loans. Servicing fee and ancillary fee income on commercial mortgage loans serviced, including securitizations where the Corporation has continuing involvement, were $49 million and $40 million in 2009 and 2008. Servicing advances on commercial mortgage loans, including securitizations where the Corporation has continuing involvement, were $109 million and $14 million at December 31, 2009 and 2008. For more information on MSRs, see Note 22 – Mortgage Servicing Rights .
The Corporation sells mortgage loans and, in the past sold home equity loans, with various representations and warranties related to, among other things, the ownership of the loan, validity of the lien securing the loan, absence of delinquent taxes or liens against the property securing the loan, the process used in selecting the loans for inclusion in a transaction, the loan's compliance with any applicable loan criteria established by the buyer, and the loan's compliance with applicable local, state and federal laws. Under the Corporation's representations and warranties, the Corporation may be required to repurchase the mortgage loans with the identified defects, indemnify or provide other recourse to the investor or insurer. In such cases, the Corporation bears any subsequent credit loss on the mortgage loans. The Corporation's representations and warranties are generally not subject to stated limits and extend over the life of the loan. However, the Corporation's contractual liability arises only if there is a breach of the representations and warranties that materially and adversely affects the interest of the investor or pursuant to such other standard established by the terms of the related selling agreement. The Corporation attempts to limit its risk of incurring these losses by structuring its operations to ensure consistent production of quality mortgages and servicing those mortgages at levels that meet secondary mortgage market standards. In addition, certain of the Corporation's securitizations include corporate guarantees that are contracts written to protect purchasers of the loans from credit losses up to a specified amount. The estimated losses to be absorbed under the guarantees are recorded when the Corporation sells the loans with guarantees. The methodology used to estimate the liability for representations and warranties considers a variety of factors and is a function of the representations and warranties given, estimated defaults, historical loss experience and probability that the Corporation will be required to repurchase the loan. The Corporation records its liability for representations and warranties, and corporate guarantees in accrued expenses and other liabilities and records the related expense in mortgage banking income. During 2009 and 2008, the Corporation recorded representations and warranties expense of $1.9 billion and $246 million. During 2009 and 2008, the Corporation repurchased $1.5 billion and $448 million of loans from first lien securitization trusts under the Corporation's representations and warranties and corporate guarantees and paid $730 million and $77 million to indemnify the investors or insurers. In addition,
during 2009, the Corporation repurchased $13.1 billion of loans from first lien securitization trusts as a result of modifications, loan delinquencies or optional clean-up calls.
Credit Card Securitizations
The Corporation securitizes originated and purchased credit card loans. The Corporation's continuing involvement includes servicing the receivables, retaining an undivided interest (the "seller's interest") in the receivables, and holding certain retained interests in credit card securitization trusts including senior and subordinated securities, interest-only strips, discount receivables, subordinated interests in accrued interest and fees on the securitized receivables and cash reserve accounts. The securitization trusts' legal documents require the Corporation to maintain a minimum seller's interest of four to five percent, and at December 31, 2009, the Corporation is in compliance with this requirement. The seller's interest in the trusts represents the Corporation's undivided interest in the receivables transferred to the trust and is pari passu to the investors' interest. The seller's interest is not represented by security certificates, is carried at historical cost, and is classified in loans on the Corporation's Consolidated Balance Sheet. At December 31, 2009 and 2008, the Corporation had $10.8 billion and $14.8 billion of seller's interest.
As specifically permitted by the terms of the transaction documents, and in an effort to address the recent decline in the excess spread due to the performance of the underlying credit card receivables in the U.S. Credit Card Securitization Trust, an additional subordinated security with a stated interest rate of zero percent was issued by the trust to the Corporation during 2009 (the Class D security). As the issuance was not treated as a sale, the Class D security was recorded at $7.8 billion representing the carry-over basis of the seller's interest which is comprised of the $8.5 billion book value of the loans exchanged less the associated $750 million allowance for loan and lease losses, and was classified as HTM. Future principal and interest cash flows on the loans exchanged for the Class D security will be returned to the Corporation through its ownership of the Class D security and the U.S. Credit Card Securitization Trust's residual interest. Income on this residual interest is presently recognized in card income as cash is received. The Class D security is subject to review for impairment at least on a quarterly basis. As the Corporation expects to receive all of the contractually due cash flows on the Class D security, there was no other-than-temporary impairment at December 31, 2009. In addition, as permitted by the transaction documents, the Corporation specified that from March 1, 2009 through September 30, 2009 a percentage of new receivables transferred to the trust will be deemed "discount receivables" and collections thereon will be added to finance charges which have increased the yield in the trust. Through the designation of these newly transferred receivables as discount receivables, the Corporation has subordinated a portion of its seller's interest to the investors' interest. The discount receivables were initially accounted for at the carry-over basis of the seller's interest and are subject to impairment review at least on a quarterly basis. No impairment on the discount receivables has been recognized as of December 31, 2009. During 2009, the Corporation extended this agreement through March 31, 2010. The carrying amount and fair value of the discount receivables were both $3.6 billion, and the carrying amount and fair value of the retained Class D security was $6.6 billion and $6.4 billion at December 31, 2009. These actions did not have a significant impact on the Corporation's results of operations.
| 144 | Bank of America 2009 |
The following table summarizes selected information related to credit card securitizations at and for the year ended December 31, 2009 and 2008.
| Credit Card | ||||||
| (Dollars in millions) | 2009 | 2008 | ||||
For the Year Ended December 31 | ||||||
Cash proceeds from new securitizations | $ | 650 | $ | 20,148 | ||
Gains on securitizations | - | 81 | ||||
Collections reinvested in revolving period securitizations | 133,771 | 162,332 | ||||
Cash flows received on residual interests | 5,512 | 5,771 | ||||
At December 31 | ||||||
Principal balance outstanding (1) | 103,309 | 114,141 | ||||
Senior securities held (2) | 7,162 | 4,965 | ||||
Subordinated securities held (3) | 7,993 | 1,837 | ||||
Other subordinated or residual interests held (4) | 5,195 | 2,233 | ||||
| (1) | Principal balance outstanding represents the principal balance of credit card receivables that have been legally isolated from the Corporation including those loans represented by the seller's interest that are still held on the Corporation's Consolidated Balance Sheet. |
| (2) | At December 31, 2009 and 2008, held senior securities issued by credit card securitization trusts were valued using quoted market prices and substantially all were classified as AFS debt securities and there were no other-than-temporary impairment losses recorded on those securities. |
| (3) | At December 31, 2009, the $6.6 billion Class D security was carried at amortized cost and classified as HTM debt securities and $1.4 billion of other held subordinated securities were valued using quoted market prices and were classified as AFS debt securities. At December 31, 2008, all of the held subordinated securities were valued using quoted market prices and classified as AFS debt securities. |
| (4) | Other subordinated and residual interests include discount receivables, subordinated interests in accrued interest and fees on the securitized receivables, and cash reserve accounts and interest-only strips which are carried at fair value or amounts that approximate fair value. The residual interests were valued using model valuations. Residual interests associated with the Class D and discount receivables transactions have not been recognized. |
Economic assumptions are used in measuring the fair value of certain residual interests that continue to be held by the Corporation. The expected loss rate assumption used to measure the discount receivables at December 31, 2009 was 13 percent. A 10 percent and 20 percent adverse change to the expected loss rate would have caused a decrease of $280 million and $1.2 billion to the fair value of the discount receivables at December 31, 2009. The discount rate assumption used to measure the Class D security at December 31, 2009 was six percent. A 100 bps and 200 bps increase in the discount rate would have caused a decrease of $116 million and $228 million to the fair value of the Class D security. Conversely, a 100 bps and 200 bps decrease in the discount rate would have caused an increase of $120 million and $245 million to the fair value of the Class D security. These sensitivities are hypothetical and should be used with caution. As the amounts indicate, changes in fair value based on variations in assumptions generally cannot be extrapolated because the relationship of the change in assumption to the change in fair value may not be linear.
At December 31, 2009 and 2008, there were no recognized servicing assets or liabilities associated with any of the credit card securitization transactions. The Corporation recorded $2.0 billion and $2.1 billion in servicing fees related to credit card securitizations during 2009 and 2008.
During 2008, the Corporation became one of the liquidity support providers for the Corporation's commercial paper program that obtains financing by issuing tranches of commercial paper backed by credit card receivables to third-party investors from a trust sponsored by the Corporation. During 2009, the Corporation became the sole liquidity support provider for the program and increased its liquidity commitment from $946 million to $2.3 billion. The maximum amount of commercial paper that can be issued under this program given the current level of liquidity support is $8.8 billion, all of which was outstanding at December 31, 2009 and 2008. If certain conditions set forth in the legal documents governing the trust are not met, such as not being able to reissue the commercial paper due to market illiquidity, the commercial paper maturity dates will be extended to 390 days from the original issuance date. This
extension would cause the outstanding commercial paper to convert to an interest-bearing note and subsequent credit card receivable collections would be applied to the outstanding note balance. If these notes are still outstanding at the end of the extended maturity period, the liquidity commitment obligates the Corporation and other liquidity support providers, if any, to purchase maturity notes from the trust in order to retire the interest-bearing notes held by investors. As a maturity note holder, the Corporation would be entitled to the remaining cash flows from the collateralizing credit card receivables. At December 31, 2009 and 2008, none of the commercial paper had been extended and there were no maturity notes outstanding. Due to illiquidity in the marketplace, the Corporation held $7.1 billion and $5.0 billion of the outstanding commercial paper as of December 31, 2009 and 2008, which is classified in AFS debt securities on the Corporation's Consolidated Balance Sheet.
Other Securitizations
The Corporation also maintains interests in other securitization trusts to which the Corporation transferred assets including municipal bonds, automobile loans and home equity loans. These retained interests include senior and subordinated securities and residual interests. During 2009, the Corporation had cash proceeds from new securitizations of municipal bonds of $664 million as well as cash flows received on residual interests of $316 million. At December 31, 2009, the principal balance outstanding for municipal bonds securitization trusts was $6.9 billion, senior securities held were $122 million and residual interests held were $203 million. The residual interests were valued using model valuations and substantially all are classified as derivative assets. At December 31, 2009, all of the held senior securities issued by municipal bond securitization trusts were valued using quoted market prices and classified as trading account assets.
During 2009, the Corporation securitized $9.0 billion of automobile loans in a transaction that was structured as a secured borrowing under applicable accounting guidance and the loans are therefore recorded on the Corporation's Consolidated Balance Sheet and excluded from the following table.
| Bank of America 2009 | 145 |
There were no new securitizations of home equity loans during 2009 and 2008. The following table summarizes selected information related to home equity and automobile loan securitizations at and for the year ended December 31, 2009 and 2008.
| Home Equity | Automobile | ||||||||||||
| (Dollars in millions) | 2009 | 2008 | 2009 | 2008 | |||||||||
For the Year Ended December 31 | |||||||||||||
Cash proceeds from new securitizations | $ | – | $ | – | $ | – | $ | 741 | |||||
Losses on securitizations (1) | – | – | – | (31 | ) | ||||||||
Collections reinvested in revolving period securitizations | 177 | 235 | – | – | |||||||||
Repurchases of loans from trust (2) | 268 | 128 | 298 | 184 | |||||||||
Cash flows received on residual interests | 35 | 27 | 52 | – | |||||||||
At December 31 | |||||||||||||
Principal balance outstanding | 46,282 | 34,169 | 2,656 | 5,385 | |||||||||
Senior securities held (3, 4) | 15 | – | 2,119 | 4,102 | |||||||||
Subordinated securities held (5) | 48 | 3 | 195 | 383 | |||||||||
Residual interests held (6) | 100 | 93 | 83 | 84 | |||||||||
| (1) | Net of hedges |
| (2) | Repurchases of loans from the trust for home equity loans are typically a result of the Corporation's representations and warranties, modifications or the exercise of an optional clean-up call. In addition, during 2009 and 2008, the Corporation paid $141 million and $34 million to indemnify the investor or insurer under the representations and warranties, and corporate guarantees. For further information regarding representations and warranties, and corporate guarantees, see the First Lien Mortgage-related Securitizations discussion. Repurchases of automobile loans during 2009 and 2008 were due to the exercise of an optional clean-up call. |
| (3) | As a holder of these securities, the Corporation receives scheduled interest and principal payments. During 2009, there were no other-than-temporary impairment losses recorded on those securities classified as AFS debt securities. |
| (4) | At December 31, 2009, all of the held senior securities issued by the home equity securitization trusts were valued using quoted market prices and classified as trading account assets. At December 31, 2009 and 2008, substantially all of the held senior securities issued by the automobile securitization trusts were valued using quoted market prices and classified as AFS debt securities. |
| (5) | At December 31, 2009 and 2008, substantially all of the held subordinated securities issued by the home equity securitization trusts were valued using model valuations and classified as AFS debt securities. At December 31, 2009 and 2008, substantially all of the held subordinated securities issued by the automobile securitization trusts were valued using quoted market prices and classified as AFS debt securities. |
| (6) | Residual interests include the residual asset, overcollateralization and cash reserve accounts, which are carried at fair value or amounts that approximate fair value. The residual interests were derived using model valuations and substantially all are classified in other assets. |
Under the terms of the Corporation's home equity securitizations, advances are made to borrowers when they draw on their lines of credit and the Corporation is reimbursed for those advances from the cash flows in the securitization. During the revolving period of the securitization, this reimbursement normally occurs within a short period after the advance. However, when the securitization transaction has begun a rapid amortization period, reimbursement of the Corporation's advance occurs only after other parties in the securitization have received all of the cash flows to which they are entitled. This has the effect of extending the time period for which the Corporation's advances are outstanding. In particular, if loan losses requiring draws on monoline insurers' policies, which protect the bondholders in the securitization, exceed a specified threshold or duration, the Corporation may not receive reimbursement for all of the funds advanced to borrowers, as the senior bondholders and the monoline insurers have priority for repayment.
The Corporation evaluates all of its home equity securitizations for their potential to experience a rapid amortization event by estimating the amount and timing of future losses on the underlying loans, the excess spread available to cover such losses and by evaluating any estimated shortfalls in relation to contractually defined triggers. A maximum funding obligation attributable to rapid amortization cannot be calculated as a home equity borrower has the ability to pay down and redraw balances. At December 31, 2009 and 2008, home equity securitization transactions in rapid amortization had $14.1 billion and $13.1 billion of trust certificates outstanding. This amount is significantly greater than the amount the Corporation expects to fund. At December 31, 2009, an additional $1.1 billion of trust certificates outstanding pertain to home equity securitization transactions that are expected to enter rapid amortization during the next 24 months. The charges that will ultimately be recorded as a result of the rapid amortization events are dependent on the performance of the loans, the amount of subsequent draws, and the timing of related cash flows. At December 31, 2009 and 2008, the reserve for losses on expected future draw obligations on the home equity securitizations in or expected to be in rapid amortization was $178 million and $345 million.
The Corporation has consumer MSRs from the sale or securitization of home equity loans. The Corporation recorded $128 million and $78 million of servicing fee income related to home equity securitizations during 2009 and 2008. For more information on MSRs, see Note 22 – Mortgage Servicing Rights . At December 31, 2009 and 2008, there were no recognized servicing assets or liabilities associated with any of the automobile securitization transactions. The Corporation recorded $43 million and $30 million in servicing fees related to automobile securitizations during 2009 and 2008.
The Corporation provides financing to certain entities under asset-backed financing arrangements. These entities are controlled and consolidated by third parties. At December 31, 2009, the principal balance outstanding for these asset-backed financing arrangements was $10.4 billion, the maximum loss exposure was $6.8 billion, and on-balance sheet assets were $6.7 billion which are primarily recorded in loans and leases. The total cash flows for 2009 were $491 million and are primarily related to principal and interest payments received.
NOTE 9 – Variable Interest Entities
The Corporation utilizes SPEs in the ordinary course of business to support its own and its customers' financing and investing needs. These SPEs are typically structured as VIEs and are thus subject to consolidation by the reporting enterprise that absorbs the majority of the economic risks and rewards of the VIE. To determine whether it must consolidate a VIE, the Corporation qualitatively analyzes the design of the VIE to identify the creators of variability within the VIE, including an assessment as to the nature of the risks that are created by the assets and other contractual arrangements of the VIE, and identifies whether it will absorb a majority of that variability.
In addition, the Corporation uses VIEs such as trust preferred securities trusts in connection with its funding activities, as described in more detail in Note 13 – Long-term Debt . The Corporation also uses VIEs in the form of synthetic securitization vehicles to mitigate a portion of the credit risk on its residential mortgage loan portfolio as described in
| 146 | Bank of America 2009 |
Note 6 – Outstanding Loans and Leases. The Corporation has also provided support to or has loss exposure resulting from its involvement with other VIEs, including certain cash funds managed within GWIM, as described in more detail in Note 14 – Commitments and Contingencies. These VIEs are not included in the tables below.
The table below presents the assets and liabilities of VIEs that are consolidated on the Corporation's Consolidated Balance Sheet at December 31, 2009, total assets of consolidated VIEs at December 31, 2008, and the Corporation's maximum exposure to loss resulting from its
involvement with consolidated VIEs as of December 31, 2009 and 2008. The Corporation's maximum exposure to loss is based on the unlikely event that all of the assets in the VIEs become worthless and incorporates not only potential losses associated with assets recorded on the Corporation's Consolidated Balance Sheet but also potential losses associated with off-balance sheet commitments such as unfunded liquidity commitments and other contractual arrangements. The Corporation's maximum exposure to loss does not include losses previously recognized through write-downs of assets.
Consolidated VIEs
| (Dollars in millions) | Multi-Seller Conduits | Loan and Other Investment | CDOs | Leveraged Lease Trusts | Other Vehicles | Total | ||||||||||||
Consolidated VIEs, December 31, 2009 | ||||||||||||||||||
Maximum loss exposure | $ | 9,388 | $ | 8,265 | $ | 3,863 | $ | 5,634 | $ | 1,463 | $ | 28,613 | ||||||
Consolidated Assets (1) | ||||||||||||||||||
Trading account assets | $ | – | $ | 145 | $ | 2,785 | $ | – | $ | 548 | $ | 3,478 | ||||||
Derivative assets | – | 579 | – | – | 830 | 1,409 | ||||||||||||
Available-for-sale debt securities | 3,492 | 1,799 | 1,414 | – | 23 | 6,728 | ||||||||||||
Held-to-maturity debt securities | 2,899 | – | – | – | – | 2,899 | ||||||||||||
Loans and leases | 318 | 11,752 | – | 5,650 | – | 17,720 | ||||||||||||
All other assets | 4 | 3,087 | – | – | 184 | 3,275 | ||||||||||||
Total | $ | 6,713 | $ | 17,362 | $ | 4,199 | $ | 5,650 | $ | 1,585 | $ | 35,509 | ||||||
Consolidated Liabilities (1) | ||||||||||||||||||
Commercial paper and other short-term borrowings | $ | 6,748 | $ | – | $ | – | $ | – | $ | 987 | $ | 7,735 | ||||||
All other liabilities | – | 12,127 | 2,753 | 17 | 163 | 15,060 | ||||||||||||
Total | $ | 6,748 | $ | 12,127 | $ | 2,753 | $ | 17 | $ | 1,150 | $ | 22,795 | ||||||
Consolidated VIEs, December 31, 2008 | ||||||||||||||||||
Maximum loss exposure | $ | 11,304 | $ | 3,189 | $ | 2,443 | $ | 5,774 | $ | 1,497 | $ | 24,207 | ||||||
Total assets of VIEs (1) | 9,368 | 4,449 | 2,443 | 5,829 | 1,631 | 23,720 | ||||||||||||
| (1) | Total assets and liabilities of consolidated VIEs are reported net of intercompany balances that have been eliminated in consolidation. |
At December 31, 2009, the Corporation's total maximum loss exposure to consolidated VIEs was $28.6 billion, which includes $5.9 billion attributable to the addition of Merrill Lynch, primarily loan and other investment vehicles and CDOs.
The table below presents total assets of unconsolidated VIEs in which the Corporation holds a significant variable interest and Corporation-sponsored unconsolidated VIEs in which the Corporation holds a variable interest, even if not significant, at December 31, 2009 and 2008. The table also presents the Corporation's maximum exposure to loss resulting from its involvement with these VIEs at December 31, 2009 and 2008. The Corporation's maximum exposure to loss is based on the unlikely event that all of the assets in the VIEs become worthless and
incorporates not only potential losses associated with assets recorded on the Corporation's Consolidated Balance Sheet but also potential losses associated with off-balance sheet commitments such as unfunded liquidity commitments and other contractual arrangements. The Corporation's maximum exposure to loss does not include losses previously recognized through write-downs of assets. Certain QSPEs, principally municipal bond trusts, in which the Corporation has continuing involvement are discussed in Note 8 – Securitizations and are also included in the table. Assets and liabilities of unconsolidated VIEs recorded on the Corporation's Consolidated Balance Sheet at December 31, 2009 are also summarized below.
Unconsolidated VIEs
| (Dollars in millions) | Multi- Seller Conduits | Loan and Investment | Real Estate Investment Vehicles | Municipal Bond Trusts | CDOs | Customer Vehicles | Other Vehicles | Total | ||||||||||||||||
Unconsolidated VIEs, December 31, 2009 | ||||||||||||||||||||||||
Maximum loss exposure | $ | 25,135 | $ | 5,571 | $ | 4,812 | $ | 10,143 | $ | 6,987 | $ | 9,904 | $ | 1,232 | $ | 63,784 | ||||||||
Total assets of VIEs | 13,893 | 11,507 | 4,812 | 12,247 | 56,590 | 13,755 | 1,232 | 114,036 | ||||||||||||||||
On-balance sheet assets | ||||||||||||||||||||||||
Trading account assets | $ | - | $ | 216 | $ | - | $ | 191 | $ | 1,253 | $ | 1,118 | $ | - | $ | 2,778 | ||||||||
Derivative assets | - | 128 | - | 167 | 2,085 | 4,708 | 62 | 7,150 | ||||||||||||||||
Available-for-sale debt securities | - | - | - | - | 368 | - | - | 368 | ||||||||||||||||
Loans and leases | 318 | 933 | - | - | - | - | - | 1,251 | ||||||||||||||||
All other assets | 60 | 4,287 | 4,812 | - | 166 | - | - | 9,325 | ||||||||||||||||
Total | $ | 378 | $ | 5,564 | $ | 4,812 | $ | 358 | $ | 3,872 | $ | 5,826 | $ | 62 | $ | 20,872 | ||||||||
On-balance sheet liabilities | ||||||||||||||||||||||||
Derivative liabilities | $ | - | $ | 139 | $ | - | $ | 287 | $ | 781 | $ | 154 | $ | 54 | $ | 1,415 | ||||||||
All other liabilities | - | 581 | 1,460 | - | - | 856 | - | 2,897 | ||||||||||||||||
Total | $ | - | $ | 720 | $ | 1,460 | $ | 287 | $ | 781 | $ | 1,010 | $ | 54 | $ | 4,312 | ||||||||
Unconsolidated VIEs, December 31, 2008 | ||||||||||||||||||||||||
Maximum loss exposure | $ | 42,046 | $ | 2,789 | $ | 5,696 | $ | 7,145 | $ | 2,383 | $ | 5,741 | $ | 4,170 | $ | 69,970 | ||||||||
Total assets of VIEs | 27,922 | 5,691 | 5,980 | 7,997 | 2,570 | 6,032 | 4,211 | 60,403 | ||||||||||||||||
| Bank of America 2009 | 147 |
At December 31, 2009, the Corporation's total maximum loss exposure to unconsolidated VIEs was $63.8 billion, which includes $19.7 billion attributable to the addition of Merrill Lynch, primarily customer vehicles, municipal bond trusts and CDOs.
Except as described below, the Corporation has not provided financial or other support to consolidated or unconsolidated VIEs that it was not previously contractually required to provide, nor does it intend to do so.
Multi-seller Conduits
The Corporation administers four multi-seller conduits which provide a low-cost funding alternative to its customers by facilitating their access to the commercial paper market. These customers sell or otherwise transfer assets to the conduits, which in turn issue short-term commercial paper that is rated high-grade and is collateralized by the underlying assets. The Corporation receives fees for providing combinations of liquidity and SBLCs or similar loss protection commitments to the conduits. The Corporation also receives fees for serving as commercial paper placement agent and for providing administrative services to the conduits. The Corporation's liquidity commitments are collateralized by various classes of assets and incorporate features such as overcollateralization and cash reserves that are designed to provide credit support to the conduits at a level equivalent to investment grade as determined in accordance with internal risk rating guidelines. Third parties participate in a small number of the liquidity facilities on a pari passu basis with the Corporation.
The Corporation determines whether it must consolidate a multi-seller conduit based on an analysis of projected cash flows using Monte Carlo simulations which are driven principally by credit risk inherent in the assets of the conduits. Interest rate risk is not included in the cash flow analysis because the conduits are not designed to absorb and pass along interest rate risk to investors. Instead, the assets of the conduits pay variable rates of interest based on the conduits' funding costs. The assets of the conduits typically carry a risk rating of AAA to BBB based on the Corporation's current internal risk rating equivalent which reflects structural enhancements of the assets including third party insurance. Projected loss calculations are based on maximum binding commitment amounts, probability of default based on the average one-year Moody's Corporate Finance transition table, and recovery rates of 90 percent, 65 percent and 45 percent for senior, mezzanine and subordinate exposures. Approximately 98 percent of commitments in the unconsolidated conduits and 69 percent of commitments in the consolidated conduit are supported by senior exposures. Certain assets funded by one of the unconsolidated conduits benefit from embedded credit enhancement provided by the Corporation. Credit risk created by these assets is deemed to be credit risk of the Corporation which is absorbed by third party investors.
The Corporation does not consolidate three conduits as it does not expect to absorb a majority of the variability created by the credit risk of the assets held in the conduits. On a combined basis, these three conduits have issued approximately $147 million of capital notes and equity interests to third parties, $142 million of which was outstanding at December 31, 2009. These instruments will absorb credit risk on a first loss basis. The Corporation consolidates the fourth conduit which has not issued capital notes or equity interests to third parties.
At December 31, 2009, the assets of the consolidated conduit, which consist primarily of debt securities, and the conduit's unfunded liquidity commitments were mainly collateralized by $2.2 billion in credit card loans (25 percent), $1.1 billion in student loans (12 percent), $1.0 billion in auto loans (11 percent), $680 million in trade receivables (eight percent) and $377 million in equipment loans (four percent). In addition, $3.0 billion of the Corporation's liquidity commitments were collateralized by projected cash flows from long-term contracts (e.g., television broad -
cast contracts, stadium revenues and royalty payments) which, as mentioned above, incorporate features that provide credit support. Amounts advanced under these arrangements will be repaid when cash flows due under the long-term contracts are received. Approximately 74 percent of this exposure is insured. At December 31, 2009, the weighted-average life of assets in the consolidated conduit was estimated to be 3.4 years and the weighted-average maturity of commercial paper issued by this conduit was 33 days. Assets of the Corporation are not available to pay creditors of the consolidated conduit except to the extent the Corporation may be obligated to perform under the liquidity commitments and SBLCs. Assets of the consolidated conduit are not available to pay creditors of the Corporation.
The Corporation's liquidity commitments to the unconsolidated conduits, all of which were unfunded at December 31, 2009, pertained to facilities that were mainly collateralized by $4.4 billion in trade receivables (18 percent), $3.9 billion in auto loans (16 percent), $3.5 billion in credit card loans (15 percent), $2.6 billion in student loans (11 percent), and $2.0 billion in equipment loans (eight percent). In addition, $5.6 billion (24 percent) of the Corporation's commitments were collateralized by the conduits' short-term lending arrangements with investment funds, primarily real estate funds, which, as mentioned above, incorporate features that provide credit support. Amounts advanced under these arrangements are secured by a diverse group of high quality equity investors. Outstanding advances under these facilities will be repaid when the investment funds issue capital calls. At December 31, 2009, the weighted-average life of assets in the unconsolidated conduits was estimated to be 2.4 years and the weighted-average maturity of commercial paper issued by these conduits was 37 days. At December 31, 2009 and 2008, the Corporation did not hold any commercial paper issued by the multi-seller conduits other than incidentally and in its role as a commercial paper dealer.
The Corporation's liquidity, SBLCs and similar loss protection commitments obligate it to purchase assets from the conduits at the conduits' cost. Subsequent realized losses on assets purchased from the unconsolidated conduits would be reimbursed from restricted cash accounts that were funded by the issuance of capital notes and equity interests to third party investors. The Corporation would absorb losses in excess of such amounts. If a conduit is unable to re-issue commercial paper due to illiquidity in the commercial paper markets or deterioration in the asset portfolio, the Corporation is obligated to provide funding subject to the following limitations. The Corporation's obligation to purchase assets under the SBLCs and similar loss protection commitments is subject to a maximum commitment amount which is typically set at eight to 10 percent of total outstanding commercial paper. The Corporation's obligation to purchase assets under the liquidity agreements, which comprise the remainder of its exposure, is generally limited to the amount of non-defaulted assets. Although the SBLCs are unconditional, the Corporation is not obligated to fund under other liquidity or loss protection commitments if the conduit is the subject of a voluntary or involuntary bankruptcy proceeding.
One of the unconsolidated conduits holds CDO investments with aggregate outstanding funded amounts of $318 million and $388 million and unfunded commitments of $225 million and $162 million at December 31, 2009 and December 31, 2008. At December 31, 2009, $190 million of the conduit's total exposure pertained to an insured CDO which holds middle market loans. The underlying collateral of the remaining CDO investments includes $33 million of subprime mortgages and other investment grade securities. All of the unfunded commitments are revolving commitments to the insured CDO. During 2009 and 2008, these investments were downgraded or threatened with a downgrade by the ratings agencies. In accordance with the terms of the Corporation's
| 148 | Bank of America 2009 |
existing liquidity obligations, the conduit had transferred the funded investments to the Corporation in a transaction that was accounted for as a financing transaction due to the conduit's continuing exposure to credit losses of the investments. As a result of the transfer, the CDO investments no longer serve as collateral for commercial paper issuances.
The transfers were performed in accordance with existing contractual requirements. The Corporation did not provide support to the conduit that was not contractually required nor does it intend to provide support in the future that is not contractually required. The Corporation performs reconsideration analyses for the conduit at least quarterly, and the CDO investments are included in these analyses. The Corporation will be reimbursed for any realized credit losses on these CDO investments up to the amount of capital notes issued by the conduit which totaled $116 million at December 31, 2009 and $66 million at December 31, 2008. Any realized losses on the CDO investments that are caused by market illiquidity or changes in market rates of interest will be borne by the Corporation. The Corporation will also bear any credit-related losses in excess of the amount of capital notes issued by the conduit. The Corporation's maximum exposure to loss from the CDO investments was $428 million at December 31, 2009 and $484 million at December 31, 2008, based on the combined funded amounts and unfunded commitments less the amount of cash proceeds from the issuance of capital notes which are held in a segregated account.
There were no other significant downgrades or losses recorded in earnings from write-downs of assets held by any of the conduits during 2009.
The liquidity commitments and SBLCs provided to unconsolidated conduits are included in Note 14 – Commitments and Contingencies.
Loan and Other Investment Vehicles
Loan and other investment vehicles at December 31, 2009 and 2008 include loan securitization trusts that did not meet the requirements to be QSPEs, loan financing arrangements, and vehicles that invest in financial assets, typically debt securities or loans. The Corporation determines whether it is the primary beneficiary of and must consolidate these investment vehicles based principally on a determination as to which party is expected to absorb a majority of the credit risk or market risk created by the assets of the vehicle. Typically, the party holding subordinated or residual interests in a vehicle will absorb a majority of the risk.
Certain loan securitization trusts were designed to meet QSPE requirements but fail to do so, typically as a result of derivatives entered into by the trusts that pertain to interests ultimately retained by the Corporation due to its inability to sell such interests as a result of illiquidity in the market. The assets have been pledged to the investors in the trusts. The Corporation consolidates these loan securitization trusts if it retains the residual interest in the trust and expects to absorb a majority of the variability in cash flows created by the loans held in the trust. Investors in consolidated loan securitization trusts have no recourse to the general credit of the Corporation as their investments are repaid solely from the assets of the vehicle.
The Corporation uses financing arrangements with SPEs administered by third parties to obtain low-cost funding for certain financial assets, principally commercial loans and debt securities. The third party SPEs, typically commercial paper conduits, hold the specified assets subject to total return swaps with the Corporation. If the assets are transferred to the third party from the Corporation, the transfer is accounted for as a secured borrowing. If the third party commercial paper conduit issues a discrete series of commercial paper whose only source of repayment is the specified asset and the total return swap with the Corporation, thus creating a "silo" structure within the conduit, the Corporation consolidates that silo.
The Corporation has made investments in alternative investment funds that are considered to be VIEs because they do not have sufficient legal form equity at risk to finance their activities or the holders of the equity at risk do not have control over the activities of the vehicles. The Corporation consolidates these funds if it holds a majority of the investment in the fund. The Corporation also sponsors funds that provide a guaranteed return to investors at the maturity of the fund. This guarantee may include a guarantee of the return of an initial investment or the initial investment plus an agreed upon return depending on the terms of the fund. Investors in certain of these funds have recourse to the Corporation to the extent that the value of the assets held by the funds at maturity is less than the guaranteed amount. The Corporation consolidates these funds if the Corporation's guarantee is expected to absorb a majority of the variability created by the assets of the fund.
Real Estate Investment Vehicles
The Corporation's investment in real estate investment vehicles at December 31, 2009 and 2008 consisted principally of limited partnership investments in unconsolidated limited partnerships that finance the construction and rehabilitation of affordable rental housing. The Corporation earns a return primarily through the receipt of tax credits allocated to the affordable housing projects.
The Corporation determines whether it must consolidate these limited partnerships based on a determination as to which party is expected to absorb a majority of the risk created by the real estate held in the vehicle, which may include construction, market and operating risk. Typically, the general partner in a limited partnership will absorb a majority of this risk due to the legal nature of the limited partnership structure and accordingly will consolidate the vehicle. The Corporation's risk of loss is mitigated by policies requiring that the project qualify for the expected tax credits prior to making its investment. The Corporation may from time to time be asked to invest additional amounts to support a troubled project. Such additional investments have not been and are not expected to be significant.
Municipal Bond Trusts
The Corporation administers municipal bond trusts that hold highly-rated, long-term, fixed-rate municipal bonds, some of which are callable prior to maturity. The vast majority of the bonds are rated AAA or AA and some of the bonds benefit from insurance provided by monolines. The trusts obtain financing by issuing floating-rate trust certificates that reprice on a weekly or other basis to third party investors. The Corporation may serve as remarketing agent and/or liquidity provider for the trusts. The floating-rate investors have the right to tender the certificates at specified dates, often with as little as seven days' notice. Should the Corporation be unable to remarket the tendered certificates, it is generally obligated to purchase them at par under standby liquidity facilities. The Corporation is not obligated to purchase the certificates under the standby liquidity facilities if a bond's credit rating declines below investment grade or in the event of certain defaults or bankruptcy of the issuer and insurer. The weighted-average remaining life of bonds held in the trusts at December 31, 2009 was 13.6 years. There were no material write-downs or downgrades of assets or issuers during 2009.
In addition to standby liquidity facilities, the Corporation also provides default protection or credit enhancement to investors in securities issued by certain municipal bond trusts. Interest and principal payments on floating-rate certificates issued by these trusts are secured by an unconditional guarantee issued by the Corporation. In the event that the issuer of the underlying municipal bond defaults on any payment of principal and/or interest when due, the Corporation will make any required payments to the holders of the floating-rate certificates.
| Bank of America 2009 | 149 |
Some of these trusts are QSPEs and, as such, are not subject to consolidation by the Corporation. The Corporation consolidates those trusts that are not QSPEs if it holds the residual interests or otherwise expects to absorb a majority of the variability created by changes in market value of assets in the trusts and changes in market rates of interest. The Corporation does not consolidate a trust if the customer holds the residual interest and the Corporation is protected from loss in connection with its liquidity obligations. For example, the Corporation may have the ability to trigger the liquidation of a trust that is not a QSPE if the market value of the bonds held in the trust declines below a specified threshold which is designed to limit market losses to an amount that is less than the customer's residual interest, effectively preventing the Corporation from absorbing the losses incurred on the assets held within the trust.
The Corporation's liquidity commitments to unconsolidated trusts totaled $9.8 billion and $6.8 billion at December 31, 2009 and 2008. The increase is due principally to the addition of unconsolidated trusts acquired through the Merrill Lynch acquisition. At December 31, 2009 and 2008, the Corporation held $155 million and $688 million of floating-rate certificates issued by the municipal bond trusts in trading account assets.
Collateralized Debt Obligation Vehicles
CDO vehicles hold diversified pools of fixed income securities, typically corporate debt or asset-backed securities, which they fund by issuing multiple tranches of debt and equity securities. Synthetic CDOs enter into a portfolio of credit default swaps to synthetically create exposure to fixed income securities. Collateralized loan obligations (CLOs) are a subset of CDOs which hold pools of loans, typically corporate loans or commercial mortgages. CDOs are typically managed by third party portfolio managers. The Corporation transfers assets to these CDOs, holds securities issued by the CDOs, and may be a derivative counterparty to the CDOs, including credit default swap counterparty for synthetic CDOs. The Corporation receives fees for structuring CDOs and providing liquidity support for super senior tranches of securities issued by certain CDOs. The Corporation has also entered into total return swaps with certain CDOs whereby the Corporation will absorb the economic returns generated by specified assets held by the CDO. No third parties provide a significant amount of similar commitments to these CDOs.
The Corporation evaluates whether it must consolidate a CDO based principally on a determination as to which party is expected to absorb a majority of the credit risk created by the assets of the CDO. The Corporation does not typically retain a significant portion of debt securities issued by a CDO. When the Corporation structured certain CDOs, it acquired the super senior tranches, which are the most senior class of securities issued by the CDOs and benefit from the subordination of all other securities issued by the vehicle, or provided commitments to support the issuance of super senior commercial paper to third parties. When the CDOs were first created, the Corporation did not expect its investments or its liquidity commitments to absorb a significant amount of the variability driven by the credit risk within the CDOs and did not consolidate the CDOs. When the Corporation subsequently acquired commercial paper or term securities issued by certain CDOs during 2009 and 2008, principally as a result of its liquidity obligations, updated consolidation analyses were performed. Due to credit deterioration in the pools of securities held by the CDOs, the updated analyses indicated that the Corporation would now be expected to absorb a majority of the variability, and accordingly, these CDOs were consolidated. Consolidation did not have a significant impact on the Corporation's results of operations, as the Corporation's investments and liquidity obligations were recorded at fair value prior to consolidation. The creditors of the consolidated CDOs have no recourse to the general credit of the Corporation.
The December 31, 2009 CDO balances include a portfolio of liquidity exposures obtained in connection with the Merrill Lynch acquisition,
including $1.9 billion notional amount of liquidity support provided to certain synthetic CDOs in the form of unfunded lending commitments related to super senior securities. The lending commitments obligate the Corporation to purchase the super senior CDO securities at par value if the CDOs need cash to make payments due under credit default swaps held by the CDOs. This portfolio also includes an additional $1.3 billion notional amount of liquidity exposure to non-SPE third parties that hold super senior cash positions on the Corporation's behalf. The Corporation's net exposure to loss on these positions, after write-downs and insurance, was $88 million at December 31, 2009.
Liquidity-related commitments also include $1.4 billion notional amount of derivative contracts with unconsolidated SPEs, principally CDO vehicles, which hold non-super senior CDO debt securities or other debt securities on the Corporation's behalf. These derivatives are typically in the form of total return swaps which obligate the Corporation to purchase the securities at the SPE's cost to acquire the securities, generally as a result of ratings downgrades. The underlying securities are senior securities and substantially all of the Corporation's exposures are insured. Accordingly, the Corporation's exposure to loss consists principally of counterparty risk to the insurers. These derivatives are included in the $2.8 billion notional amount of derivative contracts through which the Corporation obtains funding from third party SPEs, discussed in Note 14 – Commitments and Contingencies .
The $4.6 billion of liquidity exposure described above is included in the Unconsolidated VIEs table to the extent that the Corporation's involvement with the CDO vehicle meets the requirements for disclosure. For example, if the Corporation did not sponsor a CDO vehicle and does not hold a significant variable interest, the vehicle is not included in the table.
Including such liquidity commitments, the portfolio of CDO investments obtained in connection with the Merrill Lynch acquisition and included in the Unconsolidated VIEs table pertains to CDO vehicles with total assets of $55.6 billion. The Corporation's maximum exposure to loss with regard to these positions is $6.0 billion. This amount is significantly less than the total assets of the CDO vehicles because the Corporation typically has exposure to only a portion of the total assets. The Corporation has also purchased credit protection from some of the same CDO vehicles in which it invested, thus reducing net exposure to future loss.
At December 31, 2008, liquidity commitments provided to CDOs included written put options with a notional amount of $542 million. All of these written put options were terminated in the first quarter of 2009.
Leveraged Lease Trusts
The Corporation's net involvement with consolidated leveraged lease trusts totaled $5.6 billion and $5.8 billion at December 31, 2009 and 2008. The trusts hold long-lived equipment such as rail cars, power generation and distribution equipment, and commercial aircraft. The Corporation consolidates these trusts because it holds a residual interest which is expected to absorb a majority of the variability driven by credit risk of the lessee and, in some cases, by the residual risk of the leased property. The net investment represents the Corporation's maximum loss exposure to the trusts in the unlikely event that the leveraged lease investments become worthless. Debt issued by the leveraged lease trusts is nonrecourse to the Corporation. The Corporation has no liquidity exposure to these leveraged lease trusts.
Customer Vehicles
Customer vehicles include credit-linked and equity-linked note vehicles, repackaging vehicles, and asset acquisition vehicles, which are typically created on behalf of customers who wish to obtain market or credit exposure to a specific company or financial instrument.
| 150 | Bank of America 2009 |
Credit-linked and equity-linked note vehicles issue notes which pay a return that is linked to the credit or equity risk of a specified company or debt instrument. The vehicles purchase high-grade assets as collateral and enter into credit default swaps or equity derivatives to synthetically create the credit or equity risk to pay the specified return on the notes. The Corporation is typically the counterparty for some or all of the credit and equity derivatives and, to a lesser extent, it may invest in securities issued by the vehicles. The Corporation may also enter into interest rate or foreign currency derivatives with the vehicles. The Corporation does not typically consolidate the vehicles because the derivatives create variability which is absorbed by the third party investors. The Corporation is exposed to loss if the collateral held by the vehicle declines in value and is insufficient to cover the vehicle's obligation to the Corporation under the above-referenced derivatives. In addition, the Corporation has entered into derivative contracts, typically total return swaps, with certain vehicles which obligate the Corporation to purchase securities held as collateral at the vehicle's cost, typically as a result of ratings downgrades. These exposures were obtained in connection with the Merrill Lynch acquisition. The underlying securities are senior securities and substantially all of the Corporation's exposures are insured. Accordingly, the Corporation's exposure to loss consists principally of counterparty risk to the insurers. The Corporation consolidates these vehicles if the variability in cash flows expected to be generated by the collateral is greater than the variability in cash flows expected to be generated by the credit or equity derivatives. At December 31, 2009, the notional amount of such derivative contracts with unconsolidated vehicles was $1.4 billion. This amount is included in the $2.8 billion notional amount of derivative contracts through which the Corporation obtains funding from unconsolidated SPEs, described in Note 14 – Commitments and Contingencies . The Corporation also has approximately $628 million of other liquidity commitments, including written put options and collateral value guarantees, with credit-linked and equity-linked vehicles at December 31, 2009.
Repackaging vehicles are created to provide an investor with a specific risk profile. The vehicles typically hold a security and a derivative that modify the interest rate or currency of that security, and issues one class of notes to a single investor. These vehicles are generally QSPEs and as such are not subject to consolidation by the Corporation.
Asset acquisition vehicles acquire financial instruments, typically loans, at the direction of a single customer and obtain funding through the issuance of structured notes to the Corporation. At the time the vehicle acquires an asset, the Corporation enters into a total return swap with the customer such that the economic returns of the asset are passed through to the customer. As a result, the Corporation does not consolidate the vehicles. The Corporation is exposed to counterparty credit risk if the asset declines in value and the customer defaults on its obligation to the Corporation under the total return swap. The Corporation's risk may be mitigated by collateral or other arrangements.
Other Vehicles
Other consolidated vehicles primarily include asset acquisition conduits and real estate investment vehicles. Other unconsolidated vehicles include asset acquisition conduits and other corporate conduits.
The Corporation administers three asset acquisition conduits which acquire assets on behalf of the Corporation or its customers. Two of the conduits, which are unconsolidated, acquire assets at the request of customers who wish to benefit from the economic returns of the specified assets on a leveraged basis, which consist principally of liquid exchange- traded equity securities. The consolidated conduit holds subordinated debt securities for the Corporation's benefit. The conduits obtain funding by issuing commercial paper and subordinated certificates to third party investors. Repayment of the commercial paper and certificates is assured by total return swaps between the Corporation and the conduits and for unconsolidated conduits the Corporation is reimbursed through total return swaps with its customers. The weighted-average maturity of commercial paper issued by the conduits at December 31, 2009 was 68 days. The Corporation receives fees for serving as commercial paper placement agent and for providing administrative services to the conduits. At December 31, 2009 and 2008, the Corporation did not hold any commercial paper issued by the asset acquisition conduits other than incidentally and in its role as a commercial paper dealer.
The Corporation determines whether it must consolidate an asset acquisition conduit based on the design of the conduit and whether the third party investors are exposed to the Corporation's credit risk or the market risk of the assets. Interest rate risk is not included in the cash flow analysis because the conduits are not designed to absorb and pass along interest rate risk to investors who receive current rates of interest that are appropriate for the tenor and relative risk of their investments. When a conduit acquires assets for the benefit of the Corporation's customers, the Corporation enters into back-to-back total return swaps with the conduit and the customer such that the economic returns of the assets are passed through to the customer. The Corporation's performance under the derivatives is collateralized by the underlying assets and as such the third party investors are exposed primarily to the credit risk of the Corporation. The Corporation's exposure to the counterparty credit risk of its customers is mitigated by the aforementioned collateral arrangements and the ability to liquidate an asset held in the conduit if the customer defaults on its obligation. When a conduit acquires assets on the Corporation's behalf and the Corporation absorbs the market risk of the assets, it consolidates the conduit. Derivatives related to unconsolidated conduits are carried at fair value with changes in fair value recorded in trading account profits (losses).
Other corporate conduits at December 31, 2008 included several commercial paper conduits which held primarily high-grade, long-term municipal, corporate and mortage-backed securities. During the second quarter of 2009, the Corporation was unable to remarket the conduits' commercial paper and, in accordance with existing contractual arrangements, the conduits were liquidated. Due to illiquidity in the financial markets, the Corporation purchased a majority of these assets. At December 31, 2009, the Corporation held $207 million of assets acquired from the liquidation of other corporate conduits and previous mandatory sales of assets out of the conduits. These assets are recorded on the Consolidated Balance Sheet in trading account assets.
| Bank of America 2009 | 151 |
NOTE 10 – Goodwill and Intangible Assets
The following table presents goodwill at December 31, 2009 and 2008, which includes $5.1 billion of goodwill from the acquisition of Merrill Lynch and $4.4 billion of goodwill from the acquisition of Countrywide. As discussed in more detail in Note 23 – Business Segment Information , the
Corporation changed its basis of presentation from three segments to six segments effective January 1, 2009 in connection with the Merrill Lynch acquisition. The reporting units utilized for goodwill impairment tests are the business segments or one level below the business segments.
| December 31 | ||||||
| (Dollars in millions) | 2009 | 2008 | ||||
Deposits | $ | 17,875 | $ | 17,805 | ||
Global Card Services | 22,292 | 22,271 | ||||
Home Loans & Insurance | 4,797 | 4,797 | ||||
Global Banking | 27,550 | 28,409 | ||||
Global Markets | 3,358 | 2,080 | ||||
Global Wealth & Investment Management | 10,411 | 6,503 | ||||
All Other | 31 | 69 | ||||
Total goodwill | $ | 86,314 | $ | 81,934 | ||
No goodwill impairment was recognized for 2009 and 2008. For more information on goodwill impairment testing, see the Goodwill and Intangible Assets section of Note 1 – Summary of Significant Accounting Principles .
Based on the results of the annual impairment test at June 30, 2009, and due to continued stress on Home Loans & Insurance and Global Card Services as a result of current market conditions, the Corporation concluded that an additional impairment analysis should be performed for these two reporting units as of December 31, 2009. In performing the first step of the additional impairment analysis, the Corporation compared the fair value of each reporting unit to its carrying amount, including goodwill. Consistent with the annual test, the Corporation utilized a combination of the market approach and the income approach for Home Loans & Insurance and the income approach for Global Card Services . For Home Loans & Insurance the carrying value exceeded the fair value, and
accordingly, the second step analysis of comparing the implied fair value of the reporting unit's goodwill with the carrying amount of that goodwill was performed. Although Global Card Services passed step one of the goodwill impairment analysis, to further substantiate the value of the goodwill balance, the Corporation also performed the step two analysis for this reporting unit. The results of the second step of the goodwill impairment test, which were consistent with the results of the annual impairment test, indicated that no goodwill was impaired for 2009.
The following table presents the gross carrying values and accumulated amortization related to intangible assets at December 31, 2009 and 2008. Gross carrying amounts include $5.4 billion of intangible assets related to the Merrill Lynch acquisition consisting of $800 million of core deposit intangibles, $3.1 billion of customer relationships and $1.5 billion of non-amortizing other intangibles.
| December 31 | ||||||||||||||
| 2009 | 2008 | |||||||||||||
| (Dollars in millions) | Gross Carrying Value | Accumulated Amortization | Gross Carrying Value | Accumulated Amortization | ||||||||||
Purchased credit card relationships | $ | 7,179 | $ | 3,452 | $ | 7,080 | $ | 2,740 | ||||||
Core deposit intangibles | 5,394 | 3,722 | 4,594 | 3,284 | ||||||||||
Customer relationships | 4,232 | 760 | 1,104 | 259 | ||||||||||
Affinity relationships | 1,651 | 751 | 1,638 | 587 | ||||||||||
Other intangibles | 3,438 | 1,183 | 2,009 | 1,020 | ||||||||||
Total intangible assets | $ | 21,894 | $ | 9,868 | $ | 16,425 | $ | 7,890 | ||||||
Amortization of intangibles expense was $2.0 billion, $1.8 billion and $1.7 billion in 2009, 2008 and 2007, respectively. The Corporation estimates aggregate amortization expense will be approximately $1.8 bil -
lion, $1.6 billion, $1.4 billion, $1.2 billion and $1.0 billion for 2010 through 2014, respectively.
| 152 | Bank of America 2009 |
NOTE 11 – Deposits
The Corporation had domestic certificates of deposit and other domestic time deposits of $100 thousand or more totaling $99.4 billion and $136.6 billion at December 31, 2009 and 2008. Foreign certificates of deposit and other foreign time deposits of $100 thousand or more totaled $67.2 billion and $85.4 billion at December 31, 2009 and 2008.
Time deposits of $100 thousand or more
| (Dollars in millions) | Three months or less | Over three months to twelve months | Thereafter | Total | ||||||||
Domestic certificates of deposit and other time deposits | $ | 44,723 | $ | 45,651 | $ | 9,058 | $ | 99,432 | ||||
Foreign certificates of deposit and other time deposits | 62,473 | 3,488 | 1,282 | 67,243 | ||||||||
At December 31, 2009, the scheduled maturities for total time deposits were as follows:
| (Dollars in millions) | Domestic | Foreign | Total | ||||||
Due in 2010 | $ | 174,731 | $ | 72,507 | $ | 247,238 | |||
Due in 2011 | 14,511 | 402 | 14,913 | ||||||
Due in 2012 | 3,256 | 312 | 3,568 | ||||||
Due in 2013 | 3,284 | 216 | 3,500 | ||||||
Due in 2014 | 2,873 | 40 | 2,913 | ||||||
Thereafter | 2,282 | 342 | 2,624 | ||||||
Total time deposits | $ | 200,937 | $ | 73,819 | $ | 274,756 | |||
NOTE 12 – Short-term Borrowings
Bank of America, N.A. maintains a global program to offer up to a maximum of $75.0 billion outstanding at any one time, of bank notes with fixed or floating rates and maturities of at least seven days from the date of issue. Short-term bank notes outstanding under this program totaled $20.6 billion at December 31, 2009 compared to $10.5 billion at December 31, 2008. These short-term bank notes, along with Federal
Home Loan Bank advances, U.S. Treasury tax and loan notes, and term federal funds purchased, are reflected in commercial paper and other short-term borrowings on the Consolidated Balance Sheet. See Note 13 – Long-term Debt for information regarding the long-term notes that may be issued under the $75.0 billion bank note program.
The following table presents information for short-term borrowings.
| Short-term Borrowings | ||||||||||||||||||||||
| 2009 | 2008 | 2007 | ||||||||||||||||||||
| (Dollars in millions) | Amount | Rate | Amount | Rate | Amount | Rate | ||||||||||||||||
Federal funds purchased | ||||||||||||||||||||||
At December 31 | $ | 4,814 | 0.09 | % | $ | 14,432 | 0.11 | % | $ | 14,187 | 4.15 | % | ||||||||||
Average during year | 4,239 | 0.05 | 8,969 | 1.67 | 7,595 | 4.84 | ||||||||||||||||
Maximum month-end balance during year | 4,814 | - | 18,788 | - | 14,187 | - | ||||||||||||||||
Securities loaned or sold under agreements to repurchase | ||||||||||||||||||||||
At December 31 | 250,371 | 0.39 | 192,166 | 0.84 | 207,248 | 4.63 | ||||||||||||||||
Average during year | 365,624 | 0.96 | 264,012 | 2.54 | 245,886 | 5.21 | ||||||||||||||||
Maximum month-end balance during year | 430,067 | - | 295,537 | - | 277,196 | - | ||||||||||||||||
Commercial paper | ||||||||||||||||||||||
At December 31 | 13,131 | 0.65 | 37,986 | 1.80 | 55,596 | 4.85 | ||||||||||||||||
Average during year | 26,697 | 1.03 | 57,337 | 3.09 | 57,712 | 5.03 | ||||||||||||||||
Maximum month-end balance during year | 37,025 | - | 65,399 | - | 69,367 | - | ||||||||||||||||
Other short-term borrowings | ||||||||||||||||||||||
At December 31 | 56,393 | 1.72 | 120,070 | 2.07 | 135,493 | 4.95 | ||||||||||||||||
Average during year | 92,083 | 1.87 | 125,392 | 2.99 | 113,621 | 5.18 | ||||||||||||||||
Maximum month-end balance during year | 169,602 | - | 160,150 | - | 142,047 | - | ||||||||||||||||
| Bank of America 2009 | 153 |
NOTE 13 – Long-term Debt
Long-term debt consists of borrowings having an original maturity of one year or more. The following table presents the balance of long-term debt at December 31, 2009 and 2008 and the related rates and maturity dates at December 31, 2009.
| December 31 | ||||||
| (Dollars in millions) | 2009 | 2008 | ||||
Notes issued by Bank of America Corporation | ||||||
Senior notes: | ||||||
Fixed, with a weighted-average rate of 4.80%, ranging from 0.61% to 7.63%, due 2010 to 2043 | $ | 78,282 | $ | 64,799 | ||
Floating, with a weighted-average rate of 1.17%, ranging from 0.15% to 4.57%, due 2010 to 2041 | 47,731 | 51,488 | ||||
Structured notes | 8,897 | 5,565 | ||||
Subordinated notes: | ||||||
Fixed, with a weighted-average rate of 5.69%, ranging from 2.40% to 10.20%, due 2010 to 2038 | 28,017 | 29,618 | ||||
Floating, with a weighted-average rate of 1.60%, ranging from 0.60% to 4.39%, due 2016 to 2019 | 681 | 650 | ||||
Junior subordinated notes (related to trust preferred securities): | ||||||
Fixed, with a weighted-average rate of 6.71%, ranging from 5.25% to 11.45%, due 2026 to 2055 | 15,763 | 15,606 | ||||
Floating, with a weighted-average rate of 0.88%, ranging from 0.50% to 3.63%, due 2027 to 2056 | 3,517 | 3,736 | ||||
Total notes issued by Bank of America Corporation | 182,888 | 171,462 | ||||
Notes issued by Merrill Lynch & Co., Inc. and subsidiaries | ||||||
Senior notes: | ||||||
Fixed, with a weighted-average rate of 5.24%, ranging from 0.05% to 8.83%, due 2010 to 2066 | 52,506 | – | ||||
Floating, with a weighted-average rate of 0.80%, ranging from 0.13% to 5.29%, due 2010 to 2044 | 36,624 | – | ||||
Structured notes | 48,518 | – | ||||
Subordinated notes: | ||||||
Fixed, with a weighted-average rate of 6.07%, ranging from 0.12% to 8.13%, due 2010 to 2038 | 9,258 | – | ||||
Floating, with a weighted-average rate of 1.12%, ranging from 0.83% to 1.26%, due 2017 to 2037 | 1,857 | – | ||||
Junior subordinated notes (related to trust preferred securities): | ||||||
Fixed, with a weighted-average rate of 6.93%, ranging from 6.45% to 7.38%, due 2062 to 2066 | 3,552 | – | ||||
Other long-term debt | 2,636 | – | ||||
Total notes issued by Merrill Lynch & Co., Inc. and subsidiaries | 154,951 | – | ||||
Notes issued by Bank of America, N.A. and other subsidiaries | ||||||
Senior notes: | ||||||
Fixed, with a weighted-average rate of 2.16%, ranging from 0.40% to 8.10%, due 2010 to 2027 | 12,461 | 6,103 | ||||
Floating, with a weighted-average rate of 0.38%, ranging from 0.15% to 3.31%, due 2010 to 2051 | 24,846 | 28,467 | ||||
Subordinated notes: | ||||||
Fixed, with a weighted-average rate of 5.91%, ranging from 5.30% to 7.13%, due 2012 to 2036 | 5,193 | 5,593 | ||||
Floating, with a weighted-average rate of 0.73%, ranging from 0.25% to 3.76%, due 2010 to 2027 | 2,272 | 2,796 | ||||
Total notes issued by Bank of America, N.A. and other subsidiaries | 44,772 | 42,959 | ||||
Notes issued by NB Holdings Corporation | ||||||
Junior subordinated notes (related to trust preferred securities): | ||||||
Floating, 0.85%, due 2027 | 258 | 258 | ||||
Total notes issued by NB Holdings Corporation | 258 | 258 | ||||
Notes issued by BAC North America Holding Company and subsidiaries | ||||||
Senior notes: | ||||||
Fixed, with a weighted-average rate of 5.40%, ranging from 3.00% to 7.00%, due 2010 to 2026 | 420 | 562 | ||||
Junior subordinated notes (related to trust preferred securities): | ||||||
Fixed, 6.97%, perpetual | 490 | 491 | ||||
Floating, with a weighted-average rate of 1.54%, ranging from 0.31% to 2.03%, perpetual | 945 | 940 | ||||
Total notes issued by BAC North America Holding Company and subsidiaries | 1,855 | 1,993 | ||||
Other debt | ||||||
Advances from Federal Home Loan Banks: | ||||||
Fixed, with a weighted-average rate of 4.08%, ranging from 0.36% to 8.29%, due 2010 to 2028 | 53,032 | 48,495 | ||||
Floating, with a weighted-average rate of 0.14%, ranging from 0.13% to 0.14%, due 2011 to 2013 | 750 | 2,750 | ||||
Other | 15 | 375 | ||||
Total other debt | 53,797 | 51,620 | ||||
Total long-term debt | $ | 438,521 | $ | 268,292 | ||
The majority of the floating rates are based on three- and six-month London InterBank Offered Rates (LIBOR).
Bank of America Corporation, Merrill Lynch & Co., Inc. and subsidiaries, and Bank of America, N.A. maintain various domestic and international debt programs to offer both senior and subordinated notes. The notes may be denominated in U.S. dollars or foreign currencies. At December 31, 2009 and 2008, the amount of foreign currency-denominated debt translated into U.S. dollars included in total long-term debt was $156.8 billion and $53.3 billion. Foreign currency contracts are used to convert certain foreign currency-denominated debt into U.S. dollars.
At December 31, 2009 and 2008, Bank of America Corporation was authorized to issue approximately $119.1 billion and $92.9 billion of additional corporate debt and other securities under its existing domestic shelf registration statements. At December 31, 2009 and 2008, Bank of
America, N.A. was authorized to issue $35.3 billion and $48.3 billion of additional bank notes. Long-term bank notes outstanding under Bank of America, N.A.'s $75.0 billion bank note program totaled $19.1 billion and $16.2 billion at December 31, 2009 and 2008. In addition, Bank of America, N.A. was authorized to issue $20.6 billion of additional mortgage notes under the $30.0 billion mortgage bond program at both December 31, 2009 and 2008.
The weighted-average effective interest rates for total long-term debt (excluding structured notes), total fixed-rate debt and total floating-rate debt (based on the rates in effect at December 31, 2009) were 3.62 percent, 4.93 percent and 0.80 percent, respectively, at December 31, 2009 and (based on the rates in effect at December 31, 2008) were 4.26 percent, 5.05 percent and 2.80 percent, respectively, at December 31, 2008.
| 154 | Bank of America 2009 |
The weighted-average interest rate for debt (excluding structured notes) issued by Merrill Lynch & Co., Inc. and subsidiaries was 3.73 percent at December 31, 2009. The Corporation has not assumed or guaranteed the $154 billion of long-term debt that was issued or guaranteed by Merrill Lynch & Co., Inc. or its subsidiaries prior to the acquisition of Merrill Lynch by the Corporation. Beginning late in the third quarter of 2009, in connection with the update or renewal of certain Merrill Lynch international securities offering programs, the Corporation agreed to guarantee debt securities, warrants and/or certificates issued by certain subsidiaries of Merrill Lynch & Co., Inc. on a going forward basis. All existing Merrill Lynch & Co., Inc. guarantees of securities issued by those
same Merrill Lynch subsidiaries under various international securities offering programs will remain in full force and effect as long as those securities are outstanding, and the Corporation has not assumed any of those prior Merrill Lynch & Co., Inc. guarantees or otherwise guaranteed such securities.
In addition, certain structured notes acquired in the acquisition of Merrill Lynch are accounted for under the fair value option. For more information on these structured notes, see Note 20 – Fair Value Measurements .
Aggregate annual maturities of long-term debt obligations at December 31, 2009 are as follows:
| (Dollars in millions) | 2010 | 2011 | 2012 | 2013 | 2014 | Thereafter | Total | ||||||||||||||
Bank of America Corporation | $ | 23,354 | $ | 15,711 | $ | 39,880 | $ | 7,714 | $ | 16,119 | $ | 80,110 | $ | 182,888 | |||||||
Merrill Lynch & Co., Inc. and subsidiaries | 31,680 | 19,867 | 18,760 | 21,246 | 17,210 | 46,188 | 154,951 | ||||||||||||||
Bank of America, N.A. and other subsidiaries | 20,779 | 58 | 5,759 | 3,240 | 99 | 14,837 | 44,772 | ||||||||||||||
NB Holdings Corporation | - | - | - | - | - | 258 | 258 | ||||||||||||||
BAC North America Holding Company and subsidiaries | 74 | 43 | 15 | 26 | 45 | 1,652 | 1,855 | ||||||||||||||
Other | 23,257 | 18,364 | 5,597 | 5,132 | 1,272 | 175 | 53,797 | ||||||||||||||
Total | $ | 99,144 | $ | 54,043 | $ | 70,011 | $ | 37,358 | $ | 34,745 | $ | 143,220 | $ | 438,521 | |||||||
Certain structured notes contain provisions whereby the borrowings are redeemable at the option of the holder (put options) at specified dates prior to maturity. Other structured notes have coupon or repayment terms linked to the performance of debt or equity securities, indices, currencies or commodities and the maturity may be accelerated based on the value of a referenced index or security. In both cases, the Corporation or a subsidiary, may be required to settle the obligation for cash or other securities prior to the contractual maturity date. These borrowings are reflected in the above table as maturing at their earliest put or redemption date.
Trust Preferred and Hybrid Securities
Trust preferred securities (Trust Securities) are issued by trust companies (the Trusts) that are not consolidated. These Trust Securities are mandatorily redeemable preferred security obligations of the Trusts. The sole assets of the Trusts generally are junior subordinated deferrable interest notes of the Corporation or its subsidiaries (the Notes). The Trusts generally are 100 percent owned finance subsidiaries of the Corporation. Obligations associated with the Notes are included in the Long-term Debt table on the previous page.
Certain of the Trust Securities were issued at a discount and may be redeemed prior to maturity at the option of the Corporation. The Trusts generally have invested the proceeds of such Trust Securities in the Notes. Each issue of the Notes has an interest rate equal to the corresponding Trust Securities distribution rate. The Corporation has the right to defer payment of interest on the Notes at any time or from time to time for a period not exceeding five years provided that no extension period may extend beyond the stated maturity of the relevant Notes. During any such extension period, distributions on the Trust Securities will also be deferred and the Corporation's ability to pay dividends on its common and preferred stock will be restricted.
The Trust Securities generally are subject to mandatory redemption upon repayment of the related Notes at their stated maturity dates or their earlier redemption at a redemption price equal to their liquidation amount plus accrued distributions to the date fixed for redemption and the premium, if any, paid by the Corporation upon concurrent repayment of the related Notes.
Periodic cash payments and payments upon liquidation or redemption with respect to Trust Securities are guaranteed by the Corporation or its
subsidiaries to the extent of funds held by the Trusts (the Preferred Securities Guarantee). The Preferred Securities Guarantee, when taken together with the Corporation's other obligations including its obligations under the Notes, generally will constitute a full and unconditional guarantee, on a subordinated basis, by the Corporation of payments due on the Trust Securities.
Hybrid Income Term Securities (HITS) totaling $1.6 billion were also issued by the Trusts to institutional investors in 2007. The BAC Capital Trust XIII Floating Rate Preferred HITS have a distribution rate of three-month LIBOR plus 40 bps and the BAC Capital Trust XIV Fixed-to-Floating Rate Preferred HITS have an initial distribution rate of 5.63 percent. Both series of HITS represent beneficial interests in the assets of the respective capital trust, which consist of a series of the Corporation's junior subordinated notes and a stock purchase contract for a specified series of the Corporation's preferred stock. The Corporation will remarket the junior subordinated notes underlying each series of HITS on or about the five-year anniversary of the issuance to obtain sufficient funds for the capital trusts to buy the Corporation's preferred stock under the stock purchase contracts.
In connection with the HITS, the Corporation entered into two replacement capital covenants for the benefit of investors in certain series of the Corporation's long-term indebtedness (Covered Debt). As of December 31, 2009, the Corporation's 6.625% Junior Subordinated Notes due 2036 constitute the Covered Debt under the covenant corresponding to the Floating Rate Preferred HITS and the Corporation's 5.625% Junior Subordinated Notes due 2035 constitute the Covered Debt under the covenant corresponding to the Fixed-to-Floating Rate Preferred HITS. These covenants generally restrict the ability of the Corporation and its subsidiaries to redeem or purchase the HITS and related securities unless the Corporation has obtained the prior approval of the Board of Governors of the Federal Reserve System (Federal Reserve) if required under the Federal Reserve's capital guidelines, the redemption or purchase price of the HITS does not exceed the amount received by the Corporation from the sale of certain qualifying securities, and such replacement securities qualify as Tier 1 Capital and are not "restricted core capital elements" under the Federal Reserve's guidelines.
Also included in the outstanding Trust Securities and Notes in the following table are non-consolidated wholly owned subsidiary funding vehicles of BAC North America Holding Company (BACNAH, formerly ABN
| Bank of America 2009 | 155 |
AMRO North America Holding Company) and its subsidiary, LaSalle, that issued preferred securities (Funding Securities). These subsidiary funding vehicles have invested the proceeds of their Funding Securities in separate series of preferred securities of BACNAH or LaSalle, as applicable (BACNAH Preferred Securities). The BACNAH Preferred Securities (and the corresponding Funding Securities) are non-cumulative and permit nonpayment of dividends within certain limitations. The issuance dates for the BACNAH Preferred Securities (and the related Funding Securities)
range from 2000 to 2001. These Funding Securities are subject to mandatory redemption upon repayment by the issuer of the corresponding series of BACNAH Preferred Securities at a redemption price equal to their liquidation amount plus accrued and unpaid distributions for up to one quarter.
For additional information on Trust Securities for regulatory capital purposes, see Note 16 – Regulatory Requirements and Restrictions .
| 156 | Bank of America 2009 |
The following table is a summary of the outstanding Trust and Hybrid Securities and the related Notes at December 31, 2009 as originated by Bank of America Corporation and its predecessor companies and subsidiaries.
| Issuance Date | Aggregate Principal Amount of Trust Securities | Aggregate Principal Amount of the Notes | Stated Maturity of the Notes | Per Annum Interest Rate of the Notes | Interest Payment Dates | Redemption Period | |||||||||||
| (Dollars in millions) | |||||||||||||||||
| Issuer | |||||||||||||||||
Bank of America | |||||||||||||||||
Capital Trust I | December 2001 | $ | 575 | $ | 593 | December 2031 | 7.00 | % | 3/15,6/15,9/15,12/15 | On or after 12/15/06 | |||||||
Capital Trust II | January 2002 | 900 | 928 | February 2032 | 7.00 | 2/1,5/1,8/1,11/1 | On or after 2/01/07 | ||||||||||
Capital Trust III | August 2002 | 500 | 516 | August 2032 | 7.00 | 2/15,5/15,8/15,11/15 | On or after 8/15/07 | ||||||||||
Capital Trust IV | April 2003 | 375 | 387 | May 2033 | 5.88 | 2/1,5/1,8/1,11/1 | On or after 5/01/08 | ||||||||||
Capital Trust V | November 2004 | 518 | 534 | November 2034 | 6.00 | 2/3,5/3,8/3,11/3 | On or after 11/03/09 | ||||||||||
Capital Trust VI | March 2005 | 1,000 | 1,031 | March 2035 | 5.63 | 3/8,9/8 | Any time | ||||||||||
Capital Trust VII (1) | August 2005 | 1,415 | 1,415 | August 2035 | 5.25 | 2/10,8/10 | Any time | ||||||||||
Capital Trust VIII | August 2005 | 530 | 546 | August 2035 | 6.00 | 2/25,5/25,8/25,11/25 | On or after 8/25/10 | ||||||||||
Capital Trust X | March 2006 | 900 | 928 | March 2055 | 6.25 | 3/29,6/29,9/29,12/29 | On or after 3/29/11 | ||||||||||
Capital Trust XI | May 2006 | 1,000 | 1,031 | May 2036 | 6.63 | 5/23,11/23 | Any time | ||||||||||
Capital Trust XII | August 2006 | 863 | 890 | August 2055 | 6.88 | 2/2,5/2,8/2,11/2 | On or after 8/02/11 | ||||||||||
Capital Trust XIII | February 2007 | 700 | 700 | March 2043 | 3-mo. LIBOR +40 bps | 3/15,6/15,9/15,12/15 | On or after 3/15/17 | ||||||||||
Capital Trust XIV | February 2007 | 850 | 850 | March 2043 | 5.63 | 3/15,9/15 | On or after 3/15/17 | ||||||||||
Capital Trust XV | May 2007 | 500 | 500 | June 2056 | 3-mo. LIBOR +80 bps | 3/1,6/1,9/1,12/1 | On or after 6/01/37 | ||||||||||
NationsBank | |||||||||||||||||
Capital Trust II | December 1996 | 365 | 376 | December 2026 | 7.83 | 6/15,12/15 | On or after 12/15/06 | ||||||||||
Capital Trust III | February 1997 | 500 | 515 | January 2027 | 3-mo. LIBOR +55 bps | 1/15,4/15,7/15,10/15 | On or after 1/15/07 | ||||||||||
Capital Trust IV | April 1997 | 500 | 515 | April 2027 | 8.25 | 4/15,10/15 | On or after 4/15/07 | ||||||||||
BankAmerica | |||||||||||||||||
Institutional Capital A | November 1996 | 450 | 464 | December 2026 | 8.07 | 6/30,12/31 | On or after 12/31/06 | ||||||||||
Institutional Capital B | November 1996 | 300 | 309 | December 2026 | 7.70 | 6/30,12/31 | On or after 12/31/06 | ||||||||||
Capital II | December 1996 | 450 | 464 | December 2026 | 8.00 | 6/15,12/15 | On or after 12/15/06 | ||||||||||
Capital III | January 1997 | 400 | 412 | January 2027 | 3-mo. LIBOR +57 bps | 1/15,4/15,7/15,10/15 | On or after 1/15/02 | ||||||||||
Barnett | |||||||||||||||||
Capital III | January 1997 | 250 | 258 | February 2027 | 3-mo. LIBOR +62.5 bps | 2/1,5/1,8/1,11/1 | On or after 2/01/07 | ||||||||||
Fleet | |||||||||||||||||
Capital Trust II | December 1996 | 250 | 258 | December 2026 | 7.92 | 6/15,12/15 | On or after 12/15/06 | ||||||||||
Capital Trust V | December 1998 | 250 | 258 | December 2028 | 3-mo. LIBOR +100 bps | 3/18,6/18,9/18,12/18 | On or after 12/18/03 | ||||||||||
Capital Trust VIII | March 2002 | 534 | 550 | March 2032 | 7.20 | 3/15,6/15,9/15,12/15 | On or after 3/08/07 | ||||||||||
| Capital Trust IX | July 2003 | 175 | 180 | August 2033 | 6.00 | 2/1,5/1,8/1,11/1 | On or after 7/31/08 | ||||||||||
BankBoston | |||||||||||||||||
Capital Trust III | June 1997 | 250 | 258 | June 2027 | 3-mo. LIBOR +75 bps | 3/15,6/15,9/15,12/15 | On or after 6/15/07 | ||||||||||
Capital Trust IV | June 1998 | 250 | 258 | June 2028 | 3-mo. LIBOR +60 bps | 3/8,6/8,9/8,12/8 | On or after 6/08/03 | ||||||||||
Progress | |||||||||||||||||
Capital Trust I | June 1997 | 9 | 9 | June 2027 | 10.50 | 6/1,12/1 | On or after 6/01/07 | ||||||||||
Capital Trust II | July 2000 | 6 | 6 | July 2030 | 11.45 | 1/19,7/19 | On or after 7/19/10 | ||||||||||
Capital Trust III | November 2002 | 10 | 10 | November 2032 | 3-mo. LIBOR +335 bps | 2/15,5/15,8/15,11/15 | On or after 11/15/07 | ||||||||||
Capital Trust IV | December 2002 | 5 | 5 | January 2033 | 3-mo. LIBOR +335 bps | 1/7,4/7,7/7,10/7 | On or after 1/07/08 | ||||||||||
MBNA | |||||||||||||||||
Capital Trust A | December 1996 | 250 | 258 | December 2026 | 8.28 | 6/1,12/1 | On or after 12/01/06 | ||||||||||
Capital Trust B | January 1997 | 280 | 289 | February 2027 | 3-mo. LIBOR +80 bps | 2/1,5/1,8/1,11/1 | On or after 2/01/07 | ||||||||||
Capital Trust D | June 2002 | 300 | 309 | October 2032 | 8.13 | 1/1,4/1,7/1,10/1 | On or after 10/01/07 | ||||||||||
Capital Trust E | November 2002 | 200 | 206 | February 2033 | 8.10 | 2/15,5/15,8/15,11/15 | On or after 2/15/08 | ||||||||||
ABN AMRO North America | |||||||||||||||||
Series I | May 2001 | 77 | 77 | Perpetual | 3-mo. LIBOR +175 bps | 2/15,5/15,8/15,11/15 | On or after 11/8/12 | ||||||||||
Series II | May 2001 | 77 | 77 | Perpetual | 3-mo. LIBOR +175 bps | 3/15,6/15,9/15,12/15 | On or after 11/8/12 | ||||||||||
Series III | May 2001 | 77 | 77 | Perpetual | 3-mo. LIBOR +175 bps | 1/15,4/15,7/15,10/15 | On or after 11/8/12 | ||||||||||
Series IV | May 2001 | 77 | 77 | Perpetual | 3-mo. LIBOR +175 bps | 2/28,5/30,8/30,11/30 | On or after 11/8/12 | ||||||||||
Series V | May 2001 | 77 | 77 | Perpetual | 3-mo. LIBOR +175 bps | 3/30,6/30,9/30,12/30 | On or after 11/8/12 | ||||||||||
Series VI | May 2001 | 77 | 77 | Perpetual | 3-mo. LIBOR +175 bps | 1/30,4/30,7/30,10/30 | On or after 11/8/12 | ||||||||||
Series VII | May 2001 | 88 | 88 | Perpetual | 3-mo. LIBOR +175 bps | 3/15,6/15,9/15,12/15 | On or after 11/8/12 | ||||||||||
Series IX | June 2001 | 70 | 70 | Perpetual | 3-mo. LIBOR +175 bps | 3/5,6/5,9/5,12/5 | On or after 11/8/12 | ||||||||||
Series X | June 2001 | 53 | 53 | Perpetual | 3-mo. LIBOR +175 bps | 3/12,6/12,9/12,12/12 | On or after 11/8/12 | ||||||||||
Series XI | June 2001 | 27 | 27 | Perpetual | 3-mo. LIBOR +175 bps | 3/26,6/26,9/26,12/26 | On or after 11/8/12 | ||||||||||
Series XII | June 2001 | 80 | 80 | Perpetual | 3-mo. LIBOR +175 bps | 1/10,4/10,7/10,10/10 | On or after 11/8/12 | ||||||||||
Series XIII | June 2001 | 70 | 70 | Perpetual | 3-mo. LIBOR +175 bps | 1/24,4/24,7/24,10/24 | On or after 11/8/12 | ||||||||||
LaSalle | |||||||||||||||||
Series I | August 2000 | 491 | 491 | Perpetual | 6.97% through 9/15/2010; 3-mo. LIBOR +105.5 bps thereafter | | 3/15,6/15,9/15,12/15 | On or after 9/15/10 | |||||||||
Series J | September 2000 | 95 | 95 | Perpetual | 3-mo. LIBOR +5.5 bps through 9/15/2010; 3-mo. LIBOR +105.5 bps thereafter | | 3/15,6/15,9/15,12/15 | On or after 9/15/10 | |||||||||
Countrywide | |||||||||||||||||
Capital III | June 1997 | 200 | 206 | June 2027 | 8.05 | 6/15,12/15 | Only under special event | ||||||||||
Capital IV | April 2003 | 500 | 515 | April 2033 | 6.75 | 1/1,4/1,7/1,10/1 | On or after 4/11/08 | ||||||||||
Capital V | November 2006 | 1,495 | 1,496 | November 2036 | 7.00 | 2/1,5/1,8/1,11/1 | On or after 11/1/11 | ||||||||||
Merrill Lynch | |||||||||||||||||
Preferred Capital Trust III | January 1998 | 750 | 900 | Perpetual | 7.00 | 3/30,6/30,9/30,12/30 | On or after 3/08 | ||||||||||
Preferred Capital Trust IV | June 1998 | 400 | 480 | Perpetual | 7.12 | 3/30,6/30,9/30,12/30 | On or after 6/08 | ||||||||||
Preferred Capital Trust V | November 1998 | 850 | 1,021 | Perpetual | 7.28 | 3/30,6/30,9/30,12/30 | On or after 9/08 | ||||||||||
Capital Trust I | December 2006 | 1,050 | 1,051 | December 2066 | 6.45 | 3/15,6/15,9/15,12/15 | On or after 12/11 | ||||||||||
Capital Trust II | May 2007 | 950 | 951 | June 2062 | 6.45 | 3/15,6/15,9/15,12/15 | On or after 6/12 | ||||||||||
Capital Trust III | August 2007 | 750 | 751 | September 2062 | 7.375 | 3/15,6/15,9/15,12/15 | On or after 9/12 | ||||||||||
Total | $ | 24,991 | $ | 25,823 | |||||||||||||
| (1) | Aggregate principal amount of notes were issued in British Pound. Presentation currency is U.S. Dollar. |
| Bank of America 2009 | 157 |
NOTE 14 – Commitments and Contingencies
In the normal course of business, the Corporation enters into a number of off-balance sheet commitments. These commitments expose the Corporation to varying degrees of credit and market risk and are subject to the same credit and market risk limitation reviews as those instruments recorded on the Corporation's Consolidated Balance Sheet.
Credit Extension Commitments
The Corporation enters into commitments to extend credit such as loan commitments, SBLCs and commercial letters of credit to meet the financing needs of its customers. The unfunded legally binding lending commitments shown in the following table are net of amounts distributed (e.g., syndicated) to other financial institutions of $30.9 billion and $46.9 billion at December 31, 2009 and 2008. At December 31, 2009, the
carrying amount of these commitments, excluding commitments accounted for under the fair value option, was $1.5 billion, including deferred revenue of $34 million and a reserve for unfunded legally binding lending commitments of $1.5 billion. At December 31, 2008, the comparable amounts were $454 million, $33 million and $421 million. The carrying amount of these commitments is recorded in accrued expenses and other liabilities.
The table below also includes the notional amount of commitments of $27.0 billion and $16.9 billion at December 31, 2009 and 2008, which are accounted for under the fair value option. However, the table below excludes the fair value adjustment of $950 million and $1.1 billion on these commitments that was recorded in accrued expenses and other liabilities. For information regarding the Corporation's loan commitments accounted for at fair value, see Note 20 – Fair Value Measurements.
| (Dollars in millions) | Expires in 1 Year or Less | Expires after 1 Year through 3 Years | Expires after 3 Years through 5 Years | Expires after 5 Years | Total | ||||||||||
Credit extension commitments, December 31, 2009 | |||||||||||||||
Loan commitments | $ | 149,248 | $ | 187,585 | $ | 30,897 | $ | 28,489 | $ | 396,219 | |||||
Home equity lines of credit | 1,810 | 3,272 | 10,667 | 76,924 | 92,673 | ||||||||||
Standby letters of credit and financial guarantees (1) | 29,794 | 27,789 | 4,923 | 13,739 | 76,245 | ||||||||||
Commercial letters of credit | 2,020 | 40 | – | 1,465 | 3,525 | ||||||||||
Legally binding commitments (2) | 182,872 | 218,686 | 46,487 | 120,617 | 568,662 | ||||||||||
Credit card lines (3) | 541,919 | – | – | – | 541,919 | ||||||||||
Total credit extension commitments | $ | 724,791 | $ | 218,686 | $ | 46,487 | $ | 120,617 | $ | 1,110,581 | |||||
Credit extension commitments, December 31, 2008 | |||||||||||||||
Loan commitments | $ | 128,992 | $ | 120,234 | $ | 67,111 | $ | 31,200 | $ | 347,537 | |||||
Home equity lines of credit | 3,883 | 2,322 | 4,799 | 96,415 | 107,419 | ||||||||||
Standby letters of credit and financial guarantees (1) | 33,350 | 26,090 | 8,328 | 9,812 | 77,580 | ||||||||||
Commercial letters of credit | 2,228 | 29 | 1 | 1,507 | 3,765 | ||||||||||
Legally binding commitments (2) | 168,453 | 148,675 | 80,239 | 138,934 | 536,301 | ||||||||||
Credit card lines (3) | 827,350 | – | – | – | 827,350 | ||||||||||
Total credit extension commitments | $ | 995,803 | $ | 148,675 | $ | 80,239 | $ | 138,934 | $ | 1,363,651 | |||||
| (1) | At December 31, 2009, the notional amount of SBLC and financial guarantees classified as investment grade and non-investment grade based on the credit quality of the underlying reference name within the instrument were $45.1 billion and $31.2 billion compared to $54.4 billion and $23.2 billion at December 31, 2008. |
| (2) | Includes commitments to unconsolidated VIEs and certain QSPEs disclosed in Note 9 – Variable Interest Entities , including $25.1 billion and $41.6 billion to multi-seller conduits, and $9.8 billion and $6.8 billion to municipal bond trusts at December 31, 2009 and 2008. Also includes commitments to SPEs that are not disclosed in Note 9 – Variable Interest Entities because the Corporation does not hold a significant variable interest, including $368 million and $980 million to customer-sponsored conduits at December 31, 2009 and 2008. |
| (3) | Includes business card unused lines of credit. |
Legally binding commitments to extend credit generally have specified rates and maturities. Certain of these commitments have adverse change clauses that help to protect the Corporation against deterioration in the borrowers' ability to pay.
Other Commitments
Global Principal Investments and Other Equity Investments
At December 31, 2009 and 2008, the Corporation had unfunded equity investment commitments of approximately $2.8 billion and $1.9 billion. These commitments generally relate to the Corporation's Global Principal Investments business which is comprised of a diversified portfolio of investments in private equity, real estate and other alternative investments. These investments are made either directly in a company or held through a fund. Bridge equity commitments provide equity bridge financing to facilitate clients' investment activities. These conditional commitments are generally retired prior to or shortly following funding via syndication or the client's decision to terminate. Where the Corporation has a binding equity bridge commitment and there is a market disruption or other unexpected event, there is heightened exposure in the portfolio and higher potential for loss, unless an orderly disposition of the exposure can be made. At December 31, 2009, the Corporation did not
have any unfunded bridge equity commitments. The Corporation had funded equity bridges of $1.2 billion that were committed prior to the market disruption. These equity bridges are considered held for investment and recorded in other assets. In 2009, the Corporation recorded a total of $670 million in losses in equity investment income related to these investments. At December 31, 2009, these equity bridges had a zero balance.
Loan Purchases
In 2005, the Corporation entered into an agreement for the committed purchase of retail automotive loans over a five-year period, ending June 30, 2010. The Corporation purchased $6.6 billion of such loans in 2009 and purchased $12.0 billion of such loans in 2008 under this agreement. As of December 31, 2009, the Corporation was committed for additional purchases of $6.5 billion over the remaining term of the agreement. All loans purchased under this agreement are subject to a comprehensive set of credit criteria. This agreement is accounted for as a derivative liability with a fair value of $189 million and $316 million at December 31, 2009 and 2008.
At December 31, 2009, the Corporation had commitments to purchase loans (e.g., residential mortgage and commercial real estate) of $2.2 billion which upon settlement will be included in loans or LHFS.
| 158 | Bank of America 2009 |
Operating Leases
The Corporation is a party to operating leases for certain of its premises and equipment. Commitments under these leases are approximately $3.1 billion, $2.8 billion, $2.3 billion, $1.9 billion and $1.5 billion for 2010 through 2014, respectively, and $8.1 billion for all years thereafter.
Other Commitments
At December 31, 2009, the Corporation had commitments to enter into forward-dated resale and securities borrowing agreements of $51.8 billion. In addition, the Corporation had commitments to enter into forward-dated repurchase and securities lending agreements of $58.3 billion. All of these commitments expire within the next 12 months.
Beginning in the second half of 2007, the Corporation provided support to certain cash funds managed within GWIM . The funds for which the Corporation provided support typically invested in high quality, short-term securities with a portfolio weighted-average maturity of 90 days or less, including securities issued by SIVs and senior debt holdings of financial service companies. Due to market disruptions, certain investments in SIVs and senior debt securities were downgraded by the ratings agencies and experienced a decline in fair value. The Corporation entered into capital commitments under which the Corporation provided cash to these funds as a result of the net asset value per unit of a fund declining below certain thresholds. All capital commitments to these cash funds have been terminated. In 2009 and 2008, the Corporation recorded losses of $195 million and $1.1 billion related to these capital commitments.
The Corporation does not consolidate the cash funds managed within GWIM because the subordinated support provided by the Corporation did not absorb a majority of the variability created by the assets of the funds. In reaching this conclusion, the Corporation considered both interest rate and credit risk. The cash funds had total assets under management of $104.4 billion and $185.9 billion at December 31, 2009 and 2008.
In connection with federal and state securities regulators, the Corporation agreed to purchase at par ARS held by certain customers. During 2009, the Corporation purchased a net $3.8 billion of ARS from its customers. At December 31, 2009, the Corporation's outstanding buyback commitment was $291 million.
In addition, the Corporation has entered into agreements with providers of market data, communications, systems consulting and other office-related services. At December 31, 2009, the minimum fee commitments over the remaining life of these agreements totaled $2.3 billion.
Other Guarantees
Bank-owned Life Insurance Book Value Protection
The Corporation sells products that offer book value protection to insurance carriers who offer group life insurance policies to corporations, primarily banks. The book value protection is provided on portfolios of intermediate investment-grade fixed income securities and is intended to cover any shortfall in the event that policyholders surrender their policies and market value is below book value. To manage its exposure, the Corporation imposes significant restrictions on surrenders and the manner in which the portfolio is liquidated and the funds are accessed. In addition, investment parameters of the underlying portfolio are restricted. These constraints, combined with structural protections, including a cap on the amount of risk assumed on each policy, are designed to provide adequate buffers and guard against payments even under extreme stress scenarios. These guarantees are recorded as derivatives and carried at fair value in the trading portfolio. At December 31, 2009 and 2008, the notional amount of these guarantees totaled $15.6 billion and $15.1 billion and the Corporation's maximum exposure related to these guaran -
tees totaled $4.9 billion and $4.8 billion with estimated maturity dates between 2030 and 2040. As of December 31, 2009 and 2008, the Corporation has not made a payment under these products. The probability of surrender has increased due to investment manager underperformance and the deteriorating financial health of policyholders, but remains a small percentage of total notional.
Employee Retirement Protection
The Corporation sells products that offer book value protection primarily to plan sponsors of Employee Retirement Income Security Act of 1974 (ERISA) governed pension plans, such as 401(k) plans and 457 plans. The book value protection is provided on portfolios of intermediate/short-term investment-grade fixed income securities and is intended to cover any shortfall in the event that plan participants continue to withdraw funds after all securities have been liquidated and there is remaining book value. The Corporation retains the option to exit the contract at any time. If the Corporation exercises its option, the purchaser can require the Corporation to purchase high quality fixed income securities, typically government or government-backed agency securities, with the proceeds of the liquidated assets to assure the return of principal. To manage its exposure, the Corporation imposes significant restrictions and constraints on the timing of the withdrawals, the manner in which the portfolio is liquidated and the funds are accessed, and the investment parameters of the underlying portfolio. These constraints, combined with structural protections, are designed to provide adequate buffers and guard against payments even under extreme stress scenarios. These guarantees are recorded as derivatives and carried at fair value in the trading portfolio. At December 31, 2009 and 2008, the notional amount of these guarantees totaled $36.8 billion and $37.4 billion with estimated maturity dates between 2010 and 2014 if the exit option is exercised on all deals. As of December 31, 2009 and 2008, the Corporation has not made a payment under these products and has assessed the probability of payments under these guarantees as remote.
Indemnifications
In the ordinary course of business, the Corporation enters into various agreements that contain indemnifications, such as tax indemnifications, whereupon payment may become due if certain external events occur, such as a change in tax law. The indemnification clauses are often standard contractual terms and were entered into in the normal course of business based on an assessment that the risk of loss would be remote. These agreements typically contain an early termination clause that permits the Corporation to exit the agreement upon these events. The maximum potential future payment under indemnification agreements is difficult to assess for several reasons, including the occurrence of an external event, the inability to predict future changes in tax and other laws, the difficulty in determining how such laws would apply to parties in contracts, the absence of exposure limits contained in standard contract language and the timing of the early termination clause. Historically, any payments made under these guarantees have been de minimis. The Corporation has assessed the probability of making such payments in the future as remote.
Merchant Services
On June 26, 2009, the Corporation contributed its merchant processing business to a joint venture in exchange for a 46.5 percent ownership interest in the joint venture. The Corporation indemnified the joint venture for any losses resulting from transactions processed through June 26, 2009 on the contributed merchant portfolio.
The Corporation, on behalf of the joint venture, provides credit and debit card processing services to various merchants by processing credit and debit card transactions on the merchants' behalf. In connection with these services, a liability may arise in the event of a billing dispute between the merchant and a cardholder that is ultimately resolved in the
| Bank of America 2009 | 159 |
cardholder's favor and the merchant defaults upon its obligation to reimburse the cardholder. A cardholder, through its issuing bank, generally has until the later of up to six months after the date a transaction is processed or the delivery of the product or service to present a chargeback to the joint venture as the merchant processor. If the joint venture is unable to collect this amount from the merchant, it bears the loss for the amount paid to the cardholder. The joint venture is primarily liable for any losses on transactions from the contributed portfolio that occur after June 26, 2009. However, if the joint venture fails to meet its obligation to reimburse the cardholder for disputed transactions, then the Corporation could be held liable for the disputed amount. In 2009 and 2008, the Corporation processed $323.8 billion and $369.4 billion of transactions and recorded losses as a result of these chargebacks of $26 million and $21 million.
At December 31, 2009 and 2008, the Corporation, on behalf of the joint venture, held as collateral $26 million and $38 million of merchant escrow deposits which may be used to offset amounts due from the individual merchants. The joint venture also has the right to offset any payments with cash flows otherwise due to the merchant. Accordingly, the Corporation believes that the maximum potential exposure is not representative of the actual potential loss exposure. The Corporation believes the maximum potential exposure for chargebacks would not exceed the total amount of merchant transactions processed through Visa and MasterCard for the last six months, which represents the claim period for the cardholder, plus any outstanding delayed-delivery transactions. As of December 31, 2009 and 2008, the maximum potential exposure totaled approximately $131.0 billion and $147.1 billion. The Corporation does not expect to make material payments in connection with these guarantees. The maximum potential exposure disclosed above does not include volumes processed by First Data contributed portfolios.
Brokerage Business
For a portion of the Corporation's brokerage business, the Corporation has contracted with a third party to provide clearing services that include underwriting margin loans to the Corporation's clients. This contract stipulates that the Corporation will indemnify the third party for any margin loan losses that occur in its issuing margin to the Corporation's clients. The maximum potential future payment under this indemnification was $657 million and $577 million at December 31, 2009 and 2008. Historically, any payments made under this indemnification have not been material. As these margin loans are highly collateralized by the securities held by the brokerage clients, the Corporation has assessed the probability of making such payments in the future as remote. This indemnification would end with the termination of the clearing contract.
Other Derivative Contracts
The Corporation funds selected assets, including securities issued by CDOs and CLOs, through derivative contracts, typically total return swaps, with third parties and SPEs that are not consolidated on the Corporation's Consolidated Balance Sheet. At December 31, 2009, the total notional amount of these derivative contracts was approximately $4.9 billion with commercial banks and $2.8 billion with SPEs. The underlying securities are senior securities and substantially all of the Corporation's exposures are insured. Accordingly, the Corporation's exposure to loss consists principally of counterparty risk to the insurers. In certain circumstances, generally as a result of ratings downgrades, the Corporation may be required to purchase the underlying assets, which would not result in additional gain or loss to the Corporation as such exposure is already reflected in the fair value of the derivative contracts.
Other Guarantees
The Corporation sells products that guarantee the return of principal to investors at a preset future date. These guarantees cover a broad range of underlying asset classes and are designed to cover the shortfall between the market value of the underlying portfolio and the principal amount on the preset future date. To manage its exposure, the Corporation requires that these guarantees be backed by structural and investment constraints and certain pre-defined triggers that would require the underlying assets or portfolio to be liquidated and invested in zero-coupon bonds that mature at the preset future date. The Corporation is required to fund any shortfall at the preset future date between the proceeds of the liquidated assets and the purchase price of the zero-coupon bonds. These guarantees are recorded as derivatives and carried at fair value in the trading portfolio. At December 31, 2009 and 2008, the notional amount of these guarantees totaled $2.1 billion and $1.3 billion. These guarantees have various maturities ranging from two to five years. At December 31, 2009 and 2008, the Corporation had not made a payment under these products and has assessed the probability of payments under these guarantees as remote.
The Corporation has entered into additional guarantee agreements, including lease end obligation agreements, partial credit guarantees on certain leases, real estate joint venture guarantees, sold risk participation swaps and sold put options that require gross settlement. The maximum potential future payment under these agreements was approximately $3.6 billion and $7.3 billion at December 31, 2009 and 2008. The estimated maturity dates of these obligations are between 2010 and 2033. The Corporation has made no material payments under these guarantees.
In addition, the Corporation has guaranteed the payment obligations of certain subsidiaries of Merrill Lynch on certain derivative transactions. The aggregate amount of such derivative liabilities was approximately $2.5 billion at December 31, 2009.
Litigation and Regulatory Matters
In the ordinary course of business, the Corporation and its subsidiaries are routinely defendants in or parties to many pending and threatened legal actions and proceedings, including actions brought on behalf of various classes of claimants. Certain of these actions and proceedings are based on alleged violations of consumer protection, securities, environmental, banking, employment and other laws. In certain of these actions and proceedings, claims for substantial monetary damages are asserted against the Corporation and its subsidiaries.
In the ordinary course of business, the Corporation and its subsidiaries are also subject to regulatory examinations, information gathering requests, inquiries and investigations. Certain subsidiaries of the Corporation are registered broker/dealers or investment advisors and are subject to regulation by the SEC, the Financial Industry Regulatory Authority (FINRA), the New York Stock Exchange, the Financial Services Authority and other domestic, international and state securities regulators. In connection with formal and informal inquiries by those agencies, such subsidiaries receive numerous requests, subpoenas and orders for documents, testimony and information in connection with various aspects of their regulated activities.
In view of the inherent difficulty of predicting the outcome of such litigation and regulatory matters, particularly where the claimants seek very large or indeterminate damages or where the matters present novel legal theories or involve a large number of parties, the Corporation cannot state with confidence what the eventual outcome of the pending matters will be, what the timing of the ultimate resolution of these matters will be, or what the eventual loss, fines or penalties related to each pending matter may be.
| 160 | Bank of America 2009 |
In accordance with applicable accounting guidance, the Corporation establishes reserves for litigation and regulatory matters when those matters present loss contingencies that are both probable and estimable. When loss contingencies are not both probable and estimable, the Corporation does not establish reserves. In some of the matters described below, including but not limited to the Lehman Brothers Holdings, Inc. matters, loss contingencies are not both probable and estimable in the view of management, and accordingly, reserves have not been established for those matters. Based on current knowledge, management does not believe that loss contingencies, if any, arising from pending litigation and regulatory matters, including the litigation and regulatory matters described below, will have a material adverse effect on the consolidated financial position or liquidity of the Corporation, but may be material to the Corporation's results of operations for any particular reporting period.
Adelphia Litigation
Adelphia Recovery Trust is the plaintiff in a lawsuit pending in the U.S. District Court for the Southern District of New York, entitled Adelphia Recovery Trust v. Bank of America, N.A., et al . The lawsuit was filed on July 6, 2003 and originally named over 700 defendants, including Bank of America, N.A. (BANA), Banc of America Securities LLC (BAS), Merrill Lynch, Merrill Lynch Capital Corp., Fleet National Bank and Fleet Securities, Inc. (collectively Fleet) and other affiliated entities, and asserted over 50 claims under federal statutes and state common law relating to loans and other services provided to various affiliates of Adelphia Communications Corporation (ACC) and entities owned by members of the founding family of ACC. The plaintiff seeks compensatory damages of approximately $5 billion, plus fees, costs and exemplary damages. The District Court granted in part defendants' motions to dismiss, which resulted in the dismissal of approximately 650 defendants from the lawsuit. The plaintiff appealed the dismissal decision. The primary claims remaining against BANA, BAS, Merrill Lynch, Merrill Lynch Capital Corp. and Fleet include fraud, aiding and abetting fraud and aiding and abetting breach of fiduciary duty. There are several pending defense motions for summary judgment. Trial is scheduled for September 13, 2010.
Auction Rate Securities Claims
On March 25, 2008, a putative class action, entitled Burton v. Merrill Lynch & Co., Inc., et al ., was filed in the U.S. District Court for the Southern District of New York against Merrill Lynch Pierce, Fenner and Smith Incorporated (MLPF&S) and Merrill Lynch on behalf of persons who purchased and continue to hold ARS offered for sale by MLPF&S between March 25, 2003 and February 13, 2008. The complaint alleges, among other things, that MLPF&S failed to disclose material facts about ARS. A similar action, entitled Stanton v. Merrill Lynch & Co., Inc., et al. , was filed the next day in the same court. On October 31, 2008, the two cases, entitled In Re Merrill Lynch Auction Rate Securities Litigation , were consolidated, and, on December 10, 2008, plaintiffs filed a consolidated class action amended complaint. Plaintiffs seek to recover alleged losses in the market value of ARS allegedly caused by the decision of MLPF&S and Merrill Lynch to discontinue supporting auctions for ARS. Plaintiffs seek unspecified damages, including rescission, other compensatory and consequential damages, costs, fees and interest. On February 27, 2009, defendants filed a motion to dismiss the consolidated amended complaint in In Re Merrill Lynch Auction Rate Securities Litigation . On May 22, 2009, the plaintiffs filed a second amended consolidated complaint. On July 24, 2009, Merrill Lynch filed a motion to dismiss the second amended consolidated complaint.
On May 22, 2008, a putative class action, entitled Bondar v. Bank of America Corporation , was filed in the U.S. District Court for the Northern
District of California against the Corporation, Banc of America Investment Services, Inc. (BAI) and BAS on behalf of persons who purchased ARS from the defendants. The amended complaint, which was filed on January 22, 2009, alleges, among other things, that the Corporation, BAI and BAS manipulated the market for, and failed to disclose material facts about ARS, and seeks to recover unspecified damages for losses in the market value of ARS allegedly caused by the decision of BAS and other broker/dealers to discontinue supporting auctions for ARS. On February 12, 2009, the Judicial Panel on Multidistrict Litigation (MDL Panel) consolidated Bondar and two related, individual federal actions into one proceeding in the U.S. District Court for the Northern District of California. On September 9, 2009, defendants filed their motion to dismiss the second amended consolidated complaint.
On September 4, 2008, two civil antitrust putative class actions, Mayor and City Council of Baltimore, Maryland v. Citigroup et al., and Mayfield et al. v. Citigroup Inc. et al ., were filed in the U.S. District Court for the Southern District of New York against the Corporation, Merrill Lynch, and other financial institutions alleging that the defendants conspired to restrain trade in ARS by artificially supporting auctions and later withdrawing that support. City Council of Baltimore is filed on behalf of a class of issuers of ARS underwritten by the defendants between May 12, 2003 and February 13, 2008 who seek to recover the alleged above-market interest payments they claim they were forced to make when the Corporation, Merrill Lynch and others allegedly discontinued supporting ARS. In addition, the plaintiffs who also purchased ARS seek to recover claimed losses in the market value of those securities allegedly caused by the decision of the financial institutions to discontinue supporting auctions for the securities. These plaintiffs seek treble damages and seek to rescind at par their purchases of ARS. Mayfield is filed on behalf of a class of persons who acquired ARS directly from defendants and who held those securities as of February 13, 2008. Plaintiffs seek to recover alleged losses in the market value of ARS allegedly caused by the decision of the Corporation and Merrill Lynch and others to discontinue supporting auctions for the securities. Plaintiffs seek treble damages and seek to rescind at par their purchases of ARS. On January 15, 2009, defendants, including the Corporation and Merrill Lynch, filed a motion to dismiss the complaints. On January 25, 2010, the District Court dismissed the two cases with prejudice.
Since October 2007, numerous arbitrations and individual lawsuits have been filed against the Corporation, BANA, BAS, BAI, MLPF&S and in some cases Merrill Lynch by parties who purchased ARS. Plaintiffs in these cases, which assert substantially the same types of claims, allege that defendants manipulated the market for, and failed to disclose material facts about, ARS. Plaintiffs seek compensatory and punitive damages totaling in excess of $2.6 billion as well as rescission, among other relief.
Countrywide Bond Insurance Litigation
On September 30, 2008, Countrywide Financial Corporation (CFC) and other Countrywide entities were named as defendants in an action filed by MBIA Insurance Corporation (MBIA), entitled MBIA Insurance Corporation, Inc. v. Countrywide Home Loans, et al ., in New York Supreme Court, New York County. The action relates to bond insurance policies provided by MBIA with regard to certain securitized pools of home equity lines of credit and fixed-rate second lien mortgage loans. MBIA allegedly has paid claims as a result of defaults in the underlying loans, and claims that these defaults are the result of improper underwriting. On August 24, 2009, MBIA filed an amended complaint in the action, which includes allegations regarding five additional securitizations, and adds the Corporation and Countrywide Home Loans Servicing, LP as defendants. The amended complaint alleges misrepresentation and breach of contract,
| Bank of America 2009 | 161 |
among other claims, and seeks unspecified actual and punitive damages, and attorneys' fees from the Countrywide defendants and from the Corporation as an alleged successor to the Countrywide defendants. On October 9, 2009, the Corporation and the Countrywide defendants filed a motion to dismiss certain claims asserted in the amended complaint.
On January 28, 2009, Syncora Guarantee Inc. (Syncora) filed suit, entitled Syncora Guarantee Inc. v. Countrywide Home Loans, Inc., et al ., in New York Supreme Court, New York County against CFC and certain other Countrywide entities. The action relates to bond insurance policies provided by Syncora with regard to certain securitized pools of home equity lines of credit. Syncora allegedly has paid claims as a result of defaults in the underlying loans, and claims that these defaults are the result of improper loan underwriting. The complaint alleges misrepresentation and breach of contract, among other claims, and seeks unspecified actual and punitive damages, and attorneys' fees. The defendants have moved to dismiss certain of the claims.
On July 10, 2009, MBIA filed a complaint, entitled MBIA Insurance Corporation, Inc. v. Bank of America Corporation, Countrywide Financial Corporation, Countrywide Home Loans, Inc., Countrywide Securities Corporation, et al., in Superior Court of the State of California, County of Los Angeles, against the Corporation, CFC, various Countrywide entities and other individuals and entities. MBIA, which amended the complaint on November 3, 2009, purports to bring the action as subrogee to the note holders for certain securitized pools of home equity lines of credit and fixed-rate second lien mortgage loans. The complaint is based upon the same allegations set forth in the complaints filed in the MBIA Insurance Corporation Inc., v. Countrywide Home Loan et al., action and asserts claims for, among other things, misrepresentation, breach of contract, and violations of certain California statutes. The complaint seeks unspecified damages and declaratory relief. On December 4, 2009, the Corporation and various defendants filed demurrers in response to the amended complaint.
On December 11, 2009, Financial Guaranty Insurance Company (FGIC) filed a complaint, entitled Financial Guaranty Insurance Co., v. Countrywide Home Loans, Inc ., in New York Supreme Court, New York County, against Countrywide Home Loans, Inc. The action relates to bond insurance policies provided by FGIC with regard to certain securitized pools of home equity lines of credit and fixed-rate second lien mortgage loans. FGIC allegedly has paid claims as a result of defaults in the underlying loans, and claims that these defaults are the result of improper loan underwriting. The complaint alleges misrepresentation and breach of contract, among other claims, and seeks unspecified actual and punitive damages, and attorneys' fees.
Countrywide Equity and Debt Securities Matters
CFC, certain other Countrywide entities, and certain former officers and directors of CFC, among others, have been named as defendants in two putative class actions filed in the U.S. District Court for the Central District of California relating to certain CFC equity and debt securities. One case, entitled In re Countrywide Financial Corp. Securities Litigation , was filed on January 25, 2008 by certain New York state and municipal pension funds on behalf of purchasers of CFC's common stock and certain other equity and debt securities. The complaint alleges, among other things, that CFC made misstatements (including in certain SEC filings) concerning the nature and quality of its loan underwriting practices and its financial results, in violation of the antifraud provisions of the Securities Exchange Act of 1934 and Sections 11 and 12 of the Securities Act of 1933. Plaintiffs also assert claims against BAS, MLPF&S and other underwriter defendants under Sections 11 and 12 of the Securities Act of 1933. Plaintiffs seek unspecified compensatory damages, among other remedies. On December 1, 2008, the court granted in part and denied in
part the defendants' motions to dismiss the first consolidated amended complaint, with leave to amend certain claims. Plaintiffs filed a second consolidated amended complaint. On April 6, 2009, the District Court denied the motions to dismiss the amended complaint made by CFC and the underwriters. On December 9, 2009, the District Court granted in part and denied in part plaintiffs' motion for class certification. On December 23, 2009, defendants sought interlocutory appeal of certain aspects of the District Court's class certification decision. Trial is scheduled for August 2010.
The other case, entitled Argent Classic Convertible Arbitrage Fund L.P. v. Countrywide Financial Corp. et al. , was filed in the U.S. District Court for the Central District of California on October 5, 2007 against CFC on behalf of purchasers of certain Series A and B debentures issued in various private placements pursuant to a May 16, 2007 CFC offering memorandum. This matter involves allegations similar to those in the In re Countrywide Financial Corporation Securities Litigation case, asserts claims under the antifraud provisions of the Securities Exchange Act of 1934 and California state law, and seeks unspecified damages. Plaintiff filed an amended complaint that added the Corporation as a defendant. On March 9, 2009, the District Court dismissed the Corporation from the case; CFC remains as a named defendant. On December 9, 2009, the District Court denied plaintiff's motion for class certification. CFC and Argent Classic, on its own behalf, have reached a settlement in principle to dismiss the case with prejudice subject to execution of a definitive settlement agreement. Trial is scheduled for July 2010.
CFC has also responded to subpoenas from the SEC and the U.S. Department of Justice (the DOJ).
Countrywide FTC Investigation
On June 20, 2008, the Federal Trade Commission (FTC) issued Civil Investigative Demands to CFC regarding Countrywide's mortgage servicing practices. On January 6, 2010, FTC Staff sent a letter to the Corporation offering an opportunity to discuss settlement and enclosing a proposed consent order and draft complaint that reflects FTC Staff's views that certain servicing practices of Countrywide Home Loans, Inc., and Countrywide Home Loans Servicing, LP, which is now known as BAC Home Loans Servicing, LP, violate Section 5 of the Federal Trade Commission Act (the FTC Act) and the Fair Debt Collection Practices Act. FTC Staff also advised that if consent negotiations are not successful, it will recommend that an enforcement action seeking injunctive relief and consumer redress be filed against Countrywide Home Loans, Inc. and BAC Home Loans Servicing, LP for violations of Section 5 of the FTC Act and the Fair Debt Collections Practices Act. The Corporation believes that the servicing practices of Countrywide Home Loans, Inc. and BAC Home Loans Servicing, LP did not and do not violate Section 5 of the FTC Act and the Fair Debt Collections Practices Act. The Corporation is currently involved in discussions with FTC Staff concerning the Staff's views.
Countrywide Mortgage-Backed Securities Litigation
CFC, certain other Countrywide entities, certain former CFC officers and directors, as well as BAS and MLPF&S, are named as defendants in a consolidated putative class action, entitled Luther v. Countrywide Home Loans Servicing LP, et al ., filed on November 14, 2007 in the Superior Court of the State of California, County of Los Angeles, that relates to public offerings of various MBS. The consolidated complaint alleges, among other things, that the mortgage loans underlying these securities were improperly underwritten and failed to comply with the guidelines and processes described in the applicable registration statements and prospectus supplements, in violation of Sections 11 and 12 of the Securities Act of 1933, and seeks unspecified compensatory damages, among other relief. In March 2009, defendants moved to dismiss the case in the
| 162 | Bank of America 2009 |
Superior Court. On June 15, 2009, the Superior Court entered an order staying the state court proceeding and directing the plaintiffs to file suit in Federal Court. On August 24, 2009, the plaintiffs filed a complaint in the U.S. District Court for the Central District of California seeking a declaratory judgment that the Superior Court had subject matter jurisdiction over their claims. The District Court dismissed the declaratory judgment action. On January 6, 2010, the Superior Court lifted the stay entered on June 15, 2009 and dismissed plaintiffs' consolidated complaint with prejudice for lack of subject matter jurisdiction. On January 14, 2010, one of the plaintiffs in the Luther case , the Maine State Retirement System, filed a new putative class action complaint in the U.S. District Court for the Central District of California entitled Maine State Retirement System v. Countrywide Financial Corporation, et al . The complaint names CFC, certain other Countrywide entities, certain former CFC officers and directors, as well as BAS and MLPF&S as defendants. Plaintiff's allegations, claims and remedies sought are substantially similar and concern the same offerings of MBS at issue in the Luther case that was dismissed by the Superior Court.
On August 15, 2008, a complaint, entitled New Mexico State Investment Council, et al. v. Countrywide Financial Corporation, et al ., was filed in the First Judicial Court for the County of Santa Fe against CFC, certain other CFC entities and certain former officers and directors of CFC by three New Mexico governmental entities that allegedly acquired certain of the MBS also at issue in the Luther case . The complaint initially asserted claims under the Securities Act of 1933 and New Mexico state law and seeks unspecified compensatory damages and rescission. On March 25, 2009, the court denied the motion to dismiss the complaint. The individual defendants were dismissed based on lack of personal jurisdiction. On November 13, 2009, plaintiffs voluntarily dismissed the New Mexico state law claims. Trial is scheduled for October 2010.
On October 13, 2009, the Federal Home Loan Bank of Pittsburgh (FHLB Pittsburgh) filed a complaint, entitled Federal Home Loan Bank of Pittsburgh v. Countrywide Securities Corporation et al. , in the Court of Common Pleas of Allegheny County Pennsylvania against CFC, Countrywide Securities Corporation (CSC), Countrywide Home Loans, Inc., CWALT, Inc. and CWMBS, Inc., among other defendants, alleging violations of the Securities Act of 1933 and the Pennsylvania Securities Act of 1972, as well as fraud and negligent misrepresentation under Pennsylvania common law in connection with various offerings of MBS. The complaint asserts, among other things, misstatements and omissions concerning the credit quality of the mortgage loans underlying the securities and the loan origination practices associated with those loans and seeks unspecified damages and rescission, among other relief. The Countrywide defendants moved to dismiss the complaint on February 26, 2010.
On December 23, 2009, the Federal Home Loan Bank of Seattle (FHLB Seattle) filed three complaints in the Superior Court of Washington for King County alleging violations of the Securities Act of Washington in connection with various offerings of MBS and makes allegations similar to those in the FHLB Pittsburgh matter. The complaints seek rescission, interest, costs and attorneys' fees. The case, entitled Federal Home Loan Bank of Seattle v. Banc of America Securities LLC, et al ., was filed against CFC, CWALT, Inc., BAS, Banc of America Funding Corporation, and the Corporation. The case, entitled Federal Home Loan Bank of Seattle v. Countrywide Securities Corporation, et al ., was filed against CFC, CSC, CWALT, Inc., Merrill Lynch Mortgage Investors, Inc., and Merrill Lynch Mortgage Capital, Inc. The case, entitled Federal Home Loan Bank of Seattle v. UBS Securities LLC, et al ., was filed against CFC, CWMBS, Inc., CWALT, Inc., and UBS Securities LLC.
Data Treasury Litigation
The Corporation and BANA were named as defendants in two cases filed by Data Treasury Corporation (Data Treasury) in the U.S. District Court for the Eastern District of Texas. In one case filed on June 25, 2005 (Ballard), Data Treasury alleged that defendants "provided, sold, installed, utilized, and assisted others to use and utilize image-based banking and archival solutions" in a manner that infringed United States Patent Nos. 5,910,988 and 6,032,137. In the other case filed on February 24, 2006 (Huntington), Data Treasury alleged that the Corporation and BANA, along with LaSalle Bank Corporation and LaSalle Bank, N.A., were "making, using, selling, offering for sale, and/or importing into the United States, directly, contributory, and/or by inducement, without authority, products and services that fall within the scope of the claims of" United States Patent Nos. 5,265,007; 5,583,759; 5,717,868; and 5,930,778. The Huntington case also claimed infringement against the LaSalle defendants of the patents at issue in the Ballard case. The Ballard and Huntington cases are now consolidated in the Data Treasury Corporation v. Wells Fargo, et al ., action, although the claims related to the Huntington patents are currently stayed. Data Treasury seeks significant compensatory damages and equitable relief in the Ballard case and unspecified compensatory damages and injunctive relief in the Huntington case. The District Court has scheduled the Ballard case for trial in October 2010.
Enron Litigation
On April 8, 2002, Merrill Lynch and MLPF&S were added as defendants in a consolidated class action, entitled Newby v. Enron Corp. et al. , filed in the U.S. District Court for the Southern District of Texas on behalf of certain purchasers of Enron's publicly traded equity and debt securities. The complaint alleges, among other things, that Merrill Lynch and MLPF&S engaged in improper transactions that helped Enron misrepresent its earnings and revenues. On March 5, 2009, the District Court granted Merrill Lynch and MLPF&S's motion for summary judgment and dismissed the claims against Merrill Lynch and MLPF&S with prejudice. Subsequently, the lead plaintiff, Merrill Lynch and certain other defendants filed a motion to dismiss and for entry of final judgment. The District Court granted the motion on December 2, 2009 and dismissed all claims against Merrill Lynch and MLPF&S with prejudice.
Heilig-Meyers Litigation
In AIG Global Securities Lending Corp., et al. v. Banc of America Securities LLC , filed on December 7, 2001 and formerly pending in the U.S. District Court for the Southern District of New York, the plaintiffs purchased ABS issued by a trust formed by Heilig-Meyers Co., and allege that BAS, as underwriter, made misrepresentations in connection with the sale of those securities in violation of the federal securities laws and New York common law. The case was tried and a jury rendered a verdict against BAS in favor of the plaintiffs for violations of Section 10(b) of the Securities Exchange Act of 1934 and Rule 10b-5 and for common law fraud. The jury awarded aggregate compensatory damages of $84.9 million plus prejudgment interest totaling approximately $59 million. On May 14, 2009, the District Court denied BAS's post trial motions to set aside the verdict. BAS has filed an appeal in the U.S. Court of Appeals for the Second Circuit.
IndyMac Litigation
On January 20, 2009, BAS and MLPF&S, in their capacity as underwriters, along with IndyMac MBS, IndyMac ABS, and other underwriters and individuals, were named as defendants in a putative class action complaint, entitled IBEW Local 103 v. Indymac MBS et al ., filed in the Superior Court of the State of California, County of Los Angeles, by purchasers of IndyMac mortgage pass-through certificates. The complaint
| Bank of America 2009 | 163 |
alleges, among other things, that the mortgage loans underlying these securities were improperly underwritten and failed to comply with the guidelines and processes described in the applicable registration statements and prospectus supplements, in violation of Sections 11 and 12 of the Securities Act of 1933, and seeks unspecified compensatory damages and rescission, among other relief.
On May 14, 2009, the Corporation (as the alleged successor-in-interest to MLPF&S), CSC, IndyMac MBS, IndyMac ABS, and other underwriters and individuals, were named as defendants in a putative class action complaint, entitled Police & Fire Retirement System of the City of Detroit v. IndyMac MBS, Inc., et al ., filed in the U.S. District Court for the Southern District of New York. On June 29, 2009, the Corporation (as the alleged successor-in-interest to CSC and MLPF&S) and other underwriters and individuals were named as defendants in another putative class action complaint, entitled Wyoming State Treasurer, et al. v. John Olinski, et al ., also filed in the U.S. District Court for the Southern District of New York. The allegations, claims, and remedies sought in these cases are substantially similar to those in the IBEW Local 103 case. On July 29, 2009, Police & Fire Retirement System and Wyoming State Treasurer were consolidated by the U.S. District Court for the Southern District of New York and a consolidated amended complaint was filed on October 9, 2009. The consolidated complaint named the Corporation as a defendant based on allegations that the Corporation is the "successor-in-interest" to CSC and MLPF&S. BAS and CSC were not named as defendants. Prior to the consolidation of these matters, the IBEW Local 103 case was voluntarily dismissed by plaintiffs and its allegations and claims were incorporated into the consolidated amended complaint. A motion to dismiss the consolidated amended complaint was filed on November 23, 2009.
In re Initial Public Offering Securities Litigation
Beginning in 2001, BAS, Merrill Lynch, MLPF&S, other underwriters, and various issuers and others, were named as defendants in certain putative class action lawsuits that have been consolidated in the U.S. District Court for the Southern District of New York as In re Initial Public Offering Securities Litigation . Plaintiffs contend that the defendants failed to make certain required disclosures and manipulated prices of securities sold in initial public offerings through, among other things, alleged agreements with institutional investors receiving allocations to purchase additional shares in the aftermarket and seek unspecified damages. On December 5, 2006, the U.S. Court of Appeals for the Second Circuit reversed the District Court's order certifying the proposed classes. On September 27, 2007, plaintiffs filed a motion to certify modified classes, which defendants opposed. On October 10, 2008, the District Court granted plaintiffs' request to withdraw without prejudice their class certification motion. The parties agreed to settle the matter in an amount that is not material to the Corporation's Consolidated Financial Statements and, on October 5, 2009, the District Court granted final approval of the settlement. Certain objectors to the settlement have filed an appeal of the District Court's certification of the settlement class to the U.S. Court of Appeals for the Second Circuit.
Interchange and Related Litigation
The Corporation, BANA, BA Merchant Services LLC (f/k/a National Processing, Inc.) and MBNA America Bank, N.A. are defendants in putative class actions filed on behalf of retail merchants that accept Visa and MasterCard payment cards. Additional defendants include Visa, MasterCard, and other financial institutions. Plaintiffs seeking unspecified treble damages and injunctive relief, allege that the defendants conspired to fix the level of interchange and merchant discount fees and that certain other practices, including various Visa and MasterCard rules, violate
federal and California antitrust laws. The class actions, the first of which was filed on June 22, 2005, are coordinated for pre-trial proceedings in the U.S. District Court for the Eastern District of New York, together with individual actions brought only against Visa and MasterCard, under the caption In Re Payment Card Interchange Fee and Merchant Discount Anti-Trust Litigation . On January 8, 2008, the District Court dismissed all claims for pre-2004 damages. On May 8, 2008, plaintiffs filed a motion for class certification, which the defendants opposed. On January 29, 2009, the class plaintiffs filed a second amended consolidated complaint.
The class plaintiffs have also filed two supplemental complaints against certain defendants, including the Corporation, BANA, BA Merchant Services LLC (f/k/a National Processing, Inc.) and MBNA America Bank, N.A., relating to MasterCard's 2006 initial public offering (MasterCard IPO) and Visa's 2008 initial public offering (Visa IPO). The supplemental complaints, which seek unspecified treble damages and injunctive relief, assert, among other things, claims under federal antitrust laws. On November 25, 2008, the District Court granted defendants' motion to dismiss the supplemental complaint relating to the MasterCard IPO, with leave to amend. On January 29, 2009, plaintiffs amended the MasterCard IPO supplemental complaint and also filed a supplemental complaint relating to the Visa IPO.
Defendants have filed motions to dismiss the second amended consolidated complaint and the MasterCard IPO and Visa supplemental complaints.
The Corporation and certain of its affiliates have entered into agreements with Visa and other financial institutions that provide for sharing liabilities in connection with certain antitrust litigation against Visa, including the Interchange case (the Visa-Related Litigation). Under these agreements, the Corporation's obligations to Visa in the Visa-Related Litigation are capped at the Corporation's membership interest in Visa USA, which currently is 12.9 percent. Under these agreements, Visa Inc. placed a portion of the proceeds from the Visa IPO into an escrow to fund liabilities arising from the Visa-Related Litigation, including the 2008 settlement of Discover Financial Services v. Visa USA, et al . and the 2007 settlement of American Express Travel Related Services Company v. Visa USA, et al . Since the Visa IPO, Visa Inc. has added funds to the escrow, which has the effect of repurchasing Visa Inc. Class A common stock equivalents from the Visa USA members, including the Corporation.
Lehman Brothers Holdings, Inc. Litigation
Beginning in September 2008, BAS, MLPF&S, CSC and LaSalle Financial Services Inc., along with other underwriters and individuals, were named as defendants in several putative class action complaints filed in the U.S. District Court for the Southern District of New York and state courts in Arkansas, California, New York and Texas. Plaintiffs allege that the underwriter defendants violated Sections 11 and 12 of the Securities Act of 1933 by making false or misleading disclosures in connection with various debt and convertible stock offerings of Lehman Brothers Holdings, Inc. and seek unspecified damages. All cases against the defendants have now been transferred or conditionally transferred to the multi-district litigation captioned In re Lehman Brothers Securities and ERISA Litigation pending in the U.S. District Court for the Southern District of New York. BAS, MLPF&S and other defendants moved to dismiss the consolidated amended complaint.
Lehman Set-off Litigation
On November 26, 2008, BANA commenced an adversary proceeding against Lehman Brothers Holdings, Inc. (LBHI) and Lehman Brothers Special Financing, Inc. (LBSF) in LBHI's and LBSF's Chapter 11 bankruptcy proceedings in the U.S. Bankruptcy Court for the Southern District
| 164 | Bank of America 2009 |
of New York. In the adversary proceeding, BANA is seeking a declaration that it properly set-off funds held in Lehman deposit accounts against monies owed to BANA by LBSF and LBHI under various derivatives and guarantee agreements. LBSF and LBHI answered the complaint, and LBHI filed counterclaims against BANA and Bank of America Trust and Banking Corporation (Cayman) Limited (BofA Cayman) on January 2, 2009, alleging that BANA's set-off was improper and violated the automatic stay in bankruptcy. LBHI's counterclaims sought among other relief, the return of the set-off funds. BANA and BofA Cayman filed their answer to LBHI's counterclaims, which denied the material allegations of the counterclaims, on February 9, 2009. On July 23, 2009, LBHI voluntarily dismissed its counterclaims against BofA Cayman, but BANA remains a defendant. On September 14, 2009, LBHI, LBSF and BANA submitted cross-motions for summary judgment.
Lyondell Litigation
On July 23, 2009, an adversary proceeding, entitled Official Committee of Unsecured Creditors v. Citibank, N.A., et al ., was filed in the U.S. Bankruptcy Court for the Southern District of New York. This adversary proceeding, in which MLPF&S, Merrill Lynch Capital Corporation and more than 50 other individuals and entities were named as defendants, relates to ongoing Chapter 11 bankruptcy proceedings in In re Lyondell Chemical Company, et al . The plaintiff in the adversary proceeding, the Official Committee of Unsecured Creditors of Lyondell Chemical Company (the Committee), alleged in its complaint that certain loans made and liens granted in connection with the December 20, 2007 merger between Lyondell Chemical Company and Basell AF S.C.A. were avoidable fraudulent transfers under state and federal fraudulent transfer laws. MLPF&S is named as a defendant in its capacity as: (i) a joint lead arranger under a senior credit facility and individually as lender thereunder; and (ii) a joint lead arranger under a bridge loan facility and individually as lender thereunder. Merrill Capital Corporation is named as a defendant in its capacity as: (i) a joint lead arranger under the senior credit facility and individually as lender thereunder; and (ii) administrative agent under the bridge loan facility. The Committee sought both to avoid the obligations under the loans made under the facilities and to recover fees and interest paid in connection therewith. The Committee also sought unspecified damages from MLPF&S for allegedly aiding and abetting a breach of fiduciary duty in connection with its role as advisor to Basell's parent company, Access Industries.
On October 1, 2009, a second adversary proceeding, entitled The Wilmington Trust Co. v. LyondellBasell Industries AF S.C.A., et al ., was filed in the U.S. Bankruptcy Court for the Southern District of New York. This adversary proceeding, in which MLPF&S, Merrill Lynch Capital Corporation and Merrill Lynch International Bank Limited (MLIB) along with more than 70 other entities are named defendants, was filed by the successor trustee for holders of certain Lyondell senior notes, and asserts causes of action for declaratory judgment, breach of contract, and equitable subordination. The complaint alleges that the 2007 leveraged buyout of Lyondell violated a 2005 intercreditor agreement executed in connection with the August 2005 issuance of the Lyondell senior notes and therefore asks the Bankruptcy Court to declare the 2007 intercreditor agreement, and specifically the debt priority provisions contained therein, null and void. The breach of contract action, brought against Merrill Lynch Capital Corporation and one other entity as signatories to the 2005 intercreditor agreement, seeks unspecified damages. The equitable subordination action is brought against all defendants and seeks to subordinate the bankruptcy claims of those defendants to the claims of the holders of the Lyondell senior notes. A motion to dismiss this complaint was filed.
On February 16, 2010, certain defendants, including MLPF&S, Merrill Lynch Capital Corporation and MLIB, advised the Bankruptcy Court that
they have reached a settlement in principal with the Lyondell debtors in bankruptcy, the Committee and Wilmington Trust that would dispose of all claims asserted against MLPF&S, Merrill Lynch Capital Corporation and MLIB in these adversary proceedings. This settlement is not material to the Corporation's Consolidated Financial Statements and is subject to Bankruptcy Court approval.
MBIA Insurance Corporation CDO Litigation
On April 30, 2009, MBIA and LaCrosse Financial Products, LLC filed a complaint against MLPF&S and Merrill Lynch International, entitled MBIA Insurance Corporation and LaCrosse Financial Products LLC, v. Merrill Lynch Pierce Fenner & Smith, Inc., et al ., in New York Supreme Court, New York County. The complaint relates to certain credit default swap (CDS) agreements and insurance agreements by which plaintiffs provided credit protection to the Merrill Lynch entities and other parties on certain CDO securities held by them. Plaintiffs claim that the Merrill Lynch entities did not adequately disclose the credit quality and other risks of the CDO securities and underlying collateral. The complaint alleges claims for fraud, negligent misrepresentation and breach of contract, among other claims, and seeks rescission and unspecified compensatory and punitive damages, among other relief. Defendants filed a motion to dismiss on July 1, 2009.
Mediafiction Litigation
Approximately a decade ago, MLIB acted as manager for a $284 million issuance of notes for an Italian library of movies, backed by the future flow of receivables to such movie rights. Mediafiction S.p.A (Mediafiction) was responsible for collecting payments in connection with the rights to the movies and forwarding the payments to MLIB for distribution to note holders. Mediafiction failed to make the required payments to MLIB and a declaration of bankruptcy under Italian law was made with respect to Mediafiction on March 9, 2006. On July 18, 2006, MLIB filed an opposition to have its claims recognized in the Mediafiction bankruptcy proceeding for amounts that Mediafiction failed to pay on the notes. Thereafter, Mediafiction filed a counterclaim alleging that the agreement between MLIB and Mediafiction was null and void and seeking return of the payments previously made by Mediafiction to MLIB. In October 2008, the Court of Rome granted Mediafiction's counter claim against MLIB in the amount of $137 million. MLIB has appealed the ruling to the Court of Appeals of the Court of Rome.
Merrill Lynch Acquisition-related Matters
Since January 2009, the Corporation and certain of its current and former officers and directors, among others, have been named as defendants in putative class actions, referred to as the securities actions, brought by shareholders alleging violations of federal securities laws in connection with certain public statements and the proxy statement with respect to the Corporation's acquisition of Merrill Lynch (the Acquisition). Several of these actions have been consolidated and a consolidated amended class action complaint has been filed in the U.S. District Court for the Southern District of New York, as described below.
In addition, several derivative actions, referred to as the derivative actions, have been filed against certain current and former directors and officers of the Corporation, and certain other parties, and the Corporation as nominal defendant, in the federal and state courts, as described below.
Other putative class actions, referred to as the ERISA actions, have been filed in the U.S. District Court for the Southern District of New York against the Corporation and certain of its current and former officers and directors seeking recovery for losses from the Bank of America 401(k) Plan pursuant to ERISA and a consolidated amended class action com -
| Bank of America 2009 | 165 |
plaint in these ERISA actions has been filed, as described below.
In Re Bank of America Securities, Derivative & ERISA Litigation
On June 10, 2009, the MDL Panel issued an order transferring the actions related to the Acquisition pending in federal courts outside the U.S. District Court for the Southern District of New York for coordinated or consolidated pretrial proceedings with the securities actions, ERISA actions, and derivative actions pending in the U.S. District Court for the Southern District of New York. The securities actions, ERISA actions and derivative actions have been separately consolidated and are now pending under the caption In re Bank of America Securities, Derivative, and Employment Retirement Income Security Act (ERISA) Litigation .
On September 25, 2009, plaintiffs in the securities actions in the In re Bank of America Securities, Derivative and Employment Retirement Income Security Act (ERISA) Litigation filed a consolidated amended class action complaint. The amended complaint is brought on behalf of a purported class, which consists of purchasers of the Corporation's common and preferred securities between September 15, 2008 and January 21, 2009, holders of the Corporation's common stock or Series B Preferred Stock as of October 10, 2008 and purchasers of the Corporation's common stock issued in the offering that occurred on or about October 7, 2008, and names as defendants the Corporation, Merrill Lynch and certain of their current and former directors, officers and affiliates. The amended complaint alleges violations of Sections 10(b), 14(a) and 20(a) of the Securities Exchange Act of 1934, and SEC rules promulgated thereunder, based on, among other things, alleged false statements and omissions related to: (i) the financial condition and 2008 fourth quarter losses experienced by the Corporation and Merrill Lynch; (ii) due diligence conducted in connection with the Acquisition; (iii) bonus payments to Merrill Lynch employees; and (iv) the Corporation's contacts with government officials regarding the Corporation's consideration of invoking the material adverse change clause in the merger agreement and the possibility of obtaining government assistance in completing the Acquisition. The amended complaint also alleges violations of Sections 11, 12(a)(2) and 15 of the Securities Act of 1933 related to an offering of the Corporation's common stock announced on or about October 6, 2008, and based on, among other things, alleged false statements and omissions related to bonus payments to Merrill Lynch employees and the benefits and impact of the Acquisition on the Corporation, and names BAS and MLPF&S, among others, as defendants on the Section 11 and 12(a)(2) claims. The amended complaint seeks unspecified damages and other relief. On November 24, 2009, the Corporation, BAS, Merrill Lynch, MLPF&S and the officer and director defendants moved to dismiss the consolidated amended class action complaint.
On October 9, 2009, plaintiffs in the derivative actions in the In re Bank of America Securities, Derivative and Employment Retirement Income Security Act (ERISA) Litigation filed a consolidated amended derivative and class action complaint. The amended complaint names as defendants certain of the Corporation's current and former directors, officers and financial advisors, and certain of Merrill Lynch's current and former directors and officers. The amended complaint alleges, among other things, that: (i) certain of the Corporation's officers breached fiduciary duties by conducting an inadequate due diligence process surrounding the Acquisition, failing to make adequate disclosures regarding Merrill Lynch's 2008 fourth quarter losses and an alleged agreement to permit Merrill Lynch to pay bonuses, and failing to invoke the material adverse change clause or otherwise renegotiate the Acquisition; (ii) certain of the Corporation's officers and certain Merrill Lynch officers received incentive compensation that was inappropriate in view of the work performed and the results achieved and, therefore, that such person should return unearned compensation; (iii) certain of the Corporation's officers and
directors exposed the Corporation to significant liability under state and federal law and should be held responsible to the Corporation for contribution; (iv) certain Merrill Lynch officers and directors and certain financial advisors to the Corporation aided and abetted breaches of fiduciary duties by causing and/or assisting with the consummation of the Acquisition; and (v) certain of the Corporation's officers and directors, certain of the Merrill Lynch officers and directors and certain of the Corporation's financial advisors violated Section 14(a) of the Securities Exchange Act of 1934 and Rule 14a-9 promulgated thereunder by allegedly making material misrepresentations and/or material omissions in the proxy statement for the Acquisition and related materials and failing to update those materials to reflect, among other things, Merrill Lynch's 2008 fourth quarter losses and Merrill Lynch's ability and intention to pay bonuses to its employees in 2008. The amended complaint also purports to bring a direct class action claim for breach of a duty of full disclosure and complete candor by failing to correct or update disclosures made in the proxy statement for the Acquisition and for concealing an alleged agreement authorizing Merrill Lynch to pay bonuses. The direct claim is brought on behalf of a purported class of all persons who owned shares of the Corporation's common stock as of October 10, 2008 and is brought against certain of the Corporation's current and former officers and directors. The Corporation is named as a nominal defendant with respect to the derivative claims and is not named as a defendant in the direct class action claim. The amended complaint seeks an unspecified amount of monetary damages, equitable remedies, and other relief. On December 8, 2009, the Corporation, the officer and director defendants and the financial advisors moved to dismiss the consolidated amended derivative and class complaint. On February 8, 2010, the plaintiffs voluntarily dismissed their claims against each of the former Merrill Lynch officers and directors without prejudice.
On October 9, 2009, plaintiffs in the ERISA actions in the In re Bank of America Securities, Derivative and Employment Retirement Income Security Act (ERISA) Litigation filed a consolidated amended complaint for breaches of duty under ERISA. The amended complaint is brought on behalf of a purported class that consists of participants in the Corporation's 401(k) Plan, the Corporation's 401(k) Plan for Legacy Companies, the Countrywide Financial Corporation 401(k) Plan (collectively the 401(k) Plans), and the Corporation's Pension Plan. The amended complaint names as defendants the Corporation, members of the Corporation's Corporate Benefits Committee, members of the Compensation and Benefits Committee of the Corporation's Board of Directors and certain of the Corporation's current and former directors and officers. The amended complaint alleges violations of ERISA, based on, among other things: (i) an alleged failure to prudently and loyally manage the 401(k) Plans and Pension Plan by continuing to offer the Corporation's common stock as an investment option or measure for participant contributions; (ii) an alleged failure to monitor the fiduciaries of the 401(k) Plans and Pension Plan; (iii) an alleged failure to provide complete and accurate information to the 401(k) Plans and Pension Plan participants with respect to the Merrill Lynch and Countrywide acquisitions and related matters; and (iv) alleged co-fiduciary liability for these purported fiduciary breaches. The amended complaint seeks an unspecified amount of monetary damages, equitable remedies, and other relief. On December 8, 2009, the Corporation and the officer and director defendants moved to dismiss the consolidated amended complaint.
Other Acquisition-related Litigation
Since January 21, 2009, the Corporation and certain of its current and former directors have been named as defendants in several putative class and derivative actions, including Rothbaum v. Lewis, Southeastern Pennsylvania Transportation Authority v. Lewis, Tremont Partners LLC v.
| 166 | Bank of America 2009 |
Lewis, Kovacs v. Lewis, Stern v. Lewis, and Houx v. Lewis , brought by shareholders in the Delaware Court of Chancery alleging breaches of fiduciary duties in connection with the Acquisition. On April 27, 2009, the Delaware Court of Chancery consolidated the derivative actions under the caption In re Bank of America Corporation Stockholder Derivative Litigation. On April 30, 2009, the putative class claims in the actions, entitled Stern v. Lewis and Houx v. Lewis , were voluntarily dismissed without prejudice by order of the Chancery Court. On May 8, 2009, plaintiffs filed an amended consolidated complaint in the Chancery Court, asserting claims derivatively on behalf of the Corporation that the defendants breached their fiduciary duty of loyalty by, among other things, failing to make adequate disclosures regarding Merrill Lynch's 2008 fourth quarter losses and bonuses paid to Merrill Lynch employees in 2008 and breached their fiduciary duty of loyalty and committed waste by failing to invoke the material adverse change clause in the merger agreement or otherwise renegotiate the Acquisition. The amended consolidated complaint seeks damages sustained as a result of the alleged wrongdoing, disgorgement of bonuses paid to the defendants and to the Corporation's management team or to former Merrill Lynch executives, as well as attorneys' fees and costs and other equitable relief. On June 19, 2009, the Corporation and the individual defendants filed motions to dismiss. On October 12, 2009, the Chancery Court denied defendants' motions to dismiss.
On February 17, 2009, an additional derivative action, entitled Cunniff v. Lewis, et al. , was filed in North Carolina Superior Court. The complaint, which names certain of the Corporation's current and former officers and directors as defendants and names the Corporation as a nominal defendant, alleges that defendants violated fiduciary duties in connection with the Acquisition by, among other things, failing to disclose: (i) the financial condition and 2008 fourth quarter losses experienced by Merrill Lynch and (ii) the extent of the due diligence conducted in connection with the Acquisition. The complaint also brings a cause of action for waste of corporate assets for, among other things, allegedly subjecting the Corporation to potential material liability for securities fraud. The complaint seeks unspecified damages and other relief. On October 6, 2009, the Superior Court granted defendants' motion to stay the action in favor of derivative actions pending in the Delaware Court of Chancery.
On September 25, 2009, an alleged shareholder of the Corporation filed an action against the Corporation, and its then Chief Executive Officer in Superior Court of the State of California, San Francisco County. The complaint alleges state law causes of action for breach of fiduciary duty, misrepresentation and fraud in connection with plaintiff's purchase of the Corporation's common stock, based on alleged failures to disclose information regarding Merrill Lynch's value. The action, entitled Catalano v. Bank of America , seeks unspecified damages and other relief. Defendants have removed the action to the U. S. District Court for the Northern District of California, and have requested that the MDL Panel transfer the action to the U.S. District Court for the Southern District of New York for coordinated or consolidated pre-trial proceedings with the related litigation pending in that Court. On December 11, 2009, defendants removed the action to the U.S. District Court for the Northern District of California. On February 5, 2010, the MDL Panel transferred the action to the U.S. District Court for the Southern District of New York for coordinated or consolidated pre-trial proceedings with the related litigation pending in that Court.
On December 22, 2009, the Corporation and certain of its officers were named in a purported class action filed in the U.S. District Court for the Southern District of New York, entitled Iron Workers of Western Pennsylvania Pension Plan v. Bank of America Corp., et al . The action is purportedly brought on behalf of all persons who purchased or acquired certain Corporation debt securities between September 15, 2008 and January 21, 2009 and alleges that defendants violated Sections 10(b)
and 20(a) of the Securities Exchange Act of 1934, and SEC rules promulgated thereunder, based on, among other things, alleged false statements and omissions related to: (i) the financial condition and 2008 fourth quarter losses experienced by the Corporation and Merrill Lynch; (ii) due diligence conducted in connection with the Acquisition; (iii) bonus payments to Merrill Lynch employees; and (iv) certain defendants' contacts with government officials regarding the Corporation's consideration of invoking the material adverse change clause in the merger agreement and the possibility of obtaining additional government assistance in completing the Acquisition. The complaint seeks unspecified damages and other relief. The parties in the securities actions in the In re Bank of America Securities, Derivative and Employment Retirement Income Security Act (ERISA) Litigation have requested that the District Court consolidate this action with their actions.
On January 13, 2010, the Corporation, Merrill Lynch and certain of the Corporation's current and former officers and directors were named in a purported class action filed in the U.S. District Court for the Southern District of New York entitled Dornfest v. Bank of America Corp., et al. The action is purportedly brought on behalf of investors in Corporation option contracts between September 15, 2008 and January 22, 2009 and alleges that during the class period approximately 9.5 million Corporation call option contracts and approximately eight million Corporation put option contracts were already traded on seven of the Options Clearing Corporation exchanges. The complaint alleges that defendants violated Sections 10(b) and 20(a) of the Securities Exchange Act of 1934, and SEC rules promulgated thereunder, based on, among other things, alleged false statements and omissions related to: (i) the financial condition and 2008 fourth quarter losses experienced by the Corporation and Merrill Lynch; (ii) due diligence conducted in connection with the Acquisition; (iii) bonus payments to Merrill Lynch employees; and (iv) certain defendants' contacts with government officials regarding the Corporation's consideration of invoking the material adverse change clause in the merger agreement and the possibility of obtaining additional government assistance in completing the Acquisition. The plaintiff class allegedly suffered damages because they invested in Corporation option contracts at allegedly artificially inflated prices and were adversely affected as the artificial inflation was removed from the market price of the securities. The complaint seeks unspecified damages and other relief. Plaintiffs in the securities actions in the In re Bank of America Securities, Derivative and Employment Retirement Income Security Act (ERISA) Litigation have requested that the District Court consolidate this action with their actions.
On February 17, 2010, an alleged shareholder of the Corporation filed a purported derivative action, entitled Bahnmeier v. Lewis, et al ., in the U.S. District Court for the Southern District of New York. The complaint names as defendants certain of the Corporation's current and former directors and officers, and one of Merrill Lynch's former officers. The complaint alleges, among other things, that the individual defendants breached their fiduciary duties by failing to provide accurate and complete information to shareholders regarding, among other things: (i) the potential for litigation resulting from Countrywide's lending practices and the risk posed to the Corporation's capital levels as a result of Countrywide's loan losses; (ii) the deterioration of Merrill Lynch's financial condition during the fourth quarter of 2008, which was allegedly sufficient to trigger the material adverse change clause in the merger agreement with Merrill Lynch; (iii) the agreement to permit Merrill Lynch to pay up to $5.8 billion in bonuses to its employees; and (iv) the discussions with regulators in December 2008 concerning possibly receiving additional government assistance in completing the Acquisition. The complaint also asserts claims against the individual defendants for breach of fiduciary duty by failing to maintain adequate internal controls, unjust enrichment, abuse
| Bank of America 2009 | 167 |
of control and gross mismanagement in connection with the supervision and management of the operations, business and disclosure controls of the Corporation. The Corporation is named as a nominal defendant only and no monetary relief is sought against it. The complaint seeks, among other things, an unspecified amount of monetary damages, equitable remedies and other relief.
Regulatory Matters
The Corporation and Merrill Lynch have also received and are responding to inquiries from a variety of regulators and governmental authorities relating to among other things: (i) the payment by Merrill Lynch of bonuses for 2008 and disclosures related thereto; (ii) disclosures relating to Merrill Lynch's losses in the fourth quarter of 2008; (iii) disclosures relating to the Corporation's consideration of whether there had been a material adverse change relating to Merrill Lynch and discussions with U.S. government officials in late December 2008; and (iv) the Acquisition and related proxy statement.
On August 3, 2009, the SEC filed a complaint against the Corporation, entitled SEC v. Bank of America , in the U.S. District Court for the Southern District of New York, alleging that the Corporation's proxy statement filed on November 3, 2008 failed to disclose the discretionary incentive compensation that Merrill Lynch could award to its employees prior to completion of the Acquisition. On September 14, 2009, the District Court declined to approve a proposed consent judgment agreed to by the Corporation and the SEC. On October 9, 2009, the Corporation's Board of Directors approved a limited waiver of the Corporation's attorney-client and attorney work product privileges as to certain subject matters under investigation by the U.S. Congress, and federal and state regulatory authorities.
On January 12, 2010, the SEC filed a second complaint against the Corporation, entitled SEC v. Bank of America Corp. , in the U.S. District Court for the Southern District of New York alleging that the Corporation violated the federal proxy rules for failing to disclose information concerning Merrill Lynch's known and estimated losses prior to the shareholder vote on December 5, 2008, to approve the Acquisition. The SEC alleges that the Corporation was required to describe in its proxy and registration statement any material changes in Merrill Lynch's affairs that were not already reflected in Merrill Lynch's quarterly reports or certain other public filings, and to update shareholders on any "fundamental change" arising after the effective date of the registration statement. The SEC alleges that the Corporation's failure to provide such an update violated Section 14(a) of the Securities Exchange Act of 1934 and Rule 14a-9 thereunder. The SEC is seeking an injunction against the Corporation to prohibit any future violations of Section 14(a) and Rule 14a-9, as well as an unspecified civil monetary penalty.
On February 1, 2010, the Corporation entered into a proposed settlement with the SEC to resolve all cases filed by the SEC relating to the Acquisition. Also, on February 4, 2010, the Corporation entered into an agreement with the Office of the Attorney General for the State of North Carolina (NC AG) to resolve all matters that are the subject of an investigation by that Office relating to the Acquisition. Under the terms of the proposed settlements, the Corporation agreed, without admitting or denying any wrongdoing, to pay $150 million as a civil penalty to be distributed to former Bank of America shareholders as part of the SEC's Fair Fund program and a payment of $1 million to be made to the NC AG for its consumer protection purposes. The payment to the NC AG is not a penalty or a fine. As part of the settlements, the Corporation also agreed to implement a number of additional undertakings for a period of three years, including: engaging an independent auditor to perform an assessment and provide an attestation report on the effectiveness of the Corporation's disclosure controls and procedures; furnishing management
certifications signed by the CEO and CFO with respect to proxy statements; retaining disclosure counsel to the Audit Committee of the Corporation's Board; adopting independence requirements beyond those already applicable for all members of the Compensation and Benefits Committee of the Board; continuing to retain an independent compensation consultant to the Compensation and Benefits Committee; implementing and disclosing written incentive compensation principles on the Corporation's website and providing the Corporation's shareholders with an advisory vote concerning any proposed changes to such principles; and providing the Corporation's shareholders with an annual "say on pay" advisory vote regarding the compensation of senior executives. These proposed undertakings may be amended or modified in light of any new regulation or requirement that comes into effect during the three-year period and is applicable to the Corporation with respect to the same subject matter. On February 22, 2010, the District Court approved the settlement subject to the Corporation and the SEC making certain modifications to the settlement to require agreement between the SEC and the Corporation on the selection of the independent auditor and disclosure counsel and to clarify certain issues regarding the distribution of the civil penalty. The parties made the modifications and on February 24, 2010, the District Court entered the Consent Judgment encompassing the settlement terms.
On February 4, 2010, the Office of the New York State Attorney General (NY AG) filed a civil complaint in the Supreme Court of New York State, entitled People of the State of New York v. Bank of America, et al . The complaint names as defendants the Corporation and the Corporation's former chief executive and chief financial officers, Kenneth D. Lewis, and Joseph L. Price, and alleges violations of Sections 352, 352-c(1)(a), 352-c(1)(c), and 353 of the New York General Business Law, commonly known as the Martin Act, and Section 63(12) of the New York Executive Law. The complaint is based on, among other things, alleged false statements and omissions and fraudulent practices related to: (i) the disclosure of Merrill Lynch's financial condition and its interim and projected losses during the fourth quarter of 2008; (ii) the Corporation's contacts with federal government officials regarding the Corporation's consideration of invoking the material adverse effect clause in the merger agreement and the possibility of obtaining additional government assistance; (iii) the disclosure of the payment and timing of year-end incentive compensation to Merrill Lynch employees; and (iv) public statements regarding the due diligence conducted in connection with the Acquisition and positive statements regarding the Acquisition. The complaint seeks an unspecified amount in disgorgement, penalties, restitution, and damages and other equitable relief.
Merrill Lynch Subprime-related Matters
Louisiana Sheriffs' Pension & Relief Fund v. Conway, et al.
On October 3, 2008, a putative class action was filed against Merrill Lynch, Merrill Lynch Capital Trust I, Merrill Lynch Capital Trust II, Merrill Lynch Capital Trust III, MLPF&S (collectively the Merrill Lynch entities), and certain present and former Merrill Lynch officers and directors, and underwriters, including BAS, in New York Supreme Court, New York County. The complaint seeks relief on behalf of all persons who purchased or otherwise acquired debt securities issued by the Merrill Lynch entities pursuant to a shelf registration statement dated March 31, 2006. The complaint alleged that prospectuses misstated the financial condition of the Merrill Lynch entities and failed to disclose their exposure to losses from investments tied to subprime and other mortgages, as well as their liability arising from its participation in the ARS market. On October 22, 2008, the action was removed to the U.S. District Court for the Southern District of New York and on November 5, 2008 it was accepted as a
| 168 | Bank of America 2009 |
related case to In re Merrill Lynch & Co., Inc. Securities, Derivative, and ERISA Litigation . On April 21, 2009, the parties reached an agreement in principle to settle the Louisiana Sheriff's matter in an amount that is not material to the Corporation's Consolidated Financial Statements and dismiss all claims with prejudice. On November 30, 2009, the U.S. District Court for the Southern District of New York granted final approval of the settlement.
Connecticut Carpenters Pension Fund, et al. v. Merrill Lynch & Co., Inc., et al.; Iron Workers Local No. 25 Pension Fund v. Credit-Based Asset Servicing and Securitization LLC, et al.; Public Employees' Ret. System of Mississippi v. Merrill Lynch & Co. Inc. et al.; Wyoming State Treasurer v. Merrill Lynch & Co. Inc.
Beginning in December 2008, Merrill Lynch affiliated entities, including Merrill Lynch Mortgage Investors, Inc., and officers and directors of Merrill Lynch Mortgage Investors, Inc., and others were named in four putative class actions arising out of the underwriting and sale of more than $55 billion of MBS. The complaints alleged, among other things, that the relevant registration statements and accompanying prospectuses or prospectus supplements misrepresented or omitted material facts regarding the underwriting standards used to originate the mortgages in the mortgage pools underlying the MBS, the process by which the mortgage pools were acquired, and the appraisals of the homes secured by the mortgages. Plaintiffs seek to recover alleged losses in the market value of the MBS allegedly caused by the performance of the underlying mortgages or to rescind their purchases of the MBS. These cases were consolidated under the caption Public Employees' Ret. System of Mississippi v. Merrill Lynch & Co. Inc . and, on May 20, 2009, a consolidated amended complaint was filed. On June 17, 2009, all defendants filed a motion to dismiss the consolidated amended complaint.
Federal Home Loan Bank of Seattle Litigation
On December 23, 2009, FHLB Seattle filed a complaint, entitled Federal Home Loan Bank of Seattle v. Merrill Lynch, Pierce, Fenner & Smith, Inc., et al ., in the Superior Court of Washington for King County against MLPF&S, Merrill Lynch Mortgage Investors, Inc., and Merrill Lynch Mortgage Capital, Inc. The complaint alleges violations of the Securities Act of Washington in connection with the offering of various MBS and asserts, among other things, misstatements and omissions concerning the credit quality of the mortgage loans underlying the MBS and the loan origination practices associated with those loans. The complaint seeks rescission, interest, costs and attorneys' fees.
Merrill Lynch & Co., Inc. is cooperating with the SEC and other governmental authorities investigating subprime mortgage-related activities.
Montgomery
On January 19, 2010, a putative class action entitled Montgomery v. Bank of America, et al. , was filed in the U.S. District Court for the Southern District of New York against the Corporation, BAS, MLPF&S and a number of its current and former officers and directors on behalf of all persons who acquired certain preferred stock offered pursuant to a shelf registration statement dated May 5, 2006, specifically two offerings dated January 24, 2008 and another dated May 20, 2008. The Montgomery complaint asserts claims under Sections 11, 12(a)(2), and 15 of the Securities Act of 1933, and alleges that the prospectus supplements associated with the offerings: (i) failed to disclose that the Corporation's loans, leases, CDOs, and commercial MBS were impaired to a greater extent than disclosed; (ii) misrepresented the extent of the impaired assets by failing to establish adequate reserves or properly record losses for its impaired assets; and (iii) misrepresented the adequacy of the Corporation's internal controls, and the Corporation's capital base in light of the alleged impairment of its assets.
Municipal Derivatives Matters
The Antitrust Division of the DOJ, the SEC, and the Internal Revenue Service (IRS) are investigating possible anticompetitive bidding practices in the municipal derivatives industry involving various parties, including
BANA, dating back to the early 1990s. The activities at issue in these industry-wide government investigations concern the bidding process for municipal derivatives that are offered to states, municipalities and other issuers of tax-exempt bonds. The Corporation has cooperated, and continues to cooperate, with the DOJ, the SEC and the IRS. On January 11, 2007, the Corporation entered into a Corporate Conditional Leniency Letter (the Letter) with DOJ. Under the Letter and subject to the Corporation's continuing cooperation, the DOJ will not bring any criminal antitrust prosecution against the Corporation in connection with the matters that the Corporation reported to DOJ. Subject to satisfying the DOJ and the court presiding over any civil litigation of the Corporation's cooperation, the Corporation is eligible for: (i) a limit on liability to single, rather than treble, damages in certain types of related civil antitrust actions; and (ii) relief from joint and several antitrust liability with other civil defendants.
On February 4, 2008, BANA received a Wells notice advising that the SEC staff is considering recommending that the SEC bring a civil injunctive action and/or an administrative proceeding against BANA "in connection with the bidding of various financial instruments associated with municipal securities." An SEC action or proceeding could seek a permanent injunction, disgorgement plus prejudgment interest, civil penalties and other remedial relief. Merrill Lynch is also being investigated by the SEC and the DOJ concerning bidding practices in the municipal derivatives industry.
Beginning in March 2008, the Corporation, BANA and other financial institutions, including Merrill Lynch, have been named as defendants in complaints filed in federal courts in the District of Columbia, New York and elsewhere. Plaintiffs in those cases purport to represent classes of government and private entities that purchased municipal derivatives from defendants. The complaints allege that defendants conspired to allocate customers and fix or stabilize the prices of certain municipal derivatives from 1992 through the present. The plaintiffs' complaints seek unspecified damages, including treble damages. These lawsuits were consolidated for pre-trial proceedings in the In re Municipal Derivatives Antitrust Litigation , pending in the U.S. District Court for the Southern District of New York. BANA, BAS, Merrill Lynch and other financial institutions have also been named in several related individual suits originally filed in California state courts on behalf of a number of cities and counties in California and asserting state law causes of action. All of these cases have been removed to the U.S. District Court for the Southern District of New York and are now part of In re Municipal Derivatives Antitrust Litigation . The amended complaints filed in these actions continue to allege a substantially similar conspiracy and now assert violations of the Sherman Act and California's Cartwright Act. Six individual actions have been filed in the U.S. District Courts for the Eastern and Central Districts of California. All of these cases allege a substantially similar conspiracy and violations of the Sherman and Cartwright Acts, and seek unspecified damages, and in some cases, treble damages. All six cases are in the process of being transferred for consolidation in the In re Municipal Derivatives Antitrust Litigation.
On September 3, 2009, BANA was sued by the West Virginia Attorney General on behalf of the State of West Virginia for the same conspiracy alleged in the In re Municipal Derivatives Antitrust Litigation . The suit was originally filed in the Circuit Court of Mason County, West Virginia. BANA removed the case to the U.S. District Court for the Southern District of West Virginia (Huntington Division). The State's motion to remand is fully briefed. Upon removal, BANA noticed the State's case as a tag-along action subject to transfer by the MDL Panel. The MDL Panel has issued a Conditional Transfer Order transferring the action to the U.S. District Court for the Southern District of New York. The State objected and filed a motion to vacate. That motion was denied on February 2, 2010.
Beginning in April 2008, the Corporation and BANA received subpoenas, interrogatories and/or civil investigative demands from a number of state attorneys general requesting documents and information regarding municipal derivatives transactions from 1992 through the present.
| Bank of America 2009 | 169 |
The Corporation and BANA are cooperating with the state attorneys general.
Ocala Litigation
On November 25, 2009, BANA was named as a defendant in two related lawsuits filed in the U.S. District Court for the Southern District of New York. In BNP Paribas Mortgage Corporation v. Bank of America, N.A. and Deutsche Bank, AG v. Bank of America, N.A. , plaintiffs assert breach of contract, negligence and indemnification claims in connection with BANA's roles as, among other things, collateral agent, custodian and indenture trustee of Ocala Funding, LLC (Ocala). Ocala was a mortgage warehousing facility that provided funding to Taylor, Bean & Whitaker Mortgage Corp. (TBW) by issuing commercial paper and term securities backed by mortgage loans originated by TBW. Plaintiffs claim that they purchased in excess of $1.6 billion in securities issued by Ocala and that BANA allegedly failed, among other things, to protect the collateral backing plaintiffs' securities. Plaintiffs seek unspecified compensatory damages, among other relief. On February 4, 2010, BANA moved to dismiss the complaints.
Parmalat Finanziaria S.p.A. Matters
On December 24, 2003, Parmalat Finanziaria S.p.A. (Parmalat) was admitted into insolvency proceedings in Italy, known as "extraordinary administration." The Corporation, through certain of its subsidiaries, including BANA, provided financial services and extended credit to Parmalat and its related entities. On June 21, 2004, Extraordinary Commissioner Dr. Enrico Bondi filed with the Italian Ministry of Production Activities a plan of reorganization for the restructuring of the companies of the Parmalat group that are included in the Italian extraordinary administration proceeding. In July 2004, the Italian Ministry of Production Activities approved the Extraordinary Commissioner's restructuring plan, as amended, for the Parmalat group companies that are included in the Italian extraordinary administration proceeding. This plan was approved by the voting creditors and the Court of Parma, Italy in October of 2005.
Litigation and investigations relating to Parmalat are pending in both Italy and the United States.
Proceedings in Italy
On May 26, 2004, the Public Prosecutor's Office for the Court of Milan, Italy filed criminal charges against Luca Sala, Luis Moncada, and Antonio Luzi, three former employees of the Corporation, alleging the crime of market manipulation in connection with a press release issued by Parmalat. On December 18, 2008, the Court of Milan, Italy fully acquitted each of the former employees of all charges. On June 17, 2009, the Public Prosecutor's Office for the Court of Milan, Italy filed an appeal of the decision. The initial hearing date for the appeal is set for January 26, 2010. The Public Prosecutor's Office also filed a related charge in May 2004 against the Corporation asserting administrative liability based on an alleged failure to maintain an organizational model sufficient to prevent the alleged criminal activities of its former employees. The trial on this administrative charge is ongoing, with hearing dates scheduled in 2010.
On July 31, 2009, the Public Prosecutor's Office for the Court of Parma, Italy filed formal charges against 10 former employees and one current employee of the Corporation, alleging the commission of crimes of fraudulent bankruptcy, fraud, usury and embezzlement in connection with the insolvency of Parmalat. The first preliminary hearing was held on November 16, 2009, with further hearings in 2010.
Proceedings in the United States
All cases listed herein have been transferred to the U.S. District Court for the Southern District of New York for coordinated pre-trial purposes under the caption In re Securities Litigation Parmalat.
Since December 2003, certain purchasers of Parmalat-related private placement offerings have filed complaints against the Corporation and
various related entities in the following actions: Principal Global Investors, LLC, et al. v. Bank of America Corporation, et al . in the U.S. District Court for the Southern District of Iowa; Monumental Life Insurance Company, et
al. v. Bank of America Corporation, et al. in the U.S. District Court for the Northern District of Iowa; Prudential Insurance Company of America and Hartford Life Insurance Company v. Bank of America Corporation, et al . in the U.S. District Court for the Northern District of Illinois; Allstate Life Insurance Company v. Bank of America Corporation, et al . in the U.S. District Court for the Northern District of Illinois; Hartford Life Insurance v. Bank of America Corporation, et al. in the U.S. District Court for the Southern District of New York; and John Hancock Life Insurance Company, et al. v. Bank of America Corporation et al. in the U.S. District Court for the District of Massachusetts. The actions variously allege violations of federal and state securities laws and state common law, and seek rescission and unspecified damages based upon the Corporation's and related entities' alleged roles in certain private placement offerings issued by Parmalat-related companies. The plaintiffs seek rescission and unspecified damages resulting from alleged purchases of approximately $305 million in private placement instruments.
On November 23, 2005, the Official Liquidators of Food Holdings Limited and Dairy Holdings Limited, two entities in liquidation proceedings in the Cayman Islands, filed a complaint, entitled Food Holdings Ltd, et al. v. Bank of America Corp., et al. (the Food Holdings Action), in the U.S. District Court for the Southern District of New York against the Corporation and several related entities. The complaint in the Food Holdings Action alleges that the Corporation and other defendants conspired with Parmalat in carrying out transactions involving the plaintiffs in connection with the funding of Parmalat's Brazilian entities, and asserts claims for fraud, negligent misrepresentation, breach of fiduciary duty and other related claims. The complaint seeks in excess of $400 million in compensatory damages and interest, among other relief. A bench trial was held the week of September 14, 2009. On February 17, 2010, the District Court issued an Opinion and Order dismissing all of the claims.
Pender Litigation
The Corporation is a defendant in a putative class action entitled William L. Pender, et al. v. Bank of America Corporation, et al. (formerly captioned Anita Pothier, et al. v. Bank of America Corporation, et al. ), which is pending in the U.S. District Court for the Western District of North Carolina. The action, filed on June 30, 2004, is brought on behalf of participants in or beneficiaries of The Bank of America Pension Plan (formerly known as the NationsBank Cash Balance Plan) and The Bank of America 401(k) Plan (formerly known as the NationsBank 401(k) Plan). The Corporation, BANA, The Bank of America Pension Plan, The Bank of America 401(k) Plan, the Bank of America Corporation Corporate Benefits Committee and various members thereof, and PricewaterhouseCoopers LLP are defendants. The complaint alleges violations of ERISA, including that the design of The Bank of America Pension Plan violated ERISA's defined benefit pension plan standards and that such plan's definition of normal retirement age is invalid. In addition, the complaint alleges age discrimination by The Bank of America Pension Plan, unlawful lump sum benefit calculation, violation of ERISA's "anti-backloading" rule, that certain voluntary transfers of assets by participants in The Bank of America 401(k) Plan to The Bank of America Pension Plan violated ERISA, and other related claims. The complaint alleges that plan participants are entitled to greater benefits and seeks declaratory relief, monetary relief in an unspecified amount, equitable relief, including an order reforming The Bank of America Pension Plan, attorneys' fees and interest. On September 26, 2005, the bank defendants filed a motion to dismiss. On December 1, 2005, the plaintiffs moved to certify classes consisting of, among others, (i) all persons who accrued or who are currently accruing benefits under The Bank of America Pension Plan and (ii) all persons who elected to have amounts representing their account balances under The Bank of America 401(k) Plan transferred to The Bank of America Pension Plan.
| 170 | Bank of America 2009 |
NOTE 15 – Shareholders' Equity and Earnings Per Common Share
Common Stock
In January 2009, the Corporation issued 1.4 billion shares of common stock in connection with its acquisition of Merrill Lynch. For additional information regarding the Merrill Lynch acquisition, see Note 2 – Merger and Restructuring Activity . During 2009 and 2008, in connection with preferred stock issuances to the U.S. government under TARP, the Corporation issued warrants to purchase 121.8 million shares of common stock at an exercise price of $30.79 per share and 150.4 million shares of common stock at an exercise price of $13.30 per share. The U.S. Treasury recently announced its intention to auction, during March 2010, these warrants.
During the second quarter of 2009, the Corporation issued 1.25 billion shares of its common stock at an average price of $10.77 per share through an at-the-market issuance program resulting in gross proceeds of approximately $13.5 billion.
The Corporation may repurchase shares, subject to certain restrictions, from time to time, in the open market or in private transactions through the Corporation's approved repurchase program. In 2009, the Corporation did not repurchase any shares of common stock and issued approximately 7.4 million shares under employee stock plans. At December 31, 2009, the Corporation had reserved 1.3 billion of unissued common shares for future issuances.
In October 2009, the Board declared a fourth quarter cash dividend of $0.01 per common share which was paid on December 24, 2009 to
common shareholders of record on December 4, 2009. In July 2009, the Board declared a third quarter cash dividend of $0.01 per common share which was paid on September 25, 2009 to common shareholders of record on September 4, 2009. In April 2009, the Board declared a second quarter cash dividend of $0.01 per common share which was paid on June 26, 2009 to shareholders of record on June 5, 2009. In January 2009, the Board declared a first quarter cash dividend of $0.01 per common share which was paid on March 27, 2009 to shareholders of record on March 6, 2009.
In addition, in January 2010, the Board declared a regular quarterly cash dividend on common stock of $0.01 per share, payable on March 26, 2010 to common shareholders of record on March 5, 2010.
Preferred Stock
During 2009, the Corporation entered into agreements with certain holders of non-government perpetual preferred stock to exchange their holdings of approximately $7.3 billion aggregate liquidation preference of perpetual preferred stock for approximately 545 million shares of common stock. In addition, the Corporation exchanged approximately $3.9 billion aggregate liquidation preference of non-government preferred stock for approximately 200 million shares of common stock in an exchange offer. In total, these exchanges resulted in the exchange of approximately $11.3 billion aggregate liquidation preference of preferred stock into approximately 745 million shares of common stock. The table below provides further detail on the non-convertible perpetual preferred stock exchanges.
(Dollars in millions, actual shares) Series | Preferred Shares Exchanged | Carrying Value (1) | Common Shares Issued | Fair Value of Stock Issued | ||||||
Negotiated Exchanges | ||||||||||
Series K | 173,298 | $ | 4,332 | 328,193,964 | $ | 3,635 | ||||
Series M | 102,643 | 2,566 | 192,970,068 | 2,178 | ||||||
Series 4 | 7,024 | 211 | 11,642,232 | 131 | ||||||
Series D | 6,566 | 164 | 10,104,798 | 114 | ||||||
Series 7 | 33,404 | 33 | 2,069,047 | 23 | ||||||
Total Negotiated Exchanges | 322,935 | 7,306 | 544,980,109 | 6,081 | ||||||
Exchange Offer | ||||||||||
Series E | 61,509 | 1,538 | 78,670,451 | 1,003 | ||||||
Series 5 | 29,810 | 894 | 45,753,525 | 583 | ||||||
Series 1 | 16,139 | 484 | 22,866,796 | 292 | ||||||
Series 2 | 19,453 | 584 | 27,562,975 | 351 | ||||||
Series 3 | 4,664 | 140 | 7,490,194 | 95 | ||||||
Series I | 7,416 | 185 | 10,215,305 | 130 | ||||||
Series J | 2,289 | 57 | 3,378,098 | 43 | ||||||
Series H | 2,517 | 63 | 4,062,655 | 52 | ||||||
Total Exchange Offer | 143,797 | 3,945 | 199,999,999 | 2,549 | ||||||
Total Preferred Exchanges | 466,732 | $ | 11,251 | 744,980,108 | $ | 8,630 | ||||
| (1) | Amounts shown are before third party issuance costs. |
During 2009, in addition to the exchanges detailed in the table above, the Corporation exchanged 3.6 million shares, or $3.6 billion aggregate liquidation preference of Series L 7.25% Non-Cumulative Perpetual Convertible Preferred Stock into 255 million shares of common stock valued at $2.8 billion, which was accounted for as an induced conversion of preferred stock.
As a result of the exchange, the Corporation recorded an increase to retained earnings and net income applicable to common shareholders of approximately $580 million. This represents the net of a $2.62 billion benefit due to the excess of the carrying value of the Corporation's non-convertible preferred stock over the fair value of the common stock
exchanged. This was partially offset by a $2.04 billion inducement representing the excess of the fair value of the common stock exchanged over the fair value of the common stock that would have been issued under the original conversion terms.
In connection with the Merrill Lynch acquisition, Merrill Lynch non-convertible preferred shareholders received Bank of America Corporation preferred stock having substantially identical terms. Merrill Lynch convertible preferred stock remains outstanding and is now convertible into Bank of America common stock at an exchange ratio equivalent to the exchange ratio for Merrill Lynch common stock in connection with the acquisition.
| Bank of America 2009 | 171 |
The following table presents a summary of preferred stock previously issued by the Corporation and remaining outstanding (including the series of preferred stock issued and remaining outstanding in connection with the acquisition of Merrill Lynch), after consideration of the exchanges discussed on the previous page.
Preferred Stock Summary
(Dollars in millions, except as noted) Series | Description | Initial Issuance Date | Total Shares Outstanding | Liquidation Preference per Share (in dollars) | Carrying Value (1) | Per Annum Dividend Rate | Redemption Period | |||||||||
Series B (2) | 7% Cumulative Redeemable | June 1997 | 7,571 | $ | 100 | $ | 1 | 7.00% | n/a | |||||||
Series D (3, 9) | 6.204% Non- Cumulative | September 2006 | 26,434 | 25,000 | 661 | 6.204% | On or after September 14, 2011 | |||||||||
Series E (3, 9) | Floating Rate Non-Cumulative | November 2006 | 19,491 | 25,000 | 487 | Annual rate equal to the greater of (a) 3-mo. LIBOR + 35 bps and (b) 4.00% | On or after November 15, 2011 | |||||||||
Series H (3, 9) | 8.20% Non- Cumulative | May 2008 | 114,483 | 25,000 | 2,862 | 8.20% | On or after May 1, 2013 | |||||||||
Series I (3, 9) | 6.625% Non- Cumulative | September 2007 | 14,584 | 25,000 | 365 | 6.625% | On or after October 1, 2017 | |||||||||
Series J (3, 9) | 7.25% Non- Cumulative | November 2007 | 39,111 | 25,000 | 978 | 7.25% | On or after November 1, 2012 | |||||||||
Series K (3,10) | Fixed-to-Floating Rate Non- Cumulative | January 2008 | 66,702 | 25,000 | 1,668 | 8.00% through 1/29/18; 3-mo. LIBOR + 363 bps thereafter | On or after January 30, 2018 | |||||||||
Series L | 7.25% Non- Cumulative Perpetual Convertible | January 2008 | 3,349,321 | 1,000 | 3,349 | 7.25% | n/a | |||||||||
Series M (3, 10) | Fixed-to-Floating Rate Non- Cumulative | April 2008 | 57,357 | 25,000 | 1,434 | 8.125% through 5/14/18; 3-mo. LIBOR + 364 bps thereafter | On or after May 15, 2018 | |||||||||
Series S | Common Equivalent Stock | December 2009 | 1,286,000 | 15,000 | 19,290 | Same as dividend per common share | n/a | |||||||||
Series 1 (3, 4) | Floating Rate Non-Cumulative | November 2004 | 4,861 | 30,000 | 146 | 3-mo LIBOR + 75 bps (5) | On or after November 28, 2009 | |||||||||
Series 2 (3, 4) | Floating Rate Non-Cumulative | March 2005 | 17,547 | 30,000 | 526 | 3-mo LIBOR + 65 bps (5) | On or after November 28, 2009 | |||||||||
Series 3 (3, 4) | 6.375% Non- Cumulative | November 2005 | 22,336 | 30,000 | 670 | 6.375% | On or after November 28, 2010 | |||||||||
Series 4 (3, 4) | Floating Rate Non-Cumulative | November 2005 | 12,976 | 30,000 | 389 | 3-mo LIBOR + 75 bps (6) | On or after November 28, 2010 | |||||||||
Series 5 (3, 4) | Floating Rate Non-Cumulative | March 2007 | 20,190 | 30,000 | 606 | 3-mo LIBOR + 50 bps (6) | On or after May 21, 2012 | |||||||||
Series 6 (3, 7) | 6.70% Non- Cumulative Perpetual | September 2007 | 65,000 | 1,000 | 65 | 6.70% | On or after February 03, 2009 | |||||||||
Series 7 (3, 7) | 6.25% Non- Cumulative Perpetual | September 2007 | 16,596 | 1,000 | 17 | 6.25% | On or after March 18, 2010 | |||||||||
Series 8 (3, 4) | 8.625% Non- Cumulative | April 2008 | 89,100 | 30,000 | 2,673 | 8.625% | On or after May 28, 2013 | |||||||||
Series 2 (MC) (3, 8) | 9.00% Non-Voting Mandatory Convertible Non- Cumulative | July 2008 | 12,000 | 100,000 | 1,200 | 9.00% | On October 15, 2010 | |||||||||
Series 3 (MC) (3, 8) | 9.00% Non-Voting Mandatory Convertible Non- Cumulative | July 2008 | 5,000 | 100,000 | 500 | 9.00% | On October 15, 2010 | |||||||||
Total | 5,246,660 | $ | 37,887 | |||||||||||||
| (1) | Amounts shown are before third party issuance costs and other Merrill Lynch purchase accounting related adjustments of $679 million. |
| (2) | Series B Preferred Stock does not have early redemption/call rights. |
| (3) | The Corporation may redeem series of preferred stock on or after the redemption date, in whole or in part, at its option, at the liquidation preference plus declared and unpaid dividends. |
| (4) | Ownership is held in the form of depositary shares, each representing a 1/1200 th interest in a share of preferred stock, paying a quarterly cash dividend, if and when declared. |
| (5) | Subject to 3.00% minimum rate per annum. |
| (6) | Subject to 4.00% minimum rate per annum. |
| (7) | Ownership is held in the form of depositary shares, each representing a 1/40 th interest in a share of preferred stock, paying a quarterly cash dividend, if and when declared. |
| (8) | Represents shares outstanding of Merrill Lynch & Co., Inc. Each share of Mandatory Convertible Preferred Stock Series 2 and Series 3 will be converted on October 15, 2010 into a maximum of 2,605 and 3,820 shares of the Corporation's common stock plus cash in lieu of fractional shares and are optionally convertible prior to that time into 2,227 and 3,265 shares. |
| (9) | Ownership is held in the form of depositary shares each representing a 1/1000 th interest in a share of preferred stock paying a quarterly cash dividend, if and when declared. |
| (10) | Ownership is held in the form of depositary shares each representing a 1/25 th interest in a share of preferred stock, paying a semi-annual cash dividend, if and when declared, until the redemption date adjusts to a quarterly cash dividend, if and when declared, thereafter. |
n/a = not applicable
| 172 | Bank of America 2009 |
Series L Preferred Stock does not have early redemption/call rights. Each share of the Series L Preferred Stock may be converted at any time, at the option of the holder, into 20 shares of the Corporation's common stock plus cash in lieu of fractional shares. On or after January 30, 2013, the Corporation may cause some or all of the Series L Preferred Stock, at its option, at any time or from time to time, to be converted into shares of common stock at the then-applicable conversion rate if, for 20 trading days during any period of 30 consecutive trading days, the closing price of common stock exceeds 130 percent of the then-applicable conversion price of the Series L Preferred Stock. If the Corporation exercises its rights to cause the automatic conversion of Series L Preferred Stock on January 30, 2013, it will still pay any accrued dividends payable on January 30, 2013 to the applicable holders of record.
Common Equivalent Junior Preferred Stock Series S (Common Equivalent Stock) does not have early redemption/call rights. Each share of the Common Equivalent Stock is automatically convertible into 1,000 shares of the Corporation's common stock following effectiveness of an amendment to the Corporation's certificate of incorporation to increase the amount of authorized common stock. Ownership of the Common Equivalent Stock is held in the form of depositary shares each representing a 1/1000 th interest in a share of preferred stock, paying cash dividends, on an as converted basis, with the Corporation's common stock, if and when declared. In certain circumstances following the failure of the Corporation's stockholders to approve the amendment to the certificate of incorporation, the Common Equivalent Stock will partially convert into common stock, the liquidation preference per share will be proportionally reduced, and the shares will be entitled to additional quarterly cash dividends, if and when declared.
All series of preferred stock in the previous table have a par value of $0.01 per share. The shares of the series of preferred stock above are not subject to the operation of a sinking fund, and other than the right of the Series S Preferred Stock to participate in certain common dividends and liquidating distributions, have no participation rights. With the exception of the Series L Preferred Stock, Common Equivalent Stock, and Mandatory Convertible Preferred Stock Series 2 and 3, the shares of the series of preferred stock in the previous table are not convertible. The holders of the Series B Preferred Stock, Common Equivalent Stock and Series 1-8 Preferred Stock have general voting rights, and the holders of the other series included in the previous table have no general voting rights. All preferred stock of the Corporation outstanding has preference over the Corporation's common stock with respect to the payment of dividends and distribution of the Corporation's assets in the event of a liquidation or dissolution except the Series S, which ranks equally with the common stock in certain circumstances. If any dividend payable on these series is in arrears for three or more semi-annual or six or more quarterly dividend periods, as applicable (whether consecutive or not), the holders of these series and any other class or series of preferred stock ranking equally as to payment of dividends and upon which equivalent voting
rights have been conferred and are exercisable (voting as a single class) will be entitled to vote for the election of two additional directors. These voting rights terminate when the Corporation has paid in full dividends on these series for at least two semi-annual or four quarterly dividend periods, as applicable, following the dividend arrearage.
In October 2008, in connection with TARP, the Corporation issued to the U.S. Treasury non-voting perpetual preferred stock and warrants for $15.0 billion. In addition, in January 2009, in connection with TARP and the Merrill Lynch acquisition, the Corporation issued additional preferred stock for $30.0 billion. On December 2, 2009, the Corporation received approval from the U.S. Treasury and Federal Reserve to repay the U.S. government's $45.0 billion preferred stock investment provided under TARP. In accordance with the authorization, on December 9, 2009, the Corporation repurchased all outstanding shares of Fixed-Rate Cumulative Perpetual Preferred Stock Series N, Series Q and Series R preferred stock (collectively, TARP Preferred Stock) previously issued to the U.S. Treasury. The U.S. Treasury recently announced its intention to auction, during March 2010, the common stock warrants the Corporation issued in connection with the sale of the TARP Preferred Stock.
The Corporation repurchased the TARP Preferred Stock through use of $25.7 billion in excess liquidity and $19.2 billion in proceeds from the sale of 1.3 billion Common Equivalent Securities (CES) valued at $15.00 per unit. The Common Equivalent Securities consist of depositary shares representing interests in shares of Common Equivalent Stock, and warrants (Contingent Warrants) to purchase an aggregate of 60 million shares of the Corporation's common stock. Each CES consisted of one depositary share representing a 1/1000 th interest in a share of Common Equivalent Stock and each Contingent Warrant granted the holder the right to purchase 0.0467 of a share of a common stock for $0.01 per share. Each depositary share entitled the holder, through the depository to a proportional fractional interest in all rights and preferences of the Common Equivalent Stock, including conversion, dividend, liquidation and voting rights.
The Corporation held a special meeting of stockholders on February 23, 2010 at which it obtained stockholder approval of an amendment to the amended and restated certificate of incorporation to increase the number of authorized shares of common stock, and accordingly the Common Equivalent Stock automatically converted in full into 1.286 billion shares of common stock on February 24, 2010 following the filing of the amendment with the Delaware Secretary of State on February 23, 2010. In addition, as a result, the Contingent Warrants expired without having become exercisable and the CES ceased to exist.
During 2009, 2008 and 2007, the aggregate dividends declared on preferred stock were $4.5 billion, $1.3 billion and $182 million, respectively. This included $536 million in 2009 related to preferred stock issued or remaining outstanding as a part of the Merrill Lynch acquisition.
| Bank of America 2009 | 173 |
Accumulated OCI
The following table presents the changes in accumulated OCI for 2009, 2008 and 2007, net-of-tax.
| (Dollars in millions) | Available-for- Sale Debt Securities | Available-for- Sale Marketable Equity Securities | Derivatives | Employee Benefit Plans (1) | Foreign Currency (2) | Total | ||||||||||||||||||
Balance, December 31, 2008 | $ | (5,956 | ) | $ | 3,935 | $ | (3,458 | ) | $ | (4,642 | ) | $ | (704 | ) | $ | (10,825 | ) | |||||||
Cumulative adjustment for accounting change – OTTI (3) | (71 | ) | – | – | – | – | (71 | ) | ||||||||||||||||
Net change in fair value recorded in accumulated OCI | 6,364 | 2,651 | 197 | 318 | 211 | 9,741 | ||||||||||||||||||
Net realized (gains) losses reclassified into earnings | (965 | ) | (4,457 | ) | 726 | 232 | – | (4,464 | ) | |||||||||||||||
Balance, December 31, 2009 | $ | (628 | ) | $ | 2,129 | $ | (2,535 | ) | $ | (4,092 | ) | $ | (493 | ) | $ | (5,619 | ) | |||||||
Balance, December 31, 2007 | $ | (1,880 | ) | $ | 8,416 | $ | (4,402 | ) | $ | (1,301 | ) | $ | 296 | $ | 1,129 | |||||||||
Net change in fair value recorded in accumulated OCI (4 ) | (5,496 | ) | (4,858 | ) | 104 | (3,387 | ) | (1,000 | ) | (14,637 | ) | |||||||||||||
Net realized losses reclassified into earnings | 1,420 | 377 | 840 | 46 | – | 2,683 | ||||||||||||||||||
Balance, December 31, 2008 | $ | (5,956 | ) | $ | 3,935 | $ | (3,458 | ) | $ | (4,642 | ) | $ | (704 | ) | $ | (10,825 | ) | |||||||
Balance, December 31, 2006 | $ | (3,117 | ) | $ | 384 | $ | (3,697 | ) | $ | (1,428 | ) | $ | 147 | $ | (7,711 | ) | ||||||||
Net change in fair value recorded in accumulated OCI | 1,100 | 8,316 | (1,252 | ) | 4 | 142 | 8,310 | |||||||||||||||||
Net realized losses reclassified into earnings | 137 | (284 | ) | 547 | 123 | 7 | 530 | |||||||||||||||||
Balance, December 31, 2007 | $ | (1,880 | ) | $ | 8,416 | $ | (4,402 | ) | $ | (1,301 | ) | $ | 296 | $ | 1,129 | |||||||||
| (1) | Net change in fair value represents after-tax adjustments based on the final year-end actuarial valuations. |
| (2) | Net change in fair value represents only the impact of changes in foreign exchange rates on the Corporation's net investment in foreign operations. |
| (3) | Effective January 1, 2009, the Corporation adopted new accounting guidance on the recognition of other-than-temporary impairment losses on debt securities. For additional information on the adoption of this accounting guidance, see Note 1 – Summary of Significant Accounting Principles and Note 5 – Securities . |
| (4) | For more information on employee benefit plans, see Note 17 – Employee Benefit Plans . |
Earnings Per Common Share
On January 1, 2009, the Corporation adopted new accounting guidance on EPS which defines unvested share-based payment awards that contain nonforfeitable rights to dividends as participating securities that are included in computing EPS using the two-class method. Prior period EPS amounts have been reclassified to conform to current period presentation. See Note 1 – Summary of Significant Accounting Principles for additional information.
For 2009, 2008 and 2007, average options to purchase 315 million, 181 million and 28 million shares, respectively, of common stock were outstanding but not included in the computation of earnings per common share because they were antidilutive under the treasury stock method. For 2009, 147 million average dilutive potential common shares associated with the convertible Series L Preferred Stock and Mandatory Convertible Preferred Stock Series 2 and Series 3 were excluded from the diluted
share count because the result would have been antidilutive under the "if-converted" method. For 2009, 81 million average potential dilutive common shares associated with the Common Equivalent Securities were also excluded from the diluted share count because the result would have been antidilutive under the "if-converted" method. For 2009, average warrants to purchase 265 million shares of common stock were outstanding but not included in the computation of earnings per common share because they were antidilutive under the treasury stock method. For 2008, 128 million average dilutive potential common shares associated with the convertible Series L Preferred Stock issued in January 2008 were excluded from the diluted share count because the result would have been antidilutive under the "if-converted" method.
The calculation of earnings per common share and diluted earnings per common share for 2009, 2008 and 2007 is presented below.
| (Dollars in millions, except per share information; shares in thousands) | 2009 | 2008 | 2007 | |||||||||
Earnings (loss) per common share | ||||||||||||
Net income | $ | 6,276 | $ | 4,008 | $ | 14,982 | ||||||
Preferred stock dividends | (4,494 | ) | (1,452 | ) | (182 | ) | ||||||
Accelerated accretion from redemption of preferred stock issued to the U.S. Treasury | (3,986 | ) | – | – | ||||||||
Net income (loss) applicable to common shareholders | $ | (2,204 | ) | $ | 2,556 | $ | 14,800 | |||||
Income (loss) allocated to participating securities | (6 | ) | (69 | ) | (108 | ) | ||||||
Net income (loss) allocated to common shareholders | $ | (2,210 | ) | $ | 2,487 | $ | 14,692 | |||||
Average common shares issued and outstanding | 7,728,570 | 4,592,085 | 4,423,579 | |||||||||
Earnings (loss) per common share | $ | (0.29 | ) | $ | 0.54 | $ | 3.32 | |||||
Diluted earnings (loss) per common share | ||||||||||||
Net income (loss) applicable to common shareholders (1) | $ | (2,204 | ) | $ | 2,556 | $ | 14,800 | |||||
Income (loss) allocated to participating securities | (6 | ) | (69 | ) | (108 | ) | ||||||
Net income (loss) allocated to common shareholders | $ | (2,210 | ) | $ | 2,487 | $ | 14,692 | |||||
Average common shares issued and outstanding | 7,728,570 | 4,592,085 | 4,423,579 | |||||||||
Dilutive potential common shares (2) | – | 4,343 | 39,634 | |||||||||
Total diluted average common shares issued and outstanding | 7,728,570 | 4,596,428 | 4,463,213 | |||||||||
Diluted earnings (loss) per common share | $ | (0.29 | ) | $ | 0.54 | $ | 3.29 | |||||
| (1) | For 2009, the Corporation recorded an increase to retained earnings and net income applicable to common shareholders of approximately $580 million related to the Corporation's preferred stock exchange for common stock. |
| (2) | Includes incremental shares from restricted stock units, restricted stock shares, stock options and warrants. Due to a net loss applicable to common shareholders for 2009, no dilutive potential common shares were included in the calculations of diluted EPS because they were antidilutive. |
| 174 | Bank of America 2009 |
NOTE 16 – Regulatory Requirements and Restrictions
The Federal Reserve requires the Corporation's banking subsidiaries to maintain reserve balances based on a percentage of certain deposits. Average daily reserve balances required by the Federal Reserve were $10.9 billion and $7.1 billion for 2009 and 2008. Currency and coin residing in branches and cash vaults (vault cash) are used to partially satisfy the reserve requirement. The average daily reserve balances, in excess of vault cash, held with the Federal Reserve amounted to $3.4 billion and $133 million for 2009 and 2008.
The primary sources of funds for cash distributions by the Corporation to its shareholders are dividends received from its banking subsidiaries, Bank of America, N.A. and FIA Card Services, N.A. In 2009, the Corporation received $3.4 billion in dividends from Bank of America, N.A. In 2010, Bank of America, N.A. and FIA Card Services, N.A. can declare and pay dividends to the Corporation of $1.4 billion and $0 plus an additional amount equal to their net profits for 2010, as defined by statute, up to the date of any such dividend declaration. The other subsidiary national banks can initiate aggregate dividend payments in 2010 of $373 million plus an additional amount equal to their net profits for 2010, as defined by statute, up to the date of any such dividend declaration. The amount of dividends that each subsidiary bank may declare in a calendar year without approval by the Office of the Comptroller of the Currency (OCC) is the subsidiary bank's net profits for that year combined with its net retained profits, as defined, for the preceding two years.
The Federal Reserve, OCC, Federal Deposit Insurance Corporation (FDIC) and Office of Thrift Supervision (collectively, joint agencies) have in place regulatory capital guidelines for U.S. banking organizations. Failure to meet the capital requirements can initiate certain mandatory and discretionary actions by regulators that could have a material effect on the Corporation's financial position. The regulatory capital guidelines measure capital in relation to the credit and market risks of both on- and off-balance sheet items using various risk weights. Under the regulatory capital guidelines, Total capital consists of three tiers of capital. Tier 1 capital includes common shareholders' equity, Trust Securities, noncontrolling interests and qualifying preferred stock, less goodwill and other adjustments. Tier 2 capital consists of preferred stock not qualifying as Tier 1 capital, mandatorily convertible debt, limited amounts of subordinated debt, other qualifying term debt, the allowance for credit losses up to 1.25 percent of risk-weighted assets and other adjustments. Tier 3 capital includes subordinated debt that is unsecured, fully paid, has an original maturity of at least two years, is not redeemable before maturity without prior approval by the Federal Reserve and includes a lock-in clause precluding payment of either interest or principal if the payment would cause the issuing bank's risk-based capital ratio to fall or remain
below the required minimum. Tier 3 capital can only be used to satisfy the Corporation's market risk capital requirement and may not be used to support its credit risk requirement. At December 31, 2009 and 2008, the Corporation had no subordinated debt that qualified as Tier 3 capital.
Certain corporate-sponsored trust companies which issue Trust Securities are not consolidated. In accordance with Federal Reserve guidance, the Federal Reserve allows Trust Securities to qualify as Tier 1 capital with revised quantitative limits that will be effective on March 31, 2011. As a result, the Corporation includes Trust Securities in Tier 1 capital. Current limits restrict core capital elements to 15 percent of total core capital elements for internationally active bank holding companies. In addition, the Federal Reserve revised the qualitative standards for capital instruments included in regulatory capital. Internationally active bank holding companies are those that have significant activities in non-U.S. markets with consolidated assets greater than $250 billion or on-balance sheet foreign exposure greater than $10 billion. At December 31, 2009, the Corporation's restricted core capital elements comprised 11.8 percent of total core capital elements. The Corporation expects to remain fully compliant with the revised limits prior to the implementation date of March 31, 2011.
To meet minimum, adequately-capitalized regulatory requirements, an institution must maintain a Tier 1 capital ratio of four percent and a Total capital ratio of eight percent. A "well-capitalized" institution must generally maintain capital ratios 200 bps higher than the minimum guidelines. The risk-based capital rules have been further supplemented by a Tier 1 leverage ratio, defined as Tier 1 capital divided by adjusted quarterly average total assets, after certain adjustments. "Well-capitalized" bank holding companies must have a minimum Tier 1 leverage ratio of four percent. National banks must maintain a Tier 1 leverage ratio of at least five percent to be classified as "well-capitalized."
Net unrealized gains (losses) on AFS debt securities, net unrealized gains on AFS marketable equity securities, net unrealized gains (losses) on derivatives, and employee benefit plan adjustments in shareholders' equity are excluded from the calculations of Tier 1 common capital, Tier 1 capital and leverage ratios. The Total capital ratio excludes all of the above with the exception of up to 45 percent of net unrealized pre-tax gains on AFS marketable equity securities.
The Corporation calculates Tier 1 common capital as Tier 1 capital including CES less qualifying trust preferred securities, hybrid securities and qualifying noncontrolling interest in subsidiaries. CES is included in Tier 1 common capital based upon applicable regulatory guidance and the expectation that the underlying Common Equivalent Stock would convert into common stock following shareholder approval of additional authorized shares. Tier 1 common capital was $120.4 billion and $63.3 billion and the Tier 1 common capital ratio was 7.81 percent and 4.80 percent at December 31, 2009 and 2008.
| Bank of America 2009 | 175 |
Regulatory Capital
| December 31 | ||||||||||||||||||||
| 2009 | 2008 | |||||||||||||||||||
| Actual | Minimum Required (1) | Actual | Minimum Required (1) | |||||||||||||||||
| (Dollars in millions) | Ratio | Amount | Ratio | Amount | ||||||||||||||||
Risk-based capital | ||||||||||||||||||||
Tier 1 common | ||||||||||||||||||||
Bank of America Corporation | 7.81 | % | $ | 120,394 | n/a | 4.80 | % | $ | 63,339 | n/a | ||||||||||
Tier 1 | ||||||||||||||||||||
Bank of America Corporation | 10.40 | 160,388 | $ | 61,676 | 9.15 | 120,814 | $ | 52,833 | ||||||||||||
Bank of America, N.A. | 10.30 | 111,916 | 43,472 | 8.51 | 88,979 | 41,818 | ||||||||||||||
FIA Card Services, N.A. | 15.21 | 28,831 | 7,584 | 13.90 | 19,573 | 5,632 | ||||||||||||||
Total | ||||||||||||||||||||
Bank of America Corporation | 14.66 | 226,070 | 123,401 | 13.00 | 171,661 | 105,666 | ||||||||||||||
Bank of America, N.A. | 13.76 | 149,528 | 86,944 | 11.71 | 122,392 | 83,635 | ||||||||||||||
FIA Card Services, N.A. | 17.01 | 32,244 | 15,168 | 16.25 | 22,875 | 11,264 | ||||||||||||||
Tier 1 leverage | ||||||||||||||||||||
Bank of America Corporation | 6.91 | 160,388 | 92,882 | 6.44 | 120,814 | 56,155 | ||||||||||||||
Bank of America, N.A. | 7.38 | 111,916 | 60,626 | 5.94 | 88,979 | 44,944 | ||||||||||||||
FIA Card Services, N.A. | 23.09 | 28,831 | 4,994 | 14.28 | 19,573 | 4,113 | ||||||||||||||
| (1) | Dollar amount required to meet guidelines for adequately capitalized institutions. |
n/a = not applicable
Regulatory Capital Developments
In June 2004, the Basel II Accord was published with the intent of more closely aligning regulatory capital requirements with underlying risks, similar to economic capital. While economic capital is measured to cover unexpected losses, the Corporation also manages regulatory capital to adhere to regulatory standards of capital adequacy. The Basel II Final Rule (Basel II Rules), which was published on December 7, 2007, established requirements for the U.S. implementation and provided detailed capital requirements for credit and operational risk under Pillar 1, supervisory requirements under Pillar 2 and disclosure requirements under Pillar 3. The Corporation will begin Basel II parallel implementation during the second quarter of 2010.
In July 2009, the Basel Committee on Banking Supervision released a consultative document entitled "Revisions to the Basel II Market Risk Framework" that would significantly increase the capital requirements for trading book activities if adopted as proposed. The proposal recommended implementation by December 31, 2010, but regulatory agencies have not yet issued a notice of proposed rulemaking, which is required before establishing final rules. As a result, the Corporation cannot determine the implementation date or the final capital impact.
In December 2009, the Basel Committee on Banking Supervision issued a consultative document entitled "Strengthening the Resilience of the Banking Sector." If adopted as proposed, this could increase significantly the aggregate equity that bank holding companies are required to hold by disqualifying certain instruments that previously have qualified as Tier 1 capital. In addition, it would increase the level of risk-weighted assets. The proposal could also increase the capital charges imposed on certain assets potentially making certain businesses more expensive to conduct. Regulatory agencies have not opined on the proposal for implementation. The Corporation continues to assess the potential impact of the proposal.
As part of the Capital Assistance Program (CAP), the Corporation, as well as several other large financial institutions, are subject to the SCAP conducted by the federal regulators. The objective of the SCAP is to assess losses that could occur under certain economic scenarios, including economic conditions more severe than the Corporation currently anticipates. As a result of the SCAP, in May 2009 federal regulators determined that the Corporation required an additional $33.9 billion of Tier 1 common capital to sustain the most severe economic circum -
stances assuming a more prolonged and deeper recession over a two-year period than both private and government economists currently project. The Corporation achieved the increased capital requirement during 2009 through strategic transactions that increased common capital by approximately $39.7 billion which significantly exceeded the SCAP buffer. This included a gain from the sale of shares in CCB, direct sale of common stock, reduced dividends on preferred shares associated with shares exchanged for common stock and related deferred tax disallowances.
NOTE 17 – Employee Benefit Plans
Pension and Postretirement Plans
The Corporation sponsors noncontributory trusteed pension plans that cover substantially all officers and employees, a number of noncontributory nonqualified pension plans, and postretirement health and life plans. The plans provide defined benefits based on an employee's compensation and years of service. The Bank of America Pension Plan (the Pension Plan) provides participants with compensation credits, generally based on years of service. For account balances based on compensation credits prior to January 1, 2008, the Pension Plan allows participants to select from various earnings measures, which are based on the returns of certain funds or common stock of the Corporation. The participant-selected earnings measures determine the earnings rate on the individual participant account balances in the Pension Plan. Participants may elect to modify earnings measure allocations on a periodic basis subject to the provisions of the Pension Plan. For account balances based on compensation credits subsequent to December 31, 2007, the account balance earnings rate is based on a benchmark rate. For eligible employees in the Pension Plan on or after January 1, 2008, the benefits become vested upon completion of three years of service. It is the policy of the Corporation to fund not less than the minimum funding amount required by ERISA.
The Pension Plan has a balance guarantee feature for account balances with participant-selected earnings, applied at the time a benefit payment is made from the plan that effectively provides principal protection for participant balances transferred and certain compensation credits. The Corporation is responsible for funding any shortfall on the guarantee feature.
| 176 | Bank of America 2009 |
In May 2008, the Corporation and the IRS entered into a closing agreement resolving all matters relating to an audit by the IRS of the Pension Plan and the Bank of America 401(k) Plan. The audit included a review of voluntary transfers by participants of 401(k) Plan accounts to the Pension Plan. In connection with the agreement, the Pension Plan transferred approximately $1.2 billion of assets and liabilities associated with the transferred accounts to a newly established defined contribution plan during 2009.
As a result of recent acquisitions, the Corporation assumed the obligations related to the pension plans of FleetBoston, MBNA, U.S. Trust Corporation, LaSalle and Countrywide. These plans, together with the Pension Plan, are referred to as the Qualified Pension Plans. The Bank of America Pension Plan for Legacy Fleet (the FleetBoston Pension Plan) and the Bank of America Pension Plan for Legacy U.S. Trust Corporation (the U.S. Trust Pension Plan) are substantially similar to the Pension Plan discussed above; however, these plans do not allow participants to select various earnings measures; rather the earnings rate is based on a benchmark rate. In addition, both plans include participants with benefits determined under formulas based on average or career compensation and years of service rather than by reference to a pension account. The Bank of America Pension Plan for Legacy MBNA (the MBNA Pension Plan), the Bank of America Pension Plan for Legacy LaSalle (the LaSalle Pension Plan) and the Countrywide Financial Corporation Inc. Defined Benefit Pension Plan (the Countrywide Pension Plan) provide retirement benefits based on the number of years of benefit service and a percentage of the participant's average annual compensation during the five highest paid consecutive years of the last ten years of employment. Effective December 31, 2008, the Countrywide Pension Plan, LaSalle Pension Plan, MBNA Pension Plan and U.S. Trust Pension Plan merged into the FleetBoston Pension Plan, which was renamed the Bank of America Pension Plan for Legacy Companies. The plan merger did not change participant benefits or benefit accruals as the Bank of America Pension Plan for Legacy Companies continues the respective benefit structures of the five plans for their respective participant groups.
As a result of the Merrill Lynch acquisition, the Corporation assumed the obligations related to the plans of Merrill Lynch. These plans include a terminated U.S. pension plan, non-U.S. pension plans, nonqualified pension plans and postretirement plans. The non-U.S. pension plans vary based on the country and local practices. The terminated U.S. pension plan and the non-U.S. pension plans are referred to as the Other Pension Plans.
In 1988, Merrill Lynch purchased a group annuity contract that guarantees the payment of benefits vested under the terminated U.S. pension plan. The Corporation, under a supplemental agreement, may be responsible for, or benefit from actual experience and investment performance of the annuity assets. The Corporation contributed $120 million under this agreement during 2009. Additional contributions may be required in the future under this agreement.
The Corporation sponsors a number of noncontributory, nonqualified pension plans (the Nonqualified Pension Plans). As a result of acquisitions, the Corporation assumed the obligations related to the noncontributory, nonqualified pension plans of former FleetBoston, MBNA, U.S. Trust Corporation, LaSalle, Countrywide and Merrill Lynch. These plans, which are unfunded, provide defined pension benefits to certain employees.
In addition to retirement pension benefits, full-time, salaried employees and certain part-time employees may become eligible to continue participation as retirees in health care and/or life insurance plans sponsored by the Corporation. Based on the other provisions of the individual plans, certain retirees may also have the cost of these benefits partially paid by the Corporation. The obligations assumed as a result of the acquisitions are substantially similar to the Corporation's postretirement health and life plans, except for Countrywide which did not have a postretirement health and life plan. Collectively, these plans are referred to as the Postretirement Health and Life Plans.
The tables within this Note include the information related to the Countrywide plans beginning July 1, 2008 and the Merrill Lynch plans beginning January 1, 2009.
| Bank of America 2009 | 177 |
The following table summarizes the changes in the fair value of plan assets, changes in the projected benefit obligation (PBO), the funded status of both the accumulated benefit obligation (ABO) and the PBO, and the weighted-average assumptions used to determine benefit obligations for the pension plans and postretirement plans at December 31, 2009 and 2008. Amounts recognized at December 31, 2009 and 2008 are reflected in other assets, and accrued expenses and other liabilities on the Consolidated Balance Sheet. The discount rate assumption is based
on a cash flow matching technique and is subject to change each year. This technique utilizes yield curves that are based on Aa-rated corporate bonds with cash flows that match estimated benefit payments of each of the plans to produce the discount rate assumptions. The asset valuation method for the Qualified Pension Plans recognizes 60 percent of the prior year's market gains or losses at the next measurement date with the remaining 40 percent spread equally over the subsequent four years.
| Qualified Pension Plans (1) | Nonqualified and Other Pension Plans (1) | Postretirement Health and Life Plans (1) | ||||||||||||||||||||||||||
| (Dollars in millions) | 2009 | 2008 | 2009 | 2008 | 2009 | 2008 | ||||||||||||||||||||||
Change in fair value of plan assets | ||||||||||||||||||||||||||||
Fair value, January 1 | $ | 14,254 | $ | 18,720 | $ | 2 | $ | 2 | $ | 110 | $ | 165 | ||||||||||||||||
Countrywide balance, July 1, 2008 | – | 305 | – | – | – | – | ||||||||||||||||||||||
Merrill Lynch balance, January 1, 2009 | – | – | 3,788 | – | – | – | ||||||||||||||||||||||
Actual return on plan assets | 2,238 | (5,310 | ) | (58 | ) | – | 21 | (43 | ) | |||||||||||||||||||
Company contributions (2) | – | 1,400 | 322 | 154 | 92 | 83 | ||||||||||||||||||||||
Plan participant contributions | – | – | 2 | – | 141 | 117 | ||||||||||||||||||||||
Benefits paid | (791 | ) | (861 | ) | (309 | ) | (154 | ) | (272 | ) | (227 | ) | ||||||||||||||||
Plan transfer | (1,174 | ) | – | – | – | – | – | |||||||||||||||||||||
Federal subsidy on benefits paid | n/a | n/a | n/a | n/a | 21 | 15 | ||||||||||||||||||||||
Foreign currency exchange rate changes | n/a | n/a | 100 | n/a | – | – | ||||||||||||||||||||||
Fair value, December 31 | $ | 14,527 | $ | 14,254 | $ | 3,847 | $ | 2 | $ | 113 | $ | 110 | ||||||||||||||||
Change in projected benefit obligation | ||||||||||||||||||||||||||||
Projected benefit obligation, January 1 | $ | 13,724 | $ | 14,200 | $ | 1,258 | $ | 1,307 | $ | 1,404 | $ | 1,576 | ||||||||||||||||
Countrywide balance, July 1, 2008 | – | 439 | – | 53 | – | – | ||||||||||||||||||||||
Merrill Lynch balance, January 1, 2009 | – | – | 2,963 | – | 226 | – | ||||||||||||||||||||||
Service cost | 387 | 343 | 34 | 7 | 16 | 16 | ||||||||||||||||||||||
Interest cost | 740 | 837 | 243 | 77 | 93 | 87 | ||||||||||||||||||||||
Plan participant contributions | – | – | 2 | – | 141 | 117 | ||||||||||||||||||||||
Plan amendments | 37 | 5 | – | – | – | – | ||||||||||||||||||||||
Actuarial loss (gain) | 89 | (1,239 | ) | 137 | (32 | ) | (11 | ) | (180 | ) | ||||||||||||||||||
Benefits paid | (791 | ) | (861 | ) | (309 | ) | (154 | ) | (272 | ) | (227 | ) | ||||||||||||||||
Plan transfer | (1,174 | ) | – | – | – | – | – | |||||||||||||||||||||
Termination benefits | 36 | – | – | – | – | – | ||||||||||||||||||||||
Curtailments | – | – | (3 | ) | – | – | – | |||||||||||||||||||||
Federal subsidy on benefits paid | n/a | n/a | n/a | n/a | 21 | 15 | ||||||||||||||||||||||
Foreign currency exchange rate changes | n/a | n/a | 111 | n/a | 2 | – | ||||||||||||||||||||||
Projected benefit obligation, December 31 | $ | 13,048 | $ | 13,724 | $ | 4,436 | $ | 1,258 | $ | 1,620 | $ | 1,404 | ||||||||||||||||
Amount recognized, December 31 | $ | 1,479 | $ | 530 | $ | (589 | ) | $ | (1,256 | ) | $ | (1,507 | ) | $ | (1,294 | ) | ||||||||||||
Funded status, December 31 | ||||||||||||||||||||||||||||
Accumulated benefit obligation | $ | 12,198 | $ | 12,864 | $ | 4,317 | $ | 1,246 | n/a | n/a | ||||||||||||||||||
Overfunded (unfunded) status of ABO | 2,329 | 1,390 | (470 | ) | (1,244 | ) | n/a | n/a | ||||||||||||||||||||
Provision for future salaries | 850 | 860 | 119 | 12 | n/a | n/a | ||||||||||||||||||||||
Projected benefit obligation | 13,048 | 13,724 | 4,436 | 1,258 | $ | 1,620 | $ | 1,404 | ||||||||||||||||||||
Weighted-average assumptions, December 31 | ||||||||||||||||||||||||||||
Discount rate | 5.75 | % | 6.00 | % | 5.63 | % | 6.00 | % | 5.75 | % | 6.00 | % | ||||||||||||||||
Rate of compensation increase | 4.00 | 4.00 | 4.69 | 4.00 | n/a | n/a | ||||||||||||||||||||||
| (1) | The measurement date for the Qualified Pension Plans, Nonqualified and Other Pension Plans, and Postretirement Health and Life Plans was December 31 of each year reported. |
| (2) | The Corporation's best estimate of its contributions to be made to the Qualified Pension Plans, Nonqualified and Other Pension Plans, and Postretirement Health and Life Plans in 2010 is $0, $230 million and $116 million, respectively. |
n/a = not applicable
Amounts recognized in the Consolidated Financial Statements at December 31, 2009 and 2008 were as follows:
| Qualified Pension Plans | Nonqualified and Other Pension Plans | Postretirement Health and Life Plans | |||||||||||||||||||||||||
| (Dollars in millions) | 2009 | 2008 | 2009 | 2008 | 2009 | 2008 | |||||||||||||||||||||
Other assets | $ | 1,479 | $ | 607 | $ | 831 | $ | – | $ | – | $ | – | |||||||||||||||
Accrued expenses and other liabilities | – | (77 | ) | (1,420 | ) | (1,256 | ) | (1,507 | ) | (1,294 | ) | ||||||||||||||||
Net amount recognized at December 31 | $ | 1,479 | $ | 530 | $ | (589 | ) | $ | (1,256 | ) | $ | (1,507 | ) | $ | (1,294 | ) | |||||||||||
| 178 | Bank of America 2009 |
Net periodic benefit cost (income) for 2009, 2008 and 2007 included the following components:
| Qualified Pension Plans | Nonqualified and Other Pension Plans | Postretirement Health and Life Plans | ||||||||||||||||||||||||||||||||||||||
| (Dollars in millions) | 2009 | 2008 | 2007 | 2009 | 2008 | 2007 | 2009 | 2008 | 2007 | |||||||||||||||||||||||||||||||
Components of net periodic benefit cost (income) | ||||||||||||||||||||||||||||||||||||||||
Service cost | $ | 387 | $ | 343 | $ | 316 | $ | 34 | $ | 7 | $ | 9 | $ | 16 | $ | 16 | $ | 16 | ||||||||||||||||||||||
Interest cost | 740 | 837 | 761 | 243 | 77 | 71 | 93 | 87 | 84 | |||||||||||||||||||||||||||||||
Expected return on plan assets | (1,231 | ) | (1,444 | ) | (1,312 | ) | (222 | ) | – | – | (8 | ) | (13 | ) | (8 | ) | ||||||||||||||||||||||||
Amortization of transition obligation | – | – | – | – | – | – | 31 | 31 | 32 | |||||||||||||||||||||||||||||||
Amortization of prior service cost (credits) | 39 | 33 | 47 | (8 | ) | (8 | ) | (7 | ) | – | – | – | ||||||||||||||||||||||||||||
Amortization of net actuarial loss (gain) | 377 | 83 | 156 | 5 | 14 | 17 | (77 | ) | (81 | ) | (60 | ) | ||||||||||||||||||||||||||||
Recognized loss (gain) due to settlements | – | – | – | – | – | 14 | – | – | (2 | ) | ||||||||||||||||||||||||||||||
Recognized termination benefit costs | 36 | – | – | – | – | – | – | – | – | |||||||||||||||||||||||||||||||
Net periodic benefit cost (income) | $ | 348 | $ | (148 | ) | $ | (32 | ) | $ | 52 | $ | 90 | $ | 104 | $ | 55 | $ | 40 | $ | 62 | ||||||||||||||||||||
Weighted-average assumptions used to determine | ||||||||||||||||||||||||||||||||||||||||
Discount rate | 6.00 | % | 6.00 | % | 5.75 | % | 5.86 | % | 6.00 | % | 5.75 | % | 6.00 | % | 6.00 | % | 5.75 | % | ||||||||||||||||||||||
Expected return on plan assets | 8.00 | 8.00 | 8.00 | 5.66 | n/a | n/a | 8.00 | 8.00 | 8.00 | |||||||||||||||||||||||||||||||
Rate of compensation increase | 4.00 | 4.00 | 4.00 | 4.61 | 4.00 | 4.00 | n/a | n/a | n/a | |||||||||||||||||||||||||||||||
n/a = not applicable
The net periodic benefit cost (income) for each of the Plans in 2009 includes the results of Merrill Lynch. The net periodic benefit cost (income) of the Merrill Lynch Nonqualified and Other Pension Plans, and Postretirement Health and Life Plans was $(20) million and $18 million in 2009 using a blended discount rate of 5.59 percent at January 1, 2009. The net periodic benefit cost (income) for 2009 and 2008 includes the results of Countrywide. The net periodic benefit cost of the Countrywide Qualified Pension Plan was $29 million in 2008 using a discount rate of 6.75 percent at July 1, 2008. The net periodic benefit cost of the Countrywide Nonqualified Pension Plan was $1 million. Countrywide did not have a Postretirement Health and Life Plan.
Net periodic postretirement health and life expense was determined using the "projected unit credit" actuarial method. Gains and losses for all benefits except postretirement health care are recognized in accordance with the standard amortization provisions of the applicable accounting guidance. For the Postretirement Health Care Plans, 50 percent of the
unrecognized gain or loss at the beginning of the fiscal year (or at subsequent remeasurement) is recognized on a level basis during the year.
Assumed health care cost trend rates affect the postretirement benefit obligation and benefit cost reported for the Postretirement Health Care Plans. The assumed health care cost trend rate used to measure the expected cost of benefits covered by the Postretirement Health Care Plans was 8.00 percent for 2010, reducing in steps to 5.00 percent in 2017 and later years. A one-percentage-point increase in assumed health care cost trend rates would have increased the service and interest costs and the benefit obligation by $4 million and $57 million in 2009, $4 million and $35 million in 2008, and $5 million and $64 million in 2007. A one-percentage-point decrease in assumed health care cost trend rates would have lowered the service and interest costs and the benefit obligation by $4 million and $50 million in 2009, $4 million and $31 million in 2008, and $4 million and $54 million in 2007.
Pre-tax amounts included in accumulated OCI at December 31, 2009 and 2008 were as follows:
| Qualified Pension Plans | Nonqualified and Other Pension Plans | Postretirement Health and Life Plans | Total | |||||||||||||||||||||||||||||||
| (Dollars in millions) | 2009 | 2008 | 2009 | 2008 | 2009 | 2008 | 2009 | 2008 | ||||||||||||||||||||||||||
Net actuarial (gain) loss | $ | 5,937 | $ | 7,232 | $ | 479 | $ | 70 | $ | (106 | ) | $ | (158 | ) | $ | 6,310 | $ | 7,144 | ||||||||||||||||
Transition obligation | – | – | – | – | 95 | 126 | 95 | 126 | ||||||||||||||||||||||||||
Prior service cost (credits) | 126 | 129 | (22 | ) | (30 | ) | – | – | 104 | 99 | ||||||||||||||||||||||||
Amounts recognized in accumulated OCI | $ | 6,063 | $ | 7,361 | $ | 457 | $ | 40 | $ | (11 | ) | $ | (32 | ) | $ | 6,509 | $ | 7,369 | ||||||||||||||||
Pre-tax amounts recognized in OCI for 2009 included the following components:
| (Dollars in millions) | Qualified Pension Plans | Nonqualified and Other Pension Plans | Postretirement Health and Life Plans | Total | ||||||||||||
Other changes in plan assets and benefit obligations recognized in OCI | ||||||||||||||||
Current year actuarial (gain) loss | $ | (918 | ) | $ | 416 | $ | (24 | ) | $ | (526 | ) | |||||
Amortization of actuarial gain (loss) | (377 | ) | (8 | ) | 77 | (308 | ) | |||||||||
Current year prior service cost | 36 | – | – | 36 | ||||||||||||
Amortization of prior service credit (cost) | (39 | ) | 8 | – | (31 | ) | ||||||||||
Amortization of transition obligation | – | – | (31 | ) | (31 | ) | ||||||||||
Total recognized in OCI | $ | (1,298 | ) | $ | 416 | $ | 22 | $ | (860 | ) | ||||||
| Bank of America 2009 | 179 |
The estimated net actuarial loss and prior service cost (credits) for the Qualified Pension Plans that will be amortized from accumulated OCI into net periodic benefit cost (income) during 2010 are pre-tax amounts of $358 million and $28 million. The estimated net actuarial loss and prior service cost for the Nonqualified and Other Pension Plans that will be amortized from accumulated OCI into net periodic benefit cost (income) during 2010 are pre-tax amounts of $2 million and $(8) million. The estimated net actuarial loss and transition obligation for the Postretirement Health and Life Plans that will be amortized from accumulated OCI into net periodic benefit cost (income) during 2010 are pre-tax amounts of $(32) million and $31 million.
Plan Assets
The Qualified Pension Plans have been established as retirement vehicles for participants, and trusts have been established to secure benefits promised under the Qualified Pension Plans. The Corporation's policy is to invest the trust assets in a prudent manner for the exclusive purpose of providing benefits to participants and defraying reasonable expenses of administration. The Corporation's investment strategy is designed to provide a total return that, over the long term, increases the ratio of assets to liabilities. The strategy attempts to maximize the investment return on assets at a level of risk deemed appropriate by the Corporation while complying with ERISA and any applicable regulations and laws. The investment strategy utilizes asset allocation as a principal determinant for establishing the risk/reward profile of the assets. Asset allocation ranges are established, periodically reviewed, and adjusted as funding levels and liability characteristics change. Active and passive investment managers are employed to help enhance the risk/return profile of the assets. An additional aspect of the investment strategy used to minimize risk (part of the asset allocation plan) includes matching the equity exposure of participant-selected earnings measures. For example, the common stock of the Corporation held in the trust is maintained as an offset to the exposure related to participants who selected to receive an earnings
measure based on the return performance of common stock of the Corporation. No plan assets are expected to be returned to the Corporation during 2010.
The assets of the non-U.S. plans are primarily attributable to the U.K. pension plan. The U.K. pension plan's assets are invested prudently so that the benefits promised to members are provided with consideration given to the nature and the duration of the plan's liabilities. The current planned investment strategy was set following an asset-liability study and advice from the Trustee's investment advisors. The selected asset allocation strategy is designed to achieve a higher return than the lowest risk strategy while maintaining a prudent approach to meeting the plan's liabilities.
The Expected Return on Asset assumption (EROA assumption) was developed through analysis of historical market returns, historical asset class volatility and correlations, current market conditions, anticipated future asset allocations, the funds' past experience, and expectations on potential future market returns. The EROA assumption is determined using the calculated market-related value for the Qualified Pension Plans and the fair value for the Postretirement Health and Life Plans. The EROA assumption represents a long-term average view of the performance of the assets in the Qualified Pension Plans, the Nonqualified and Other Pension Plans, and the Postretirement Health and Life Plans, a return that may or may not be achieved during any one calendar year. Some of the building blocks used to arrive at the long-term return assumption include an implied return from equity securities of 8.75 percent, debt securities of 5.75 percent, and real estate of 7.00 percent for the Qualified Pension Plans, Nonqualified and Other Pension Plans, and Postretirement Health and Life Plans. The terminated U.S. pension plan is solely invested in a group annuity contract which was primarily invested in fixed income securities structured such that asset maturities match the duration of the plan's obligations.
The target allocations for 2010 by asset category for the Qualified Pension Plans, Nonqualified and Other Pension Plans, and Postretirement Health and Life Plans are as follows:
Asset Category
| 2010 Target Allocation | |||||||||||
| Qualified Pension Plans | Nonqualified and Other Pension Plans | Postretirement Health and Life Plans | |||||||||
| Equity securities | 60 – 80 | % | 5 – 15 | % | 50 – 75 | % | |||||
| Debt securities | 20 – 40 | 65 – 80 | 25 – 45 | ||||||||
| Real estate | 0 – 5 | 0 – 5 | 0 – 5 | ||||||||
| Other | 0 – 10 | 5 – 20 | 0 – 5 | ||||||||
Equity securities for the Qualified Pension Plans include common stock of the Corporation in the amounts of $224 million (1.54 percent of total plan assets) and $269 million (1.88 percent of total plan assets) at December 31, 2009 and 2008.
Fair Value Measurements
For information on fair value measurements, including descriptions of Level 1, 2 and 3 of the fair value hierarchy and the valuation methods employed by the Corporation, see Note 1 – Summary of Significant Accounting Principles and Note 20 – Fair Value Measurements .
| 180 | Bank of America 2009 |
Plan investment assets measured at fair value by level and in total at December 31, 2009 are summarized in the table below.
| Fair Value Measurements Using | ||||||||||||
| (Dollars in millions) | Level 1 | Level 2 | Level 3 | Total | ||||||||
Money market and interest-bearing cash | $ | 1,282 | $ | – | $ | – | $ | 1,282 | ||||
U.S. government and government agency obligations | 1,460 | 1,422 | – | 2,882 | ||||||||
Corporate debt | – | 1,301 | – | 1,301 | ||||||||
Asset-backed securities | – | 1,116 | – | 1,116 | ||||||||
Mutual funds (1) | 777 | – | – | 777 | ||||||||
Common and collective trusts (2) | – | 2,764 | 18 | 2,782 | ||||||||
Common and preferred stocks | 5,424 | – | – | 5,424 | ||||||||
Foreign equity securities | 653 | – | – | 653 | ||||||||
Foreign debt securities | 268 | 611 | 6 | 885 | ||||||||
Foreign common collective trusts | – | 289 | – | 289 | ||||||||
Foreign other | – | 18 | 266 | 284 | ||||||||
Real estate | – | – | 119 | 119 | ||||||||
Participant loans | – | – | 74 | 74 | ||||||||
Other investments | 30 | 402 | 187 | 619 | ||||||||
Total plan investment assets, at fair value | $ | 9,894 | $ | 7,923 | $ | 670 | $ | 18,487 | ||||
| (1) | Balance as of December 31, 2009 includes $386 million of international equity developed markets funds, $230 million of U.S. large cap equity funds, $68 million of U.S. small cap equity funds, $55 million of emerging market bond funds, $23 million of real estate funds, $13 million of emerging market equity funds and $2 million of short-term bond funds. |
| (2) | Balance as of December 31, 2009 includes $1 billion of U.S. large cap equity funds, $646 million of international equity developed markets funds, $883 million of intermediate-term bond funds, $149 million of short-term bond funds, $39 million of U.S. mid cap equity funds, $18 million of real estate funds, $14 million of alternative commodities funds, $10 million of emerging markets equity funds and $23 million of U.S. small cap equity funds. |
The table below presents a reconciliation of all Plan investment assets measured at fair value using significant unobservable inputs (Level 3) during 2009.
Level 3 – Fair Value Measurements
| (Dollars in millions) | Balance January 1, 2009 | Actual Return on Plan Assets Still Held at the Reporting Date (1) | Purchases, Sales and Settlements | Transfers into / (out of) Level 3 | Balance December 31, 2009 | |||||||||||
Common and Collective Trusts | $ | 26 | $ | (8 | ) | $ | – | $ | – | $ | 18 | |||||
Foreign debt securities | 7 | (1 | ) | – | – | 6 | ||||||||||
Foreign other | 328 | (100 | ) | 38 | – | 266 | ||||||||||
Real estate | 149 | (30 | ) | – | – | 119 | ||||||||||
Participant loans | 74 | – | – | – | 74 | |||||||||||
Other investments | 237 | (75 | ) | 5 | 20 | 187 | ||||||||||
Total | $ | 821 | $ | (214 | ) | $ | 43 | $ | 20 | $ | 670 | |||||
| (1) | The Corporation did not sell any level 3 plan assets during the year. |
Projected Benefit Payments
Benefit payments projected to be made from the Qualified Pension Plans, the Nonqualified and Other Pension Plans, and the Postretirement Health and Life Plans are as follows:
| Qualified Pension Plans (1) | Nonqualified and Other Pension Plans (2) | Postretirement Health and Life Plans | ||||||||||
| (Dollars in millions) | Net Payments (3) | Medicare Subsidy | ||||||||||
2010 | $ | 883 | $ | 309 | $ | 163 | $ | 20 | ||||
2011 | 896 | 265 | 166 | 20 | ||||||||
2012 | 902 | 287 | 167 | 20 | ||||||||
2013 | 900 | 285 | 167 | 21 | ||||||||
2014 | 900 | 278 | 167 | 21 | ||||||||
2015 - 2019 | 4,582 | 1,461 | 785 | 100 | ||||||||
| (1) | Benefit payments expected to be made from the plans' assets. |
| (2) | Benefit payments expected to be made from the Corporation's assets. |
| (3) | Benefit payments (net of retiree contributions) expected to be made from a combination of the plans' and the Corporation's assets. |
Defined Contribution Plans
The Corporation maintains qualified defined contribution retirement plans and nonqualified defined contribution retirement plans. As a result of the Merrill Lynch acquisition, the Corporation also maintains the defined contribution plans of Merrill Lynch which include the 401(k) Savings & Investment Plan, the Retirement and Accumulation Plan (RAP) and the Employee Stock Ownership Plan (ESOP). The Corporation contributed
approximately $605 million, $454 million and $420 million in 2009, 2008 and 2007, respectively, in cash, to the qualified defined contribution plans. At December 31, 2009 and 2008, 203 million shares and 104 million shares of the Corporation's common stock were held by plans. Payments to the plans for dividends on common stock were $8 million, $214 million and $228 million in 2009, 2008 and 2007, respectively.
| Bank of America 2009 | 181 |
In addition, certain non-U.S. employees within the Corporation are covered under defined contribution pension plans that are separately administered in accordance with local laws.
NOTE 18 – Stock-Based Compensation Plans
The compensation cost for the plans described below was $2.8 billion, $885 million and $1.2 billion in 2009, 2008 and 2007, respectively. The related income tax benefit was $1.0 billion, $328 million and $438 million for 2009, 2008 and 2007, respectively.
The table below presents the assumptions used to estimate the fair value of stock options granted on the date of grant using the lattice option-pricing model. Lattice option-pricing models incorporate ranges of assumptions for inputs and those ranges are disclosed in the table below. The risk-free interest rate for periods within the contractual life of the stock option is based on the U.S. Treasury yield curve in effect at the time of grant. Expected volatilities are based on implied volatilities from traded stock options on the Corporation's common stock, historical volatility of the Corporation's common stock, and other factors. The Corporation uses historical data to estimate stock option exercise and employee termination within the model. The expected term of stock options granted is derived from the output of the model and represents the period of time that stock options granted are expected to be outstanding. The estimates of fair value from these models are theoretical values for stock options and changes in the assumptions used in the models could result in materially different fair value estimates. The actual value of the stock options will depend on the market value of the Corporation's common stock when the stock options are exercised. No stock options were granted in 2009.
| 2008 | 2007 | |||||
Risk-free interest rate | 2.05 – 3.85 | % | 4.72 – 5.16 | % | ||
Dividend yield | 5.30 | 4.40 | ||||
Expected volatility | 26.00 – 36.00 | 16.00 – 27.00 | ||||
Weighted-average volatility | 32.80 | 19.70 | ||||
Expected lives (years) | 6.6 | 6.5 | ||||
Excluded from the table above are assumptions used to estimate the fair value of approximately 108 million stock options assumed in connection with the Merrill Lynch acquisition. The fair value of these awards was estimated using a Black-Scholes option pricing model. Similar to options valued using the lattice option-pricing model described above, key assumptions used include the implied volatility based on the Corporation's common stock of 75 percent, the risk-free interest rate based on the U.S. Treasury yield curve in effect at December 31, 2008, an expected dividend yield of 4.2 percent and the expected life of the options based on their actual remaining term.
The Corporation has equity compensation plans which include the Key Employee Stock Plan, the Key Associate Stock Plan and the Merrill Lynch Employee Stock Compensation Plan. Descriptions of the material features of the equity compensation plans follow.
Key Employee Stock Plan
The Key Employee Stock Plan, as amended and restated, provided for different types of awards including stock options, restricted stock shares and restricted stock units. Under the plan, 10-year options to purchase approximately 260 million shares of common stock were granted through
December 31, 2002 to certain employees at the closing market price on the respective grant dates. At December 31, 2009, approximately 45 million fully vested options were outstanding under this plan. No further awards may be granted.
Key Associate Stock Plan
On April 24, 2002, the shareholders approved the Key Associate Stock Plan to be effective January 1, 2003. This approval authorized and reserved 200 million shares for grant in addition to the remaining amount under the Key Employee Stock Plan as of December 31, 2002, which was approximately 34 million shares plus any shares covered by awards under the Key Employee Stock Plan that terminate, expire, lapse or are cancelled after December 31, 2002. Subsequently, the shareholders authorized an additional 282 million shares for grant under the Key Associate Stock Plan. In conjunction with the Merrill Lynch acquisition, the shareholders authorized an additional 105 million shares for grant under the Key Associate Stock Plan. At December 31, 2009, approximately 152 million options were outstanding under this plan. Approximately 90 million shares of restricted stock and restricted stock units were granted in 2009. These shares of restricted stock generally vest in three equal annual installments beginning one year from the grant date with the exception of financial advisor awards that vest eight years from grant date.
Employee Stock Compensation Plan
The Corporation assumed the Merrill Lynch Employee Stock Compensation Plan. Future shares can be granted under this plan. Approximately 34 million shares of restricted stock units were granted in 2009 which generally vest in three equal annual installments beginning one year from the grant date. Awards granted prior to 2009 generally vest in four equal annual installments beginning one year from the grant date. At December 31, 2009, there were approximately 48 million shares outstanding.
The following table presents the status of all option plans at December 31, 2009, and changes during 2009.
Employee stock options
| Shares | Weighted- average Exercise Price | |||||
Outstanding at January 1, 2009 | 232,429,057 | $ | 43.08 | |||
Merrill Lynch acquisition, January 1, 2009 | 107,521,280 | 62.89 | ||||
Exercised | (2,835 | ) | 12.56 | |||
Forfeited | (36,224,754 | ) | 46.31 | |||
Outstanding at December 31, 2009 (1) | 303,722,748 | 49.71 | ||||
Options exercisable at December 31, 2009 | 275,180,674 | 49.45 | ||||
Options vested and expected to vest (2) | 303,640,869 | 49.71 | ||||
| (1) | Includes 45 million options under the Key Employee Stock Plan, 152 million options under the Key Associate Stock Plan and 107 million options to employees of predecessor companies assumed in mergers. |
| (2) | Includes vested shares and nonvested shares after a forfeiture rate is applied. |
At December 31, 2009, the Corporation had no aggregate intrinsic value of options outstanding, exercisable, and vested and expected to vest. The weighted-average remaining contractual term of options outstanding was 3.7 years, options exercisable was 3.2 years, and options vested and expected to vest was 3.7 years at December 31, 2009.
The weighted-average grant-date fair value of options granted in 2008 and 2007 was $8.92 and $8.44. No options were granted in 2009.
| 182 | Bank of America 2009 |
The following table presents the status of the restricted stock/unit awards at December 31, 2009, and changes during 2009.
Restricted stock/unit awards
| Shares | Weighted- average Grant Date Fair Value | |||||
Outstanding at January 1, 2009 | 32,715,964 | $ | 45.45 | |||
Merrill Lynch acquisition, January 1, 2009 | 83,446,110 | 14.08 | ||||
Granted | 124,146,773 | 10.57 | ||||
Vested | (31,181,360 | ) | 31.46 | |||
Cancelled | (34,099,465 | ) | 14.39 | |||
Outstanding at December 31, 2009 | 175,028,022 | 14.30 | ||||
At December 31, 2009, there was $677 million of total unrecognized compensation cost related to share-based compensation arrangements for all awards that is expected to be recognized over a weighted-average period of 0.89 years. The total fair value of restricted stock vested in 2009 was $203 million. In 2009, the amount of cash used to settle equity instruments was $397 million.
Other Stock Plans
As a result of the Merrill Lynch acquisition, the Corporation assumed the obligations of outstanding awards granted under the Merrill Lynch Financial Advisor Capital Accumulation Award Plans (FACAAP) and the Merrill
Lynch Employee Stock Purchase Plan (ESPP). The FACAAP is no longer an active plan and no awards were granted in 2009. Awards granted in 2003 and thereafter are generally payable eight years from the grant date in a fixed number of the Corporation's common stock. For outstanding awards granted prior to 2003, payment is generally made ten years from the grant date in a fixed number of the Corporation's common stock unless the fair value of such shares is less than a specified minimum value, in which case, the minimum value is paid in cash. At December 31, 2009, there were 23 million shares outstanding under this plan.
The ESPP allows eligible associates to invest from one percent to 10 percent of eligible compensation to purchase the Corporation's common stock, subject to legal limits. Purchases were made at a discount of up to five percent of the average high and low market price on the relevant purchase date and the maximum annual contribution per employee was $23,750 in 2009. Up to 107 million shares have been authorized for issuance under the ESPP in 2009. The activity during 2009 is as follows:
| Shares | |||
Available at January 1, 2009 | 16,449,696 | ||
Purchased through plan | (4,019,593 | ) | |
Available at December 31, 2009 | 12,430,103 | ||
The weighted-average fair value of the ESPP stock purchase rights (i.e. the five percent discount on the Corporation's common stock purchases) exercised by employees in 2009 is $0.57 per stock purchase right.
NOTE 19 – Income Taxes
The components of income tax expense (benefit) for 2009, 2008 and 2007 were as follows:
| (Dollars in millions) | 2009 | 2008 | 2007 | |||||||||
Current income tax expense (benefit) | ||||||||||||
Federal | $ | (3,576 | ) | $ | 5,075 | $ | 5,210 | |||||
State | 555 | 561 | 681 | |||||||||
Foreign | 735 | 585 | 804 | |||||||||
Total current expense (benefit) | (2,286 | ) | 6,221 | 6,695 | ||||||||
Deferred income tax expense (benefit) | ||||||||||||
Federal | 792 | (5,269 | ) | (710 | ) | |||||||
State | (620 | ) | (520 | ) | (18 | ) | ||||||
Foreign | 198 | (12 | ) | (25 | ) | |||||||
Total deferred expense (benefit) | 370 | (5,801 | ) | (753 | ) | |||||||
Total income tax expense (benefit) (1) | $ | (1,916 | ) | $ | 420 | $ | 5,942 | |||||
| (1) | Does not reflect the deferred tax effects of unrealized gains and losses on AFS debt and marketable equity securities, foreign currency translation adjustments, derivatives and employee benefit plan adjustments that are included in accumulated OCI. As a result of these tax effects, accumulated OCI decreased $1.6 billion in 2009, increased $5.9 billion in 2008 and decreased $5.0 billion in 2007. Also, does not reflect the tax effects associated with the Corporation's employee stock plans which decreased common stock and additional paid-in capital $295 million and $9 million in 2009 and 2008, and increased common stock and additional paid-in capital $251 million in 2007. Goodwill was reduced $0, $9 million and $47 million in 2009, 2008 and 2007, respectively, reflecting certain tax benefits attributable to exercises of employee stock options issued by acquired companies which had vested prior to the merger dates. |
| Bank of America 2009 | 183 |
Income tax expense (benefit) for 2009, 2008 and 2007 varied from the amount computed by applying the statutory income tax rate to income before income taxes. A reconciliation between the expected federal
income tax expense using the federal statutory tax rate of 35 percent to the Corporation's actual income tax expense (benefit) and resulting effective tax rate for 2009, 2008 and 2007 is presented in the following table.
| 2009 | 2008 | 2007 | |||||||||||||||||||||||
| (Dollars in millions) | Amount | Percent | Amount | Percent | Amount | Percent | |||||||||||||||||||
Expected federal income tax expense | $ | 1,526 | 35.0 | % | $ | 1,550 | 35.0 | % | $ | 7,323 | 35.0 | % | |||||||||||||
Increase (decrease) in taxes resulting from: | |||||||||||||||||||||||||
State tax expense (benefit), net of federal effect | (42 | ) | (1.0 | ) | 27 | 0.6 | 431 | 2.1 | |||||||||||||||||
Tax-exempt income, including dividends | (863 | ) | (19.8 | ) | (631 | ) | (14.3 | ) | (683 | ) | (3.3 | ) | |||||||||||||
Foreign tax differential | (709 | ) | (16.3 | ) | (192 | ) | (4.3 | ) | (485 | ) | (2.3 | ) | |||||||||||||
Low income housing credits/other credits | (668 | ) | (15.3 | ) | (722 | ) | (16.3 | ) | (590 | ) | (2.8 | ) | |||||||||||||
Change in U.S. federal valuation allowance | (650 | ) | (14.9 | ) | – | – | – | – | |||||||||||||||||
Loss on certain foreign subsidiary stock | (595 | ) | (13.7 | ) | – | – | – | – | |||||||||||||||||
Non-U.S. leasing - restructuring | – | – | – | – | (221 | ) | (1.1 | ) | |||||||||||||||||
Leveraged lease tax differential | 59 | 1.4 | 216 | 4.9 | 148 | 0.7 | |||||||||||||||||||
Changes in prior period UTBs (including interest) | 87 | 2.0 | 169 | 3.8 | 143 | 0.7 | |||||||||||||||||||
Other | (61 | ) | (1.4 | ) | 3 | 0.1 | (124 | ) | (0.6 | ) | |||||||||||||||
Total income tax expense (benefit) | $ | (1,916 | ) | (44.0 | )% | $ | 420 | 9.5 | % | $ | 5,942 | 28.4 | % | ||||||||||||
The reconciliation of the beginning unrecognized tax benefits (UTB) balance to the ending balance is presented in the following table.
Reconciliation of the Change in Unrecognized Tax Benefits
| (Dollars in millions) | 2009 | 2008 | 2007 | |||||||||
Beginning balance | $ | 3,541 | $ | 3,095 | $ | 2,667 | ||||||
Increases related to positions taken during prior years | 791 | 688 | 67 | |||||||||
Increases related to positions taken during the current year | 181 | 241 | 456 | |||||||||
Positions acquired or assumed in business combinations | 1,924 | 169 | 328 | |||||||||
Decreases related to positions taken during prior years | (554 | ) | (371 | ) | (227 | ) | ||||||
Settlements | (615 | ) | (209 | ) | (108 | ) | ||||||
Expiration of statute of limitations | (15 | ) | (72 | ) | (88 | ) | ||||||
Ending balance | $ | 5,253 | $ | 3,541 | $ | 3,095 | ||||||
As of December 31, 2009, 2008 and 2007, the balance of the Corporation's UTBs which would, if recognized, affect the Corporation's effective tax rate was $4.0 billion, $2.6 billion and $1.8 billion, respectively. Included in the UTB balance are some items, the recognition of which would not affect the effective tax rate, such as the tax effect of certain temporary differences, the portion of gross state UTBs that would be offset by the tax benefit of the associated federal deduction and the portion of gross foreign UTBs that would be offset by tax reductions in other jurisdictions.
The Corporation is under examination by the IRS and other tax authorities in countries and states in which it has significant business operations. The table below summarizes the status of significant U.S. federal examinations (unless otherwise noted) for the Corporation and various acquired subsidiaries as of December 31, 2009.
| Years under examination (1) | Status at December 31, 2009 | |||
Bank of America Corporation | 2000-2002 | In Appeals process | ||
Bank of America Corporation | 2003-2005 | Field examination | ||
Merrill Lynch – U.S. | 2004 | In Appeals process | ||
Merrill Lynch – U.S. | 2005-2007 | Field examination | ||
Merrill Lynch – U.K. | 2007 | Field examination | ||
FleetBoston | 1997-2000 | In Appeals process | ||
FleetBoston | 2001-2004 | Field examination | ||
LaSalle | 2003-2005 | Field examination | ||
Countrywide | 2005-2006 | Field examination | ||
Countrywide | 2007 | Field examination | ||
| (1) | All tax years in material jurisdictions subsequent to the above years remain open to examination. |
In addition to the above examinations, the Corporation is in the process of appealing an adverse decision by the U.S. Tax Court with respect to a 1987 Merrill Lynch transaction. The income tax associated with this matter has been remitted and is included in the UTB balance above.
With the exception of the 2003 through 2005 tax years of Bank of America and the issues for which protests have been filed for Bank of America and Merrill Lynch as described below, it is reasonably possible that all above U.S. federal examinations will be concluded during the next twelve months.
During 2008, the IRS announced a settlement initiative related to lease-in, lease-out (LILO) and sale-in, lease-out (SILO) leveraged lease transactions. The Corporation executed closing agreements under this settlement initiative in late 2009 for all of these transactions for Bank of America Corporation and predecessor companies. Determinations of final tax and interest are expected to be finalized by the end of the first quarter of 2010. As a result of prior remittances, the Corporation does not expect to pay additional tax and interest related to the settlement initiative.
The remaining unagreed proposed adjustment for Bank of America Corporation for 2000 through 2002 tax years is the disallowance of foreign tax credits related to certain structured investment transactions. The Corporation continues to believe the crediting of these foreign taxes against U.S. income taxes was appropriate and has filed a protest to that effect with the Appeals Office.
The IRS proposed adjustments for two issues in the audit of Merrill Lynch for the tax year 2004 which have been protested to the Appeals Office. The issues involve eligibility for the dividends received deduction
| 184 | Bank of America 2009 |
and foreign tax credits with respect to a structured investment transaction. The Corporation also intends to protest any adjustments the IRS proposes for these same issues in tax years 2005 through 2007.
In 2005 and 2008, Merrill Lynch paid income tax assessments for the fiscal years April 1, 1998 through March 31, 2007 in relation to the taxation of income that was originally reported in other jurisdictions, primarily the U.S. Upon making these payments, Merrill Lynch began the process of obtaining clarification from international tax authorities on the appropriate allocation of income among multiple jurisdictions (Competent Authority) to prevent double taxation of the income. During 2009, an agreement was reached between Japan and the U.S. on the allocation of income during these years. The impact of these settlements resulted in UTB decreases that are reflected in the previous table. All tax years in Japan subsequent to those settled remain open to examination.
The Corporation files income tax returns in more than 100 state and foreign jurisdictions each year and is under continuous examination by various state and foreign taxing authorities. While many of these examinations are resolved every year, the Corporation does not anticipate that resolutions occurring within the next twelve months would result in a material change to the Corporation's financial position.
During 2009, the Corporation resolved many state examinations and issues under state audits. The most significant of these settlements, all of which resulted in UTB decreases, were with California and New York.
Considering all federal and foreign examinations, it is reasonably possible that the UTB balance will decrease by as much as $1.3 billion during the next twelve months, since resolved items would be removed from the balance whether their resolution resulted in payment or recognition.
During 2009 and 2008, the Corporation recognized in income tax expense, $184 million and $147 million of interest and penalties, net of tax. As of December 31, 2009 and 2008, the Corporation's accrual for interest and penalties that related to income taxes, net of taxes and remittances, was $1.1 billion and $677 million.
Significant components of the Corporation's net deferred tax assets and liabilities at December 31, 2009 and 2008 are presented in the following table.
| December 31 | ||||||||
| (Dollars in millions) | 2009 | 2008 | ||||||
Deferred tax assets | ||||||||
Net operating loss carryforwards (NOL) | $ | 17,236 | $ | 1,263 | ||||
Allowance for credit losses | 13,011 | 8,042 | ||||||
Security and loan valuations | 4,590 | 5,590 | ||||||
Employee compensation and retirement benefits | 4,021 | 2,409 | ||||||
Capital loss carryforwards | 3,187 | – | ||||||
Other tax credit carryforwards | 2,263 | – | ||||||
Accrued expenses | 2,134 | 2,271 | ||||||
State income taxes | 1,636 | 279 | ||||||
Available-for-sale securities | – | 1,149 | ||||||
Other | 2,308 | 1,987 | ||||||
Gross deferred tax assets | 50,386 | 22,990 | ||||||
Valuation allowance | (4,315 | ) | (272 | ) | ||||
Total deferred tax assets, net of | 46,071 | 22,718 | ||||||
Deferred tax liabilities | ||||||||
Mortgage servicing rights | 5,663 | 3,404 | ||||||
Long-term borrowings | 3,320 | – | ||||||
Intangibles | 2,497 | 1,712 | ||||||
Equipment lease financing | 2,411 | 5,720 | ||||||
Fee income | 1,382 | 1,637 | ||||||
Available-for-sale securities | 878 | – | ||||||
Other | 2,641 | 1,549 | ||||||
Gross deferred liabilities | 18,792 | 14,022 | ||||||
Net deferred tax assets ( 1 ) | $ | 27,279 | $ | 8,696 | ||||
| (1) | The Corporation's net deferred tax assets were adjusted during 2009 and 2008 to include $20.6 billion and $3.5 billion of net deferred tax assets related to business combinations. |
The following table summarizes the deferred tax assets and related valuation allowances recognized for the net operating and other loss carryforwards and tax credit carryforwards at December 31, 2009.
| (Dollars in millions) | Deferred Tax Asset | Valuation Allowance | Net Deferred Tax Asset | First Year Expiring | |||||||||
Net operating losses – U.S. | $ | 7,378 | $ | – | $ | 7,378 | After 2027 | ||||||
Net operating losses – U.K. | 9,817 | – | 9,817 | None | (1) | ||||||||
Net operating losses – U.S. states (2) | 1,232 | (443 | ) | 789 | Various | ||||||||
Net operating losses – other | 41 | (41 | ) | – | Various | ||||||||
Capital losses | 3,187 | (3,187 | ) | – | After 2013 | ||||||||
General business credits | 1,525 | – | 1,525 | After 2027 | |||||||||
Alternative minimum tax credits | 123 | – | 123 | None | |||||||||
Foreign tax credits | 615 | (306 | ) | 309 | After 2017 | ||||||||
| (1) | The U.K. NOL may be carried forward indefinitely. Due to change-in-control limitations in the three years prior to and following the change in ownership, this unlimited carryforward period may be jeopardized by certain major changes in the nature or conduct of the U.K. businesses. |
| (2 ) | The NOL and related valuation allowance for U.S. states before considering the benefit of federal deductions were $1.9 billion and $682 million. |
With the acquisition of Merrill Lynch on January 1, 2009, the Corporation established a valuation allowance to reduce certain deferred tax assets to the amount more-likely-than-not to be realized before their expiration. During 2009, the Corporation released $650 million of the valuation allowance attributable to Merrill Lynch's capital loss carryforward due to utilization against net capital gains generated in 2009. The valuation allowance also increased by $139 million due to increases in operating loss carryforwards and other deferred tax assets generated in certain state and foreign jurisdictions for which management believes it is more-likely-than-not that realization of these assets will not occur.
The Corporation concluded that no valuation allowance is necessary to reduce the U.K. NOL, U.S. federal NOL, and general business credit carryforwards since estimated future taxable income will be sufficient to utilize
these assets prior to their expiration. Merrill Lynch also has U.S. federal capital loss and foreign tax credit carryforwards against which valuation allowances have been recorded to reduce the assets to the amounts the Corporation believes are more-likely-than-not to be realized.
At December 31, 2009 and 2008, federal income taxes had not been provided on $16.7 billion and $6.5 billion of undistributed earnings of foreign subsidiaries earned prior to 1987 and after 1997 that have been reinvested for an indefinite period of time. If the earnings were distributed, an additional $2.5 billion and $1.1 billion of tax expense, net of credits for foreign taxes paid on such earnings and for the related foreign withholding taxes, would have resulted as of December 31, 2009 and 2008.
| Bank of America 2009 | 185 |
NOTE 20 – Fair Value Measurements
Under applicable accounting guidance, fair value is defined as the exchange price that would be received for an asset or paid to transfer a liability (an exit price) in the principal or most advantageous market for the asset or liability in an orderly transaction between market participants on the measurement date. The Corporation determines the fair values of its financial instruments based on the fair value hierarchy established under applicable accounting guidance which requires an entity to maximize the use of observable inputs and minimize the use of unobservable inputs when measuring fair value. There are three levels of inputs that may be used to measure fair value. The Corporation accounts for certain corporate loans and loan commitments, LHFS, structured reverse repurchase agreements, long-term deposits and long-term debt under the fair value option. For a detailed discussion regarding the fair value hierarchy and how the Corporation measures fair value, see Note 1 – Summary of Significant Accounting Principles .
Level 1, 2 and 3 Valuation Techniques
Financial instruments are considered Level 1 when valuation can be based on quoted prices in active markets for identical assets or liabilities. Level 2 financial instruments are valued using quoted prices for similar assets or liabilities, quoted prices in markets that are not active, or models using inputs that are observable or can be corroborated by observable market data of substantially the full term of the assets or liabilities. Financial instruments are considered Level 3 when their values are determined using pricing models, discounted cash flow methodologies or similar techniques, and at least one significant model assumption or input is unobservable and when determination of the fair value requires significant management judgment or estimation.
The Corporation also uses market indices for direct inputs to certain models where the cash settlement is directly linked to appreciation or depreciation of that particular index (primarily in the context of structured credit products). In those cases, no material adjustments are made to the index-based values. In other cases, market indices are also used as inputs to valuation, but are adjusted for trade specific factors such as rating, credit quality, vintage and other factors.
Trading Account Assets and Liabilities and Available-for-Sale Debt Securities
The fair values of trading account assets and liabilities are primarily based on actively traded markets where prices are based on either direct market quotes or observed transactions. The fair values of AFS debt securities are generally based on quoted market prices or market prices for similar assets. Liquidity is a significant factor in the determination of the fair values of trading account assets and liabilities and AFS debt securities. Market price quotes may not be readily available for some positions, or positions within a market sector where trading activity has slowed significantly or ceased such as certain CDO positions and other ABS. Some of these instruments are valued using a net asset value approach which considers the value of the underlying securities. Underlying assets are valued using external pricing services, where available, or matrix pricing based on the vintages and ratings. Situations of illiquidity generally are triggered by the market's perception of credit uncertainty regarding a single company or a specific market sector. In these instances, fair value is determined based on limited available market information and other factors, principally from reviewing the issuer's
financial statements and changes in credit ratings made by one or more ratings agencies.
Derivative Assets and Liabilities
The fair values of derivative assets and liabilities traded in the over-the-counter market are determined using quantitative models that require the use of multiple market inputs including interest rates, prices and indices to generate continuous yield or pricing curves and volatility factors, which are used to value the position. The majority of market inputs are actively quoted and can be validated through external sources, including brokers, market transactions and third-party pricing services. Estimation risk is greater for derivative asset and liability positions that are either option-based or have longer maturity dates where observable market inputs are less readily available or are unobservable, in which case, quantitative-based extrapolations of rate, price or index scenarios are used in determining fair values. The fair values of derivative assets and liabilities include adjustments for market liquidity, counterparty credit quality and other deal specific factors, where appropriate. The Corporation incorporates within its fair value measurements of over-the-counter derivatives the net credit differential between the counterparty credit risk and the Corporation's own credit risk. An estimate of severity of loss is also used in the determination of fair value, primarily based on market data.
Corporate Loans and Loan Commitments
The fair values of loans and loan commitments are based on market prices, where available, or discounted cash flow analyses using market-based credit spreads of comparable debt instruments or credit derivatives of the specific borrower or comparable borrowers. Results of discounted cash flow calculations may be adjusted, as appropriate, to reflect other market conditions or the perceived credit risk of the borrower.
Mortgage Servicing Rights
The fair values of MSRs are determined using models which depend on estimates of prepayment rates, the resultant weighted-average lives of the MSRs and the OAS levels. For more information on MSRs, see Note 22 – Mortgage Servicing Rights .
Loans Held-for-Sale
The fair values of LHFS are based on quoted market prices, where available, or are determined by discounting estimated cash flows using interest rates approximating the Corporation's current origination rates for similar loans adjusted to reflect the inherent credit risk.
Other Assets
The Corporation estimates the fair values of certain other assets including AFS marketable equity securities and certain retained residual interests in securitization vehicles. The fair values of AFS marketable equity securities are generally based on quoted market prices or market prices for similar assets. However, non-public investments are initially valued at the transaction price and subsequently adjusted when evidence is available to support such adjustments. The fair value of retained residual interests in securitization vehicles are based on certain observable inputs such as interest rates and credit spreads, as well as unobservable inputs such as estimated net charge-off and payment rates.
| 186 | Bank of America 2009 |
Securities Financing Agreements
The fair values of certain reverse repurchase arrangements, repurchase arrangements and securities borrowed transactions are determined using quantitative models, including discounted cash flow models that require the use of multiple market inputs including interest rates and spreads to generate continuous yield or pricing curves and volatility factors. The majority of market inputs are actively quoted and can be validated through external sources, including brokers, market transactions and third party pricing services.
Deposits, Commercial Paper and Other Short-term Borrowings, and Certain Structured Notes Classified as Long-term Debt
The fair values of deposits, commercial paper and other short-term borrowings, and certain structured notes that are classified as long-term debt are determined using quantitative models, including discounted cash
flow models that require the use of multiple market inputs including interest rates and spreads to generate continuous yield or pricing curves and volatility factors. The majority of market inputs are actively quoted and can be validated through external sources, including brokers, market transactions and third party pricing services. The Corporation considers the impact of its own creditworthiness in the valuation of these liabilities. The credit risk is determined by reference to observable credit spreads in the secondary cash market.
Asset-backed Secured Financings
The fair values of asset-backed secured financings are based on external broker bids, where available, or are determined by discounting estimated cash flows using interest rates approximating the Corporation's current origination rates for similar loans adjusted to reflect the inherent credit risk.
Recurring Fair Value
Assets and liabilities carried at fair value on a recurring basis at December 31, 2009, including financial instruments which the Corporation accounts for under the fair value option, are summarized in the table below.
| December 31, 2009 | ||||||||||||||||
| Fair Value Measurements Using | ||||||||||||||||
| (Dollars in millions) | Level 1 | Level 2 | Level 3 | Netting Adjustments (1) | Assets/Liabilities at Fair Value | |||||||||||
Assets | ||||||||||||||||
Federal funds sold and securities borrowed or purchased under agreements to resell | $ | – | $ | 57,775 | $ | – | $ | – | $ | 57,775 | ||||||
Trading account assets: | ||||||||||||||||
U.S. government and agency securities | 17,140 | 27,445 | – | – | 44,585 | |||||||||||
Corporate securities, trading loans and other | 4,772 | 41,157 | 11,080 | – | 57,009 | |||||||||||
Equity securities | 25,274 | 7,204 | 1,084 | – | 33,562 | |||||||||||
Foreign sovereign debt | 18,353 | 8,647 | 1,143 | – | 28,143 | |||||||||||
Mortgage trading loans and asset-backed securities | – | 11,137 | 7,770 | – | 18,907 | |||||||||||
Total trading account assets | 65,539 | 95,590 | 21,077 | – | 182,206 | |||||||||||
Derivative assets | 3,326 | 1,467,855 | 23,048 | (1,413,540 | ) | 80,689 | ||||||||||
Available-for-sale debt securities: | ||||||||||||||||
U.S. Treasury securities and agency debentures | 19,571 | 3,454 | – | – | 23,025 | |||||||||||
Mortgage-backed securities: | ||||||||||||||||
Agency | – | 166,246 | – | – | 166,246 | |||||||||||
Agency-collateralized mortgage obligations | – | 25,781 | – | – | 25,781 | |||||||||||
Non-agency residential | – | 27,887 | 7,216 | – | 35,103 | |||||||||||
Non-agency commercial | – | 6,651 | 258 | – | 6,909 | |||||||||||
Foreign securities | 158 | 3,271 | 468 | – | 3,897 | |||||||||||
Corporate/Agency bonds | – | 5,265 | 927 | – | 6,192 | |||||||||||
Other taxable securities | 676 | 14,017 | 4,549 | – | 19,242 | |||||||||||
Tax-exempt securities | – | 8,278 | 6,928 | – | 15,206 | |||||||||||
Total available-for-sale debt securities | 20,405 | 260,850 | 20,346 | – | 301,601 | |||||||||||
Loans and leases | – | – | 4,936 | – | 4,936 | |||||||||||
Mortgage servicing rights | – | – | 19,465 | – | 19,465 | |||||||||||
Loans held-for-sale | – | 25,853 | 6,942 | – | 32,795 | |||||||||||
Other assets | 35,411 | 12,677 | 7,821 | – | 55,909 | |||||||||||
Total assets | $ | 124,681 | $ | 1,920,600 | $ | 103,635 | $ | (1,413,540 | ) | $ | 735,376 | |||||
Liabilities | ||||||||||||||||
Interest-bearing deposits in domestic offices | $ | – | $ | 1,663 | $ | – | $ | – | $ | 1,663 | ||||||
Federal funds purchased and securities loaned or sold under agreements to repurchase | – | 37,325 | – | – | 37,325 | |||||||||||
Trading account liabilities: | ||||||||||||||||
U.S. government and agency securities | 22,339 | 4,180 | – | – | 26,519 | |||||||||||
Equity securities | 17,300 | 1,107 | – | – | 18,407 | |||||||||||
Foreign sovereign debt | 12,028 | 483 | 386 | – | 12,897 | |||||||||||
Corporate securities and other | 282 | 7,317 | 10 | – | 7,609 | |||||||||||
Total trading account liabilities | 51,949 | 13,087 | 396 | – | 65,432 | |||||||||||
Derivative liabilities | 2,925 | 1,443,494 | 15,185 | (1,417,876 | ) | 43,728 | ||||||||||
Commercial paper and other short-term borrowings | – | 813 | – | – | 813 | |||||||||||
Accrued expenses and other liabilities | 16,797 | 620 | 1,598 | – | 19,015 | |||||||||||
Long-term debt | – | 40,791 | 4,660 | – | 45,451 | |||||||||||
Total liabilities | $ | 71,671 | $ | 1,537,793 | $ | 21,839 | $ | (1,417,876 | ) | $ | 213,427 | |||||
| (1) | Amounts represent the impact of legally enforceable master netting agreements that allow the Corporation to settle positive and negative positions and also cash collateral held or placed with the same counterparties. |
| Bank of America 2009 | 187 |
Assets and liabilities carried at fair value on a recurring basis at December 31, 2008, including financial instruments which the Corporation accounts for under the fair value option, are summarized in the table below.
| December 31, 2008 | ||||||||||||||||
| Fair Value Measurements Using | ||||||||||||||||
| (Dollars in millions) | Level 1 | Level 2 | Level 3 | Netting Adjustments (1) | Assets/Liabilities at Fair Value | |||||||||||
Assets | ||||||||||||||||
Federal funds sold and securities borrowed or purchased under agreements to resell | $ | – | $ | 2,330 | $ | – | $ | – | $ | 2,330 | ||||||
Trading account assets | 44,571 | 83,011 | 6,733 | – | 134,315 | |||||||||||
Derivative assets | 2,109 | 1,525,106 | 8,289 | (1,473,252 | ) | 62,252 | ||||||||||
Available-for-sale debt securities | 2,789 | 255,413 | 18,702 | – | 276,904 | |||||||||||
Loans and leases | – | – | 5,413 | – | 5,413 | |||||||||||
Mortgage servicing rights | – | – | 12,733 | – | 12,733 | |||||||||||
Loans held-for-sale | – | 15,582 | 3,382 | – | 18,964 | |||||||||||
Other assets | 25,407 | 25,549 | 4,157 | – | 55,113 | |||||||||||
Total assets | $ | 74,876 | $ | 1,906,991 | $ | 59,409 | $ | (1,473,252 | ) | $ | 568,024 | |||||
Liabilities | ||||||||||||||||
Interest-bearing deposits in domestic offices | $ | – | $ | 1,717 | $ | – | $ | – | $ | 1,717 | ||||||
Trading account liabilities | 37,410 | 14,313 | – | – | 51,723 | |||||||||||
Derivative liabilities | 4,872 | 1,488,509 | 6,019 | (1,468,691 | ) | 30,709 | ||||||||||
Accrued expenses and other liabilities | 5,602 | – | 1,940 | – | 7,542 | |||||||||||
Total liabilities | $ | 47,884 | $ | 1,504,539 | $ | 7,959 | $ | (1,468,691 | ) | $ | 91,691 | |||||
| (1) | Amounts represent the impact of legally enforceable master netting agreements that allow the Corporation to settle positive and negative positions and also cash collateral held or placed with the same counterparties. |
| 188 | Bank of America 2009 |
The tables below present a reconciliation of all assets and liabilities measured at fair value on a recurring basis using significant unobservable inputs (Level 3) during 2009, 2008 and 2007, including realized and unrealized gains (losses) included in earnings and accumulated OCI.
Level 3 Fair Value Measurements
| 2009 | ||||||||||||||||||||||||||||
| (Dollars in millions) | Balance January 1, 2009 (1) | Merrill Lynch Acquisition | Gains (Losses) Included
in | Gains (Losses) Included | Purchases, Issuances and Settlements | Transfers into / (out of) Level 3 (1) | Balance December 31, 2009 (1) | |||||||||||||||||||||
Trading account assets: | ||||||||||||||||||||||||||||
Corporate securities, trading loans and other | $ | 4,540 | $ | 7,012 | $ | 370 | $ | – | $ | (2,015 | ) | $ | 1,173 | $ | 11,080 | |||||||||||||
Equity securities | 546 | 3,848 | (396 | ) | – | (2,425 | ) | (489 | ) | 1,084 | ||||||||||||||||||
Foreign sovereign debt | – | 30 | 136 | – | 167 | 810 | 1,143 | |||||||||||||||||||||
Mortgage trading loans and asset-backed securities | 1,647 | 7,294 | (262 | ) | – | 933 | (1,842 | ) | 7,770 | |||||||||||||||||||
Total trading account assets | 6,733 | 18,184 | (152 | ) | – | (3,340 | ) | (348 | ) | 21,077 | ||||||||||||||||||
Net derivative assets (2) | 2,270 | 2,307 | 5,526 | – | (7,906 | ) | 5,666 | 7,863 | ||||||||||||||||||||
Available-for-sale debt securities: | ||||||||||||||||||||||||||||
Non-agency MBS: | ||||||||||||||||||||||||||||
Residential | 5,439 | 2,509 | (1,159 | ) | 2,738 | (4,187 | ) | 1,876 | 7,216 | |||||||||||||||||||
Commercial | 657 | – | (185 | ) | (7 | ) | (155 | ) | (52 | ) | 258 | |||||||||||||||||
Foreign securities | 1,247 | – | (79 | ) | (226 | ) | (73 | ) | (401 | ) | 468 | |||||||||||||||||
Corporate/Agency bonds | 1,598 | – | (22 | ) | 127 | 324 | (1,100 | ) | 927 | |||||||||||||||||||
Other taxable securities | 9,599 | – | (75 | ) | 669 | (4,490 | ) | (1,154 | ) | 4,549 | ||||||||||||||||||
Tax-exempt securities | 162 | – | 2 | 26 | 6,093 | 645 | 6,928 | |||||||||||||||||||||
Total available-for-sale debt securities | 18,702 | 2,509 | (1,518 | ) | 3,327 | (2,488 | ) | (186 | ) | 20,346 | ||||||||||||||||||
Loans and leases (3) | 5,413 | 2,452 | 515 | – | (3,718 | ) | 274 | 4,936 | ||||||||||||||||||||
Mortgage servicing rights | 12,733 | 209 | 5,286 | – | 1,237 | – | 19,465 | |||||||||||||||||||||
Loans held-for-sale (3) | 3,382 | 3,872 | 678 | – | (1,048 | ) | 58 | 6,942 | ||||||||||||||||||||
Other assets (4) | 4,157 | 2,696 | 1,273 | – | (308 | ) | 3 | 7,821 | ||||||||||||||||||||
Trading account liabilities: | ||||||||||||||||||||||||||||
Foreign sovereign debt | – | – | (38 | ) | – | – | (348 | ) | (386 | ) | ||||||||||||||||||
Corporate securities and other | – | – | – | – | 4 | (14 | ) | (10 | ) | |||||||||||||||||||
Total trading account liabilities | – | – | (38 | ) | – | 4 | (362 | ) | (396 | ) | ||||||||||||||||||
Accrued expenses and other | (1,940 | ) | (1,337 | ) | 1,385 | – | 294 | – | (1,598 | ) | ||||||||||||||||||
Long-term debt (3) | – | (7,481 | ) | (2,310 | ) | – | 830 | 4,301 | (4,660 | ) | ||||||||||||||||||
| 2008 | ||||||||||||||||||||||||||||
| (Dollars in millions) | Balance January 1, 2008 (1) | Countrywide Acquisition | Gains Included in | Gains Included | Purchases, Issuances and Settlements | Transfers Level 3 (1) | Balance December 31, | |||||||||||||||||||||
Trading account assets | $ | 4,027 | $ | – | $ | (3,222 | ) | $ | – | $ | (1,233 | ) | $ | 7,161 | $ | 6,733 | ||||||||||||
Net derivative assets (2) | (1,203 | ) | (185 | ) | 2,531 | – | 1,380 | (253 | ) | 2,270 | ||||||||||||||||||
Available-for-sale debt securities | 5,507 | 528 | (2,509 | ) | (1,688 | ) | 2,754 | 14,110 | 18,702 | |||||||||||||||||||
Loans and leases (3) | 4,590 | – | (780 | ) | – | 1,603 | – | 5,413 | ||||||||||||||||||||
Mortgage servicing rights | 3,053 | 17,188 | (7,115 | ) | – | (393 | ) | – | 12,733 | |||||||||||||||||||
Loans held-for-sale (3) | 1,334 | 1,425 | (1,047 | ) | – | (542 | ) | 2,212 | 3,382 | |||||||||||||||||||
Other assets (4) | 3,987 | 1,407 | 175 | – | (1,372 | ) | (40 | ) | 4,157 | |||||||||||||||||||
Accrued expenses and other | (660 | ) | (1,212 | ) | (169 | ) | – | 101 | – | (1,940 | ) | |||||||||||||||||
| (1) | Assets (liabilities) |
| (2) | Net derivatives at December 31, 2009 and 2008 include derivative assets of $23.0 billion and $8.3 billion and derivative liabilities of $15.2 billion and $6.0 billion, respectively. |
| (3) | Amounts represent items which are accounted for under the fair value option including commercial loans, loan commitments and LHFS. |
| (4) | Other assets is primarily comprised of AFS marketable equity securities and other equity investments. |
| Bank of America 2009 | 189 |
Level 3 Fair Value Measurements
| 2007 | ||||||||||||||||||||||||
| (Dollars in millions) | Balance January 1, 2007 (1) | Gains (Losses) Included in | Gains Included | Purchases, Issuances, and Settlements | Transfers into / (out of) | Balance December 31, | ||||||||||||||||||
Trading account assets (2) | $ | 303 | $ | (2,959 | ) | $ | – | $ | 708 | $ | 5,975 | $ | 4,027 | |||||||||||
Net derivative assets (3) | 788 | (341 | ) | – | (333 | ) | (1,317 | ) | (1,203 | ) | ||||||||||||||
Available-for-sale debt securities (2) | 1,133 | (398 | ) | (206 | ) | 4,588 | 390 | 5,507 | ||||||||||||||||
Loans and leases | 3,947 | (140 | ) | – | 783 | – | 4,590 | |||||||||||||||||
Mortgage servicing rights (2) | 2,869 | 231 | – | (47 | ) | – | 3,053 | |||||||||||||||||
Loans held-for-sale (2) | – | (90 | ) | – | (1,259 | ) | 2,683 | 1,334 | ||||||||||||||||
Other assets (4) | 6,605 | 2,149 | (79 | ) | (4,638 | ) | (50 | ) | 3,987 | |||||||||||||||
Accrued expenses and other liabilities | (349 | ) | (279 | ) | – | (32 | ) | – | (660 | ) | ||||||||||||||
| (1) | Assets (liabilities) |
| (2) | Amounts represent items which were carried at fair value prior to the adoption of the fair value option. |
| (3) | Net derivatives at December 31, 2007 included derivative assets of $9.0 billion and derivative liabilities of $10.2 billion. Amounts at January 1, 2007 were accounted for at fair value prior to the adoption of the fair value option. |
| (4) | Other assets is primarily comprised of AFS marketable equity securities and other equity investments. |
| 190 | Bank of America 2009 |
The tables below summarize gains and losses due to changes in fair value, including both realized and unrealized gains (losses), recorded in earnings for Level 3 assets and liabilities during 2009, 2008 and 2007. These amounts include those gains (losses) generated by loans, LHFS, loan commitments and structured notes which are accounted for under the fair value option.
Level 3 Total Realized and Unrealized Gains (Losses) Included in Earnings
| 2009 | ||||||||||||||||||||||
| (Dollars in millions) | Card Income (Loss) | Equity Investment Income | Trading Account Profits (Losses) | Mortgage Banking Income (Loss) (1) | Other Income (Loss) | Total | ||||||||||||||||
Trading account assets: | ||||||||||||||||||||||
Corporate securities, trading loans and other | $ | – | $ | – | $ | 370 | $ | – | $ | – | $ | 370 | ||||||||||
Equity securities | – | – | (396 | ) | – | – | (396 | ) | ||||||||||||||
Foreign sovereign debt | – | – | 136 | – | – | 136 | ||||||||||||||||
Mortgage trading loans and asset-backed securities | – | – | (262 | ) | – | – | (262 | ) | ||||||||||||||
Total trading account assets | – | – | (152 | ) | – | – | (152 | ) | ||||||||||||||
Net derivative assets | – | – | (2,526 | ) | 8,052 | – | 5,526 | |||||||||||||||
Available-for-sale debt securities: | ||||||||||||||||||||||
Non-agency MBS: | ||||||||||||||||||||||
Residential | – | – | – | (20 | ) | (1,139 | ) | (1,159 | ) | |||||||||||||
Commercial | – | – | – | – | (185 | ) | (185 | ) | ||||||||||||||
Foreign securities | – | – | – | – | (79 | ) | (79 | ) | ||||||||||||||
Corporate/Agency bonds | – | – | – | – | (22 | ) | (22 | ) | ||||||||||||||
Other taxable securities | – | – | – | – | (75 | ) | (75 | ) | ||||||||||||||
Tax-exempt securities | – | – | – | – | 2 | 2 | ||||||||||||||||
Total available-for-sale debt securities | – | – | – | (20 | ) | (1,498 | ) | (1,518 | ) | |||||||||||||
Loans and leases (2) | – | – | (11 | ) | – | 526 | 515 | |||||||||||||||
Mortgage servicing rights | – | – | – | 5,286 | – | 5,286 | ||||||||||||||||
Loans held-for-sale (2) | – | – | (216 | ) | 306 | 588 | 678 | |||||||||||||||
Other assets | 21 | 947 | – | 244 | 61 | 1,273 | ||||||||||||||||
Trading account liabilities – Foreign sovereign debt | – | – | (38 | ) | – | – | (38 | ) | ||||||||||||||
Accrued expenses and other liabilities (2) | – | – | 36 | (11 | ) | 1,360 | 1,385 | |||||||||||||||
Long-term debt (2) | – | – | (2,083 | ) | – | (227 | ) | (2,310 | ) | |||||||||||||
Total | $ | 21 | $ | 947 | $ | (4,990 | ) | $ | 13,857 | $ | 810 | $ | 10,645 | |||||||||
| 2008 | ||||||||||||||||||||||
Trading account assets | $ | – | $ | – | $ | (3,044 | ) | $ | (178 | ) | $ | – | $ | (3,222 | ) | |||||||
Net derivative assets | – | – | 103 | 2,428 | – | 2,531 | ||||||||||||||||
Available-for-sale debt securities | – | – | – | (74 | ) | (2,435 | ) | (2,509 | ) | |||||||||||||
Loans and leases (2) | – | – | (5 | ) | – | (775 | ) | (780 | ) | |||||||||||||
Mortgage servicing rights | – | – | – | (7,115 | ) | – | (7,115 | ) | ||||||||||||||
Loans held-for-sale (2) | – | – | (195 | ) | (848 | ) | (4 | ) | (1,047 | ) | ||||||||||||
Other assets | 55 | 110 | – | – | 10 | 175 | ||||||||||||||||
Accrued expenses and other liabilities (2) | – | – | 9 | 295 | (473 | ) | (169 | ) | ||||||||||||||
Total | $ | 55 | $ | 110 | $ | (3,132 | ) | $ | (5,492 | ) | $ | (3,677 | ) | $ | (12,136 | ) | ||||||
| 2007 | ||||||||||||||||||||||
Trading account assets (3) | $ | – | $ | – | $ | (2,959 | ) | $ | – | $ | – | $ | (2,959 | ) | ||||||||
Net derivative assets (3) | – | – | (515 | ) | 174 | – | (341 | ) | ||||||||||||||
Available-for-sale debt securities (3, 4) | – | – | – | – | (398 | ) | (398 | ) | ||||||||||||||
Loans and leases (2) | – | – | (1 | ) | – | (139 | ) | (140 | ) | |||||||||||||
Mortgage servicing rights (3) | – | – | – | 231 | – | 231 | ||||||||||||||||
Loans held-for-sale (2) | – | – | (61 | ) | (29 | ) | – | (90 | ) | |||||||||||||
Other assets (5) | 103 | 1,971 | – | – | 75 | 2,149 | ||||||||||||||||
Accrued expenses and other liabilities (2) | – | – | (5 | ) | – | (274 | ) | (279 | ) | |||||||||||||
Total | $ | 103 | $ | 1,971 | $ | (3,541 | ) | $ | 376 | $ | (736 | ) | $ | (1,827 | ) | |||||||
| (1) | Mortgage banking income does not reflect the impact of Level 1 and Level 2 hedges against MSRs. |
| (2) | Amounts represent items which are accounted for under the fair value option. |
| (3) | Amounts represent items which are carried at fair value prior to the adoption of the fair value option. |
| (4) | Amounts represent write-downs on certain securities that were deemed to be other-than-temporarily impaired during 2007. |
| (5) | Amounts represent items which are accounted for under the fair value option. |
| Bank of America 2009 | 191 |
The tables below summarize changes in unrealized gains (losses) recorded in earnings during 2009, 2008 and 2007 for Level 3 assets and liabilities that were still held at December 31, 2009, 2008 and 2007. These amounts include changes in fair value generated by loans, LHFS, loan commitments and structured notes which are accounted for under the fair value option.
Level 3 Changes in Unrealized Gains (Losses) Relating to Assets and Liabilities Still Held at Reporting Date
| 2009 | ||||||||||||||||||||||||
| (Dollars in millions) | Card Income (Loss) | Equity Investment Income | Trading Account Profits (Losses) | Mortgage Banking Income (Loss) (1) | Other Income (Loss) | Total | ||||||||||||||||||
Trading account assets: | ||||||||||||||||||||||||
Corporate securities, trading loans and other | $ | – | $ | – | $ | 89 | $ | – | $ | – | $ | 89 | ||||||||||||
Equity securities | – | – | (328 | ) | – | – | (328 | ) | ||||||||||||||||
Foreign sovereign debt | – | – | 137 | – | – | 137 | ||||||||||||||||||
Mortgage trading loans and asset-backed securities | – | – | (332 | ) | – | – | (332 | ) | ||||||||||||||||
Total trading account assets | – | – | (434 | ) | – | – | (434 | ) | ||||||||||||||||
Net derivative assets | – | – | (2,761 | ) | 348 | – | (2,413 | ) | ||||||||||||||||
Available-for-sale debt securities: | ||||||||||||||||||||||||
Mortgage-backed securities: | ||||||||||||||||||||||||
Non-agency MBS: | ||||||||||||||||||||||||
Residential | – | – | – | (20 | ) | (659 | ) | (679 | ) | |||||||||||||||
Other taxable securities | – | – | (11 | ) | – | (3 | ) | (14 | ) | |||||||||||||||
Tax-exempt securities | – | – | (2 | ) | – | (8 | ) | (10 | ) | |||||||||||||||
Total available-for-sale debt securities | – | – | (13 | ) | (20 | ) | (670 | ) | (703 | ) | ||||||||||||||
Loans and leases (2) | – | – | – | – | 210 | 210 | ||||||||||||||||||
Mortgage servicing rights | – | – | – | 4,100 | – | 4,100 | ||||||||||||||||||
Loans held-for-sale (2) | – | – | (195 | ) | 164 | 695 | 664 | |||||||||||||||||
Other assets | (71 | ) | (106 | ) | – | 6 | 1,061 | 890 | ||||||||||||||||
Trading account liabilities – Foreign sovereign debt | – | – | (38 | ) | – | – | (38 | ) | ||||||||||||||||
Accrued expenses and other liabilities (2) | – | – | – | (11 | ) | 1,740 | 1,729 | |||||||||||||||||
Long-term debt (2) | – | – | (2,303 | ) | – | (225 | ) | (2,528 | ) | |||||||||||||||
Total | $ | (71 | ) | $ | (106 | ) | $ | (5,744 | ) | $ | 4,587 | $ | 2,811 | $ | 1,477 | |||||||||
| 2008 | ||||||||||||||||||||||||
Trading account assets | $ | – | $ | – | $ | (2,144 | ) | $ | (178 | ) | $ | – | $ | (2,322 | ) | |||||||||
Net derivative assets | – | – | 2,095 | 1,154 | – | 3,249 | ||||||||||||||||||
Available-for-sale debt securities | – | – | – | (74 | ) | (1,840 | ) | (1,914 | ) | |||||||||||||||
Loans and leases (2) | – | – | – | – | (1,003 | ) | (1,003 | ) | ||||||||||||||||
Mortgage servicing rights | – | – | – | (7,378 | ) | – | (7,378 | ) | ||||||||||||||||
Loans held-for-sale (2) | – | – | (154 | ) | (423 | ) | (4 | ) | (581 | ) | ||||||||||||||
Other assets | (331 | ) | (193 | ) | – | – | – | (524 | ) | |||||||||||||||
Accrued expenses and other liabilities (2) | – | – | – | 292 | (880 | ) | (588 | ) | ||||||||||||||||
Total | $ | (331 | ) | $ | (193 | ) | $ | (203 | ) | $ | (6,607 | ) | $ | (3,727 | ) | $ | (11,061 | ) | ||||||
| 2007 | ||||||||||||||||||||||||
Trading account assets (3) | $ | – | $ | – | $ | (2,857 | ) | $ | – | $ | – | $ | (2,857 | ) | ||||||||||
Net derivative assets (3) | – | – | (196 | ) | 139 | – | (57 | ) | ||||||||||||||||
Available-for-sale debt securities (3) | – | – | – | – | (398 | ) | (398 | ) | ||||||||||||||||
Loans and leases (2) | – | – | – | – | (167 | ) | (167 | ) | ||||||||||||||||
Mortgage servicing rights (3) | – | – | – | (43 | ) | – | (43 | ) | ||||||||||||||||
Loans held-for-sale (2) | (58 | ) | (22 | ) | (80 | ) | ||||||||||||||||||
Other assets (4) | (136 | ) | (65 | ) | – | – | – | (201 | ) | |||||||||||||||
Accrued expenses and other liabilities (4) | – | – | (1 | ) | – | (395 | ) | (396 | ) | |||||||||||||||
Total | $ | (136 | ) | $ | (65 | ) | $ | (3,112 | ) | $ | 74 | $ | (960 | ) | $ | (4,199 | ) | |||||||
| (1) | Mortgage banking income does not reflect impact of Level 1 and Level 2 hedges against MSRs. |
| (2) | Amounts represent items which are accounted for under the fair value option. |
| (3) | Amounts represent items which were accounted for prior to the adoption of the fair value option. |
| (4) | Amounts represent items which were carried at fair value prior to the adoption of the fair value option and certain portfolios of LHFS which are accounted for under the fair value option. |
| 192 | Bank of America 2009 |
Nonrecurring Fair Value
Certain assets and liabilities are measured at fair value on a nonrecurring basis and are not included in the previous tables in this Note. These assets and liabilities primarily include LHFS, unfunded loan commitments held-for-sale, and foreclosed properties. The amounts below represent only balances measured at fair value during the year and still held as of the reporting date.
Assets and Liabilities Measured at Fair Value on a Nonrecurring Basis
| At and for the Year Ended December 31, 2009 | At and for the Year Ended December 31, 2008 | |||||||||||||||||||||
| (Dollars in millions) | Level 2 | Level 3 | (Losses) | Level 2 | Level 3 | (Losses) | ||||||||||||||||
Assets | ||||||||||||||||||||||
Loans held-for-sale | $ | 2,320 | $ | 7,248 | $ | (1,288 | ) | $ | 1,828 | $ | 9,782 | $ | (1,699 | ) | ||||||||
Loans and leases ( 1 ) | 7 | 8,426 | (4,858 | ) | – | 2,131 | (1,164 | ) | ||||||||||||||
Foreclosed properties ( 2 ) | – | 644 | (322 | ) | – | 590 | (171 | ) | ||||||||||||||
Other assets | 31 | 322 | (268 | ) | – | – | – | |||||||||||||||
| (1) | Gains (losses) represent charge-offs associated with real estate-secured loans that exceed 180 days past due which are netted against the allowance for loan and lease losses. |
| (2) | Amounts are included in other assets on the Consolidated Balance Sheet and represent fair value and related losses of foreclosed properties that were written down subsequent to their initial classification as foreclosed properties. |
Fair Value Option Elections
Corporate Loans and Loan Commitments
The Corporation elected to account for certain large corporate loans and loan commitments which exceeded the Corporation's single name credit risk concentration guidelines under the fair value option. Lending commitments, both funded and unfunded, are actively managed and monitored and, as appropriate, credit risk for these lending relationships may be mitigated through the use of credit derivatives, with the Corporation's credit view and market perspectives determining the size and timing of the hedging activity. These credit derivatives do not meet the requirements for derivatives designated as hedging instruments and are therefore carried at fair value with changes in fair value recorded in other income. Electing the fair value option allows the Corporation to carry these loans and loan commitments at fair value, which is more consistent with management's view of the underlying economics and the manner in which they are managed. In addition, accounting for these loans and loan commitments at fair value reduces the accounting asymmetry that would otherwise result from carrying the loans at historical cost and the credit derivatives at fair value.
At December 31, 2009 and 2008, funded loans which the Corporation elected to carry at fair value had an aggregate fair value of $4.9 billion and $5.4 billion recorded in loans and leases and an aggregate outstanding principal balance of $5.4 billion and $6.4 billion. At December 31, 2009 and 2008, unfunded loan commitments that the Corporation has elected to carry at fair value had an aggregate fair value of $950 million and $1.1 billion recorded in accrued expenses and other liabilities and an aggregate committed exposure of $27.0 billion and $16.9 billion. Interest income on these loans is recorded in interest and fees on loans and leases.
Loans Held-for-Sale
The Corporation also elected to account for certain LHFS at fair value. Electing to use fair value allows a better offset of the changes in fair values of the loans and the derivative instruments used to economically hedge them. The Corporation has not elected to fair value other LHFS primarily because these loans are floating rate loans that are not economically hedged using derivative instruments. At December 31, 2009 and 2008, residential mortgage loans, commercial mortgage loans, and other LHFS for which the fair value option was elected had an aggregate fair
value of $32.8 billion and $18.9 billion and an aggregate outstanding principal balance of $36.5 billion and $20.7 billion. Interest income on these loans is recorded in other interest income. These changes in fair value are mostly offset by hedging activities. An immaterial portion of these amounts was attributable to changes in instrument-specific credit risk.
Other Assets
The Corporation elected the fair value option for certain other assets. Other assets primarily represents non-marketable convertible preferred shares for which the Corporation has economically hedged a majority of the position with derivatives. At December 31, 2009, these assets had a fair value of $253 million.
Securities Financing Agreements
The Corporation elected the fair value option for certain securities financing agreements. The fair value option election was made for certain securities financing agreements based on the tenor of the agreements which reflects the magnitude of the interest rate risk. The majority of securities financing agreements collateralized by U.S. government securities were excluded from the fair value option election as these contracts are generally short-dated and therefore the interest rate risk is not considered significant. At December 31, 2009, securities financing agreements for which the fair value option has been elected had an aggregate fair value of $95.1 billion and a principal balance of $94.6 billion.
Long-term Deposits
The Corporation elected to fair value certain long-term fixed-rate and rate-linked deposits which are economically hedged with derivatives. At December 31, 2009 and 2008, these instruments had an aggregate fair value of $1.7 billion for both years ended and principal balance of $1.6 billion and $1.7 billion recorded in interest-bearing deposits. Interest paid on these instruments continues to be recorded in interest expense. Election of the fair value option will allow the Corporation to reduce the accounting volatility that would otherwise result from the accounting asymmetry created by accounting for the financial instruments at historical cost and the economic hedges at fair value. The Corporation did not elect to fair value other financial instruments within the same balance sheet category because they were not economically hedged using derivatives.
| Bank of America 2009 | 193 |
Commercial Paper and Other Short-term Borrowings
The Corporation elected to fair value certain commercial paper and other short-term borrowings that were acquired as part of the Merrill Lynch acquisition. This debt is risk-managed on a fair value basis. At December 31, 2009, this debt had both an aggregate fair value and a principal balance of $813 million recorded in commercial paper and other short-term borrowings.
Long-term Debt
The Corporation elected to fair value certain long-term debt, primarily structured notes, that were acquired as part of the Merrill Lynch acquisition. This long-term debt is risk-managed on a fair value basis. Election of the fair value option will allow the Corporation to reduce the accounting volatility that would otherwise result from the accounting asymmetry created by accounting for the financial instruments at historical cost and the economic hedges at fair value. The Corporation did not elect to fair value other financial instruments within the same balance sheet category because they were not economically hedged using derivatives. At
December 31, 2009, this long-term debt had an aggregate fair value of $45.5 billion and a principal balance of $48.6 billion recorded in long-term debt.
Asset-backed Secured Financings
The Corporation elected to fair value certain asset-backed secured financings that were acquired as part of the Countrywide acquisition. At December 31, 2009, these secured financings had an aggregate fair value of $707 million and principal balance of $1.5 billion recorded in accrued expenses and other liabilities. Using the fair value option election allows the Corporation to reduce the accounting volatility that would otherwise result from the accounting asymmetry created by accounting for the asset-backed secured financings at historical cost and the corresponding mortgage LHFS securing these financings at fair value.
The following table provides information about where changes in the fair value of assets or liabilities for which the fair value option has been elected are included in the Consolidated Statement of Income for 2009 and 2008.
Gains (Losses) Relating to Assets and Liabilities Accounted for Using Fair Value Option
| 2009 | ||||||||||||||||||||||||||||||||||||
| (Dollars in millions) | Corporate Loans and Loan Commitments | Loans Held-for-Sale | Securities Financing Agreements | Other Assets | Long- term Deposits | Asset- backed Secured Financings | Commercial Paper and Other Short-term Borrowings | Long- term | Total | |||||||||||||||||||||||||||
| Trading account profits (losses) | $ | 25 | $ | (211 | ) | $ | – | $ | 379 | $ | – | $ | – | $ | (236 | ) | $ | (3,938 | ) | $ | (3,981 | ) | ||||||||||||||
| Mortgage banking income (loss) | – | 8,251 | – | – | – | (11 | ) | – | – | 8,240 | ||||||||||||||||||||||||||
| Equity investment income (loss) | – | – | – | (177 | ) | – | – | – | – | (177 | ) | |||||||||||||||||||||||||
| Other income (loss) | 1,886 | 588 | (292 | ) | – | 35 | – | – | (4,900 | ) | (2,683 | ) | ||||||||||||||||||||||||
Total | $ | 1,911 | $ | 8,628 | $ | (292 | ) | $ | 202 | $ | 35 | $ | (11 | ) | $ | (236 | ) | $ | (8,838 | ) | $ | 1,399 | ||||||||||||||
| 2008 | ||||||||||||||||||||||||||||||||||||
| Trading account profits (losses) | $ | 4 | $ | (680 | ) | $ | – | $ | – | $ | – | $ | – | $ | – | $ | – | $ | (676 | ) | ||||||||||||||||
| Mortgage banking income | – | 281 | – | – | – | 295 | – | – | 576 | |||||||||||||||||||||||||||
| Other income (loss) | (1,248 | ) | (215 | ) | (18 | ) | – | (10 | ) | – | – | – | (1,491 | ) | ||||||||||||||||||||||
Total | $ | (1,244 | ) | $ | (614 | ) | $ | (18 | ) | $ | – | $ | (10 | ) | $ | 295 | $ | – | $ | – | $ | (1,591 | ) | |||||||||||||
NOTE 21 – Fair Value of Financial Instruments
The fair values of financial instruments have been derived, in part, by the Corporation's assumptions, the estimated amount and timing of future cash flows and estimated discount rates. Different assumptions could significantly affect these estimated fair values. Accordingly, the net realizable values could be materially different from the estimates presented below. In addition, the estimates are only indicative of the value of individual financial instruments and should not be considered an indication of the fair value of the Corporation.
The following disclosures represent financial instruments in which the ending balance at December 31, 2009 and 2008 are not carried at fair value in its entirety on the Corporation's Consolidated Balance Sheet.
Short-term Financial Instruments
The carrying value of short-term financial instruments, including cash and cash equivalents, time deposits placed, federal funds sold and purchased, resale and certain repurchase agreements, commercial paper and other short-term investments and borrowings, approximates the fair value of these instruments. These financial instruments generally expose the Corporation to limited credit risk and have no stated maturities or
have short-term maturities and carry interest rates that approximate market. The Corporation elected to account for certain structured reverse repurchase agreements under the fair value option. See Note 20 – Fair Value Measurements for additional information on these structured reverse repurchase agreements.
Loans
Fair values were generally determined by discounting both principal and interest cash flows expected to be collected using an observable discount rate for similar instruments with adjustments that the Corporation believes a market participant would consider in determining fair value. The Corporation estimates the cash flows expected to be collected using internal credit risk, interest rate and prepayment risk models that incorporate the Corporation's best estimate of current key assumptions, such as default rates, loss severity and prepayment speeds for the life of the loan. The Corporation elected to account for certain large corporate loans which exceeded the Corporation's single name credit risk concentration guidelines under the fair value option. See Note 20 – Fair Value Measurements for additional information on loans for which the Corporation adopted the fair value option.
| 194 | Bank of America 2009 |
Deposits
The fair value for certain deposits with stated maturities was calculated by discounting contractual cash flows using current market rates for instruments with similar maturities. The carrying value of foreign time deposits approximates fair value. For deposits with no stated maturities, the carrying amount was considered to approximate fair value and does not take into account the significant value of the cost advantage and stability of the Corporation's long-term relationships with depositors. The Corporation elected to account for certain long-term fixed-rate deposits which are economically hedged with derivatives under the fair value option. See Note 20 – Fair Value Measurements for additional information on these long-term fixed-rate deposits.
Long-term Debt
The Corporation uses quoted market prices for its long-term debt when available. When quoted market prices are not available, fair value is estimated based on current market interest rates and credit spreads for debt with similar maturities. The Corporation elected to account for certain structured notes under the fair value option. See Note 20 – Fair Value Measurements for additional information on these structured notes.
The carrying and fair values of certain financial instruments at December 31, 2009 and 2008 were as follows:
| December 31 | ||||||||||||||
| 2009 | 2008 | |||||||||||||
| (Dollars in millions) | Carrying Value (1) | Fair Value | Carrying Value (1) | Fair Value | ||||||||||
Financial assets | ||||||||||||||
Loans (2) | $ | 841,020 | $ | 813,596 | $ | 886,198 | $ | 841,629 | ||||||
Financial liabilities | ||||||||||||||
Deposits | 991,611 | 991,768 | 882,997 | 883,987 | ||||||||||
Long-term debt | 438,521 | 440,246 | 268,292 | 260,291 | ||||||||||
| (1) | The carrying value of loans is presented net of allowance for loan and lease losses. Amounts exclude leases. |
| (2) | Fair value is determined based on the present value of future cash flows using credit spreads or risk adjusted rates of return that a buyer of the portfolio would require at December 31, 2009 and 2008. However, the Corporation expects to collect the principal cash flows underlying the book values as well as the related interest cash flows. |
NOTE 22 – Mortgage Servicing Rights
The Corporation accounts for consumer MSRs at fair value with changes in fair value recorded in the Consolidated Statement of Income in mortgage banking income. The Corporation economically hedges these MSRs with certain derivatives and securities including MBS and U.S. Treasuries. The securities that economically hedge the MSRs are recorded in other assets with changes in the fair value of the securities and the related interest income recorded as mortgage banking income.
The following table presents activity for residential first mortgage MSRs for 2009 and 2008.
| (Dollars in millions) | 2009 | 2008 | ||||||
Balance, January 1 | $ | 12,733 | $ | 3,053 | ||||
Merrill Lynch balance, January 1, 2009 | 209 | - | ||||||
Countrywide balance, July 1, 2008 | - | 17,188 | ||||||
Additions / sales | 5,728 | 2,587 | ||||||
Impact of customer payments | (3,709 | ) | (3,313 | ) | ||||
Other changes in MSR market value | 4,504 | (6,782 | ) | |||||
Balance, December 31 | $ | 19,465 | $ | 12,733 | ||||
Mortgage loans serviced for investors (in billions) | $ | 1,716 | $ | 1,654 | ||||
During 2009 and 2008, other changes in MSR market value were $4.5 billion and $(6.8) billion. These amounts reflect the change in discount rates and prepayment speed assumptions, mostly due to changes in interest rates, as well as the effect of changes in other assumptions. The
amounts do not include $782 million in gains in 2009 resulting from lower than expected prepayments and $(333) million in losses in 2008 resulting from higher than expected prepayments. The net amounts of $5.3 billion and $(7.1) billion are included in the line "mortgage banking income (loss)" in the table "Level 3 – Total Realized and Unrealized Gains (Losses) Included in Earnings" in Note 20 – Fair Value Measurements.
At December 31, 2009 and 2008, the fair value of consumer MSRs was $19.5 billion and $12.7 billion. The Corporation uses an OAS valuation approach to determine the fair value of MSRs which factors in prepayment risk. This approach consists of projecting servicing cash flows under multiple interest rate scenarios and discounting these cash flows using risk-adjusted discount rates. The key economic assumptions used in valuations of MSRs include weighted-average lives of the MSRs and the OAS levels.
Key economic assumptions used in determining the fair value of MSRs at December 31, 2009 and 2008 were as follows:
| December 31 | ||||||||||||||
| 2009 | 2008 | |||||||||||||
| (Dollars in millions) | Fixed | Adjustable | Fixed | Adjustable | ||||||||||
Weighted-average option adjusted spread | 1.67 | % | 4.64 | % | 1.71 | % | 6.40 | % | ||||||
Weighted-average life, | 5.62 | 3.26 | 3.26 | 2.71 | ||||||||||
| Bank of America 2009 | 195 |
The following table presents the sensitivity of the weighted-average lives and fair value of MSRs to changes in modeled assumptions. The sensitivities in the following table are hypothetical and should be used with caution. As the amounts indicate, changes in fair value based on variations in assumptions generally cannot be extrapolated because the relationship of the change in assumption to the change in fair value may not be linear. Also, the effect of a variation in a particular assumption on the fair value of a MSR that continues to be held by the Corporation is calculated without changing any other assumption. In reality, changes in one factor may result in changes in another, which might magnify or counteract the sensitivities. Additionally, the Corporation has the ability to hedge interest rate and market valuation fluctuations associated with MSRs. The below sensitivities do not reflect any hedge strategies that may be undertaken to mitigate such risk.
| December 31, 2009 | ||||||||||
| Change in Weighted- average Lives | ||||||||||
| (Dollars in millions) | Fixed | Adjustable | Change in Fair Value | |||||||
Prepayment rates | ||||||||||
Impact of 10% decrease | 0.32 | years | 0.14 | years | $ | 895 | ||||
Impact of 20% decrease | 0.68 | 0.31 | 1,895 | |||||||
Impact of 10% increase | (0.29 | ) | (0.12 | ) | (807 | ) | ||||
Impact of 20% increase | (0.54 | ) | (0.22 | ) | (1,540 | ) | ||||
OAS level | ||||||||||
Impact of 100 bps decrease | n/a | n/a | $ | 900 | ||||||
Impact of 200 bps decrease | n/a | n/a | 1,882 | |||||||
Impact of 100 bps increase | n/a | n/a | (828 | ) | ||||||
Impact of 200 bps increase | n/a | n/a | (1,592 | ) | ||||||
n/a = not applicable
Commercial and residential reverse mortgage MSRs are accounted for using the amortization method (i.e., lower of cost or market). Commercial and residential reverse mortgage MSRs totaled $309 million and $323 million at December 31, 2009 and 2008 and are not included in the tables above.
NOTE 23 – Business Segment Information
The Corporation reports the results of its operations through six business segments: Deposits, Global Card Services, Home Loans & Insurance, Global Banking, Global Markets and Global Wealth & Investment Management (GWIM) , with the remaining operations recorded in All Other. The Corporation may periodically reclassify business segment results based on modifications to its management reporting methodologies and changes in organizational alignment. Prior period amounts have been reclassified to conform to current period presentation.
Deposits
Deposits includes the results of consumer deposits activities which consist of a comprehensive range of products provided to consumers and small businesses. In addition, Deposits includes student lending results and the net effect of its ALM activities. Deposits products include traditional savings accounts, money market savings accounts, CDs and IRAs, and noninterest- and interest-bearing checking accounts . These products provide a relatively stable source of funding and liquidity. The Corporation earns net interest spread revenue from investing this liquidity in earning assets through client-facing lending and ALM activities. The revenue is allocated to the deposit products using a funds transfer pricing process which takes into account the interest rates and maturity characteristics of
the deposits. Deposits also generate fees such as account service fees, non-sufficient funds fees, overdraft charges and ATM fees. In addition, Deposits includes the impact of migrating customers and their related deposit balances between GWIM and Deposits . As of the date of migration, the associated net interest income, service fees and noninterest expense are recorded in the segment to which deposits were transferred.
Global Card Services
Global Card Services provides a broad offering of products including U.S. consumer and business card, consumer lending, international card and debit card to consumers and small businesses. The Corporation reports Global Card Services results on a managed basis which is consistent with the way that management evaluates the results of Global Card Services . Managed basis assumes that securitized loans were not sold and presents earnings on these loans in a manner similar to the way loans that have not been sold (i.e., held loans) are presented. Loan securitization is an alternative funding process that is used by the Corporation to diversify funding sources. Loan securitization removes loans from the Consolidated Balance Sheet through the sale of loans to an off-balance sheet QSPE that is excluded from the Corporation's Consolidated Financial Statements in accordance with applicable accounting guidance.
The performance of the managed portfolio is important in understanding Global Card Services results as it demonstrates the results of the entire portfolio serviced by the business. Securitized loans continue to be serviced by the business and are subject to the same underwriting standards and ongoing monitoring as held loans. In addition, excess servicing income is exposed to similar credit risk and repricing of interest rates as held loans. Global Card Services managed income statement line items differ from a held basis as follows:
| • | Managed net interest income includes Global Card Services net interest income on held loans and interest income on the securitized loans less the internal funds transfer pricing allocation related to securitized loans. |
| • | Managed noninterest income includes Global Card Services noninterest income on a held basis less the reclassification of certain components of card income (e.g., excess servicing income) to record securitized net interest income and provision for credit losses. Noninterest income, both on a held and managed basis, also includes the impact of adjustments to the interest-only strips that are recorded in card income as management continues to manage this impact within Global Card Services . |
| • | Provision for credit losses represents the provision for credit losses on held loans combined with realized credit losses associated with the securitized loan portfolio. |
Home Loans & Insurance
Home Loans & Insurance provides an extensive line of consumer real estate products and services to customers nationwide. Home Loans & Insurance products include fixed and adjustable rate first-lien mortgage loans for home purchase and refinancing needs, reverse mortgages, home equity lines of credit and home equity loans. First mortgage products are either sold into the secondary mortgage market to investors, while retaining MSRs and the Bank of America customer relationships, or are held on the Corporation's balance sheet in All Other for ALM purposes. Home Loans & Insurance is not impacted by the Corporation's mortgage production retention decisions as Home Loans & Insurance is compensated for the decision on a management accounting basis with a corresponding offset recorded in All Other . In addition, Home Loans & Insurance offers property, casualty, life, disability and credit insurance. Home Loans & Insurance also includes the impact of migrating customers and their related loan balances between GWIM and Home Loans &
| 196 | Bank of America 2009 |
Insurance . As of the date of migration, the associated net interest income and noninterest expense are recorded in the segment to which loans were transferred.
Global Banking
Global Banking provides a wide range of lending-related products and services, integrated working capital management, treasury solutions and investment banking services to clients worldwide. Lending products and services include commercial loans and commitment facilities, real estate lending, leasing, trade finance, short-term credit facilities, asset-based lending and indirect consumer loans. Capital management and treasury solutions include treasury management, foreign exchange and short-term investing options. Investment banking services provide the Corporation's commercial and corporate issuer clients with debt and equity underwriting and distribution capabilities as well as merger-related and other advisory services. Global Banking also includes the results of economic hedging of the credit risk to certain exposures utilizing various risk mitigation tools. Product specialists within Global Markets work closely with Global Banking on the underwriting and distribution of debt and equity securities and certain other products. In order to reflect the efforts of Global Markets and Global Banking in servicing the Corporation's clients with the best product capabilities, the Corporation allocates revenue and expenses to the two segments based on relative contribution.
Global Markets
Global Markets provides financial products, advisory services, financing, securities clearing, settlement and custody services globally to institutional investor clients in support of their investing and trading activities. Global Markets also works with commercial and corporate issuer clients to provide debt and equity underwriting and distribution capabilities and risk management products using interest rate, equity, credit, currency and commodity derivatives, foreign exchange, fixed income and mortgage-related products. The business may take positions in these products and participate in market-making activities dealing in government securities, equity and equity-linked securities, high-grade and high-yield corporate debt securities, commercial paper, MBS and ABS. Product specialists within Global Markets work closely with Global Banking on the underwriting and distribution of debt and equity securities and certain other products. In order to reflect the efforts of Global Markets and Global Banking in servicing the Corporation's clients with the best product capabilities, the Corporation allocates revenue and expenses to the two segments based on relative contribution.
Global Wealth & Investment Management
GWIM offers investment and brokerage services, estate management, financial planning services, fiduciary management, credit and banking expertise, and diversified asset management products to institutional clients, as well as affluent and high net-worth individuals. In addition, GWIM includes the results of Retirement and Philanthropic Services, the Corporation's approximately 34 percent economic ownership of BlackRock, and other miscellaneous items. GWIM also reflects the impact of migrating customers, and their related deposit and loan balances, between GWIM and Deposits and GWIM and Home Loans & Insurance . As of the date of migration, the associated net interest income, noninterest income and noninterest expense are recorded in the segment to which deposits and loans were transferred.
All Other
All Other consists of equity investment activities including Global Principal Investments, corporate investments and strategic investments, the residential mortgage portfolio associated with ALM activities, the residual impact of the cost allocation processes, merger and restructuring charges, and the results of certain businesses that are expected to be or have been sold or are in the process of being liquidated. All Other also includes certain amounts associated with ALM activities, foreign exchange rate fluctuations related to revaluation of foreign currency-denominated debt issuances, certain gains (losses) on sales of whole mortgage loans, gains (losses) on sales of debt securities and a securitization offset which removes the securitization impact of sold loans in Global Card Services in order to present the consolidated results of the Corporation on a GAAP basis (i.e., held basis). Effective January 1, 2009, as part of the Merrill Lynch acquisition, All Other includes the results of First Republic Bank and fair value adjustments related to certain Merrill Lynch structured notes.
Basis of Presentation
Total revenue, net of interest expense, includes net interest income on a FTE basis and noninterest income. The adjustment of net interest income to a FTE basis results in a corresponding increase in income tax expense. The segment results also reflect certain revenue and expense methodologies that are utilized to determine net income. The net interest income of the businesses includes the results of a funds transfer pricing process that matches assets and liabilities with similar interest rate sensitivity and maturity characteristics. Net interest income of the business segments also includes an allocation of net interest income generated by the Corporation's ALM activities.
The management accounting and reporting process derives segment and business results by utilizing allocation methodologies for revenue and expense. The net income derived for the businesses is dependent upon revenue and cost allocations using an activity-based costing model, funds transfer pricing, and other methodologies and assumptions management believes are appropriate to reflect the results of the business.
The Corporation's ALM activities maintain an overall interest rate risk management strategy that incorporates the use of interest rate contracts to manage fluctuations in earnings that are caused by interest rate volatility. The Corporation's goal is to manage interest rate sensitivity so that movements in interest rates do not significantly adversely affect net interest income. The results of the business segments will fluctuate based on the performance of corporate ALM activities. ALM activities are recorded in the business segments such as external product pricing decisions, including deposit pricing strategies, the effects of the Corporation's internal funds transfer pricing process as well as the net effects of other ALM activities. Certain residual impacts of the funds transfer pricing process are retained in All Other .
Certain expenses not directly attributable to a specific business segment are allocated to the segments. The most significant of these expenses include data and item processing costs and certain centralized or shared functions. Data processing costs are allocated to the segments based on equipment usage. Item processing costs are allocated to the segments based on the volume of items processed for each segment. The costs of certain centralized or shared functions are allocated based on methodologies that reflect utilization.
| Bank of America 2009 | 197 |
The following tables present total revenue, net of interest expense, on a FTE basis and net income (loss) for 2009, 2008 and 2007, and total assets at December 31, 2009 and 2008 for each business segment, as well as All Other .
Business Segments
At and for the Year Ended December 31 | Total Corporation (1) | Deposits (2) | Global Card Services (3) | ||||||||||||||||||||||||||||||||||||
| (Dollars in millions) | 2009 | 2008 | 2007 | 2009 | 2008 | 2007 | 2009 | 2008 | 2007 | ||||||||||||||||||||||||||||||
Net interest income (4 ) | $ | 48,410 | $ | 46,554 | $ | 36,190 | $ | 7,160 | $ | 10,970 | $ | 10,215 | $ | 20,264 | $ | 19,589 | $ | 16,627 | |||||||||||||||||||||
Noninterest income | 72,534 | 27,422 | 32,392 | 6,848 | 6,870 | 6,187 | 9,078 | 11,631 | 11,146 | ||||||||||||||||||||||||||||||
Total revenue, net of | 120,944 | 73,976 | 68,582 | 14,008 | 17,840 | 16,402 | 29,342 | 31,220 | 27,773 | ||||||||||||||||||||||||||||||
Provision for credit losses ( 5 ) | 48,570 | 26,825 | 8,385 | 380 | 399 | 227 | 30,081 | 20,164 | 11,678 | ||||||||||||||||||||||||||||||
Amortization of intangibles | 1,978 | 1,834 | 1,676 | 238 | 297 | 294 | 911 | 1,048 | 1,040 | ||||||||||||||||||||||||||||||
Other noninterest expense | 64,735 | 39,695 | 35,848 | 9,455 | 8,486 | 8,056 | 7,050 | 8,112 | 8,337 | ||||||||||||||||||||||||||||||
Income (loss) before | 5,661 | 5,622 | 22,673 | 3,935 | 8,658 | 7,825 | (8,700 | ) | 1,896 | 6,718 | |||||||||||||||||||||||||||||
Income tax expense (benefit) (4 ) | (615 | ) | 1,614 | 7,691 | 1,429 | 3,146 | 2,751 | (3,145 | ) | 662 | 2,457 | ||||||||||||||||||||||||||||
Net income (loss) | $ | 6,276 | $ | 4,008 | $ | 14,982 | $ | 2,506 | $ | 5,512 | $ | 5,074 | $ | (5,555 | ) | $ | 1,234 | $ | 4,261 | ||||||||||||||||||||
Year end total assets | $ | 2,223,299 | $ | 1,817,943 | $ | 445,363 | $ | 390,487 | $ | 217,139 | $ | 252,683 | |||||||||||||||||||||||||||
| Home Loans & Insurance | Global Banking (2) | Global Markets | |||||||||||||||||||||||||||||||||||||
| (Dollars in millions) | 2009 | 2008 | 2007 | 2009 | 2008 | 2007 | 2009 | 2008 | 2007 | ||||||||||||||||||||||||||||||
Net interest income (4 ) | $ | 4,974 | $ | 3,311 | $ | 1,899 | $ | 11,250 | $ | 10,755 | $ | 8,679 | $ | 6,120 | $ | 5,151 | $ | 2,308 | |||||||||||||||||||||
Noninterest income (loss) | 11,928 | 5,999 | 1,806 | 11,785 | 6,041 | 6,083 | 14,506 | (8,982 | ) | (3,618 | ) | ||||||||||||||||||||||||||||
Total revenue, net of | 16,902 | 9,310 | 3,705 | 23,035 | 16,796 | 14,762 | 20,626 | (3,831 | ) | (1,310 | ) | ||||||||||||||||||||||||||||
Provision for credit losses | 11,244 | 6,287 | 1,015 | 8,835 | 3,130 | 658 | 400 | (50 | ) | 2 | |||||||||||||||||||||||||||||
Amortization of intangibles | 63 | 39 | 2 | 187 | 217 | 182 | 65 | 2 | 3 | ||||||||||||||||||||||||||||||
Other noninterest expense | 11,620 | 6,923 | 2,527 | 9,352 | 6,467 | 7,376 | 9,977 | 3,904 | 4,737 | ||||||||||||||||||||||||||||||
Income (loss) before | (6,025 | ) | (3,939 | ) | 161 | 4,661 | 6,982 | 6,546 | 10,184 | (7,687 | ) | (6,052 | ) | ||||||||||||||||||||||||||
Income tax expense (benefit) (4 ) | (2,187 | ) | (1,457 | ) | 60 | 1,692 | 2,510 | 2,415 | 3,007 | (2,771 | ) | (2,241 | ) | ||||||||||||||||||||||||||
Net income (loss) | $ | (3,838 | ) | $ | (2,482 | ) | $ | 101 | $ | 2,969 | $ | 4,472 | $ | 4,131 | $ | 7,177 | $ | (4,916 | ) | $ | (3,811 | ) | |||||||||||||||||
Year end total assets | $ | 232,706 | $ | 205,046 | $ | 398,061 | $ | 394,541 | $ | 538,456 | $ | 306,693 | |||||||||||||||||||||||||||
| GWIM (2) | All Other (2, 3) | ||||||||||||||||||||||||||||||||||||||
| (Dollars in millions) | 2009 | 2008 | 2007 | 2009 | 2008 | 2007 | |||||||||||||||||||||||||||||||||
Net interest income (4 ) | $ | 5,564 | $ | 4,797 | $ | 3,920 | $ | (6,922 | ) | $ | (8,019 | ) | $ | (7,458 | ) | ||||||||||||||||||||||||
Noninterest income | 12,559 | 3,012 | 3,637 | 5,830 | 2,851 | 7,151 | |||||||||||||||||||||||||||||||||
Total revenue, net of | 18,123 | 7,809 | 7,557 | (1,092 | ) | (5,168 | ) | (307 | ) | ||||||||||||||||||||||||||||||
Provision for credit losses ( 5 ) | 1,061 | 664 | 15 | (3,431 | ) | (3,769 | ) | (5,210 | ) | ||||||||||||||||||||||||||||||
Amortization of intangibles | 512 | 231 | 150 | 2 | – | 5 | |||||||||||||||||||||||||||||||||
Other noninterest expense | 12,565 | 4,679 | 4,341 | 4,716 | 1,124 | 474 | |||||||||||||||||||||||||||||||||
Income (loss) before | 3,985 | 2,235 | 3,051 | (2,379 | ) | (2,523 | ) | 4,424 | |||||||||||||||||||||||||||||||
Income tax expense (benefit) (4 ) | 1,446 | 807 | 1,096 | (2,857 | ) | (1,283 | ) | 1,153 | |||||||||||||||||||||||||||||||
Net income (loss) | $ | 2,539 | $ | 1,428 | $ | 1,955 | $ | 478 | $ | (1,240 | ) | $ | 3,271 | ||||||||||||||||||||||||||
Year end total assets | $ | 254,192 | $ | 189,073 | $ | 137,382 | $ | 79,420 | |||||||||||||||||||||||||||||||
| (1) | There were no material intersegment revenues. |
| (2) | Total assets include asset allocations to match liabilities (i.e., deposits). |
| (3) | Global Card Services is presented on a managed basis with a corresponding offset recorded in All Other . |
| (4) | FTE basis |
| (5 ) | Provision for credit losses represents: For Global Card Services – Provision for credit losses on held loans combined with realized credit losses associated with the securitized loan portfolio and for All Other – Provision for credit losses combined with the Global Card Services securitization offset. |
| 198 | Bank of America 2009 |
Global Card Services is reported on a managed basis which includes a securitization impact adjustment that has the effect of presenting securitized loans in a manner similar to the way loans that have not been sold are presented. All Other results include a corresponding securitization offset that removes the impact of these securitized loans in order to present the consolidated results of the Corporation on a held basis. The table below reconciles Global Card Services and All Other to a held basis by reclassifying net interest income, all other income and realized credit losses associated with the securitized loans to card income.
Global Card Services – Reconciliation
| 2009 | 2008 | 2007 | ||||||||||||||||||||||||||||||||||
| (Dollars in millions) | Managed Basis (1) | Securitization Impact (2) | Held Basis | Managed Basis (1) | Securitization Impact (2) | Held Basis | Managed Basis (1) | Securitization Impact (2) | Held Basis | |||||||||||||||||||||||||||
Net interest income (3) | $ | 20,264 | $ | (9,250 | ) | $ | 11,014 | $ | 19,589 | $ | (8,701 | ) | $ | 10,888 | $ | 16,627 | $ | (8,027 | ) | $ | 8,600 | |||||||||||||||
Noninterest income: | ||||||||||||||||||||||||||||||||||||
Card income | 8,555 | (2,034 | ) | 6,521 | 10,033 | 2,250 | 12,283 | 10,170 | 3,356 | 13,526 | ||||||||||||||||||||||||||
All other income | 523 | (115 | ) | 408 | 1,598 | (219 | ) | 1,379 | 976 | (288 | ) | 688 | ||||||||||||||||||||||||
Total noninterest income | 9,078 | (2,149 | ) | 6,929 | 11,631 | 2,031 | 13,662 | 11,146 | 3,068 | 14,214 | ||||||||||||||||||||||||||
Total revenue, net of interest expense | 29,342 | (11,399 | ) | 17,943 | 31,220 | (6,670 | ) | 24,550 | 27,773 | (4,959 | ) | 22,814 | ||||||||||||||||||||||||
Provision for credit losses | 30,081 | (11,399 | ) | 18,682 | 20,164 | (6,670 | ) | 13,494 | 11,678 | (4,959 | ) | 6,719 | ||||||||||||||||||||||||
Noninterest expense | 7,961 | – | 7,961 | 9,160 | – | 9,160 | 9,377 | – | 9,377 | |||||||||||||||||||||||||||
Income (loss) before income taxes | (8,700 | ) | – | (8,700 | ) | 1,896 | – | 1,896 | 6,718 | – | 6,718 | |||||||||||||||||||||||||
Income tax expense (benefit) (3) | (3,145 | ) | – | (3,145 | ) | 662 | – | 662 | 2,457 | – | 2,457 | |||||||||||||||||||||||||
Net income (loss) | $ | (5,555 | ) | $ | – | $ | (5,555 | ) | $ | 1,234 | $ | – | $ | 1,234 | $ | 4,261 | $ | – | $ | 4,261 | ||||||||||||||||
All Other – Reconciliation
| 2009 | 2008 | 2007 | |||||||||||||||||||||||||||||||||||||
| (Dollars in millions) | Reported Basis (1) | Securitization Offset (2) | As Adjusted | Reported Basis (1) | Securitization Offset (2) | As Adjusted | Reported Basis (1) | Securitization Offset (2) | As Adjusted | ||||||||||||||||||||||||||||||
Net interest income (3) | $ | (6,922 | ) | $ | 9,250 | $ | 2,328 | $ | (8,019 | ) | $ | 8,701 | $ | 682 | $ | (7,458 | ) | $ | 8,027 | $ | 569 | ||||||||||||||||||
Noninterest income: | |||||||||||||||||||||||||||||||||||||||
Card income (loss) | (895 | ) | 2,034 | 1,139 | 2,164 | (2,250 | ) | (86 | ) | 2,817 | (3,356 | ) | (539 | ) | |||||||||||||||||||||||||
Equity investment income | 9,020 | – | 9,020 | 265 | – | 265 | 3,745 | – | 3,745 | ||||||||||||||||||||||||||||||
Gains on sales of debt securities | 4,440 | – | 4,440 | 1,133 | – | 1,133 | 179 | – | 179 | ||||||||||||||||||||||||||||||
All other income (loss) | (6,735 | ) | 115 | (6,620 | ) | (711 | ) | 219 | (492 | ) | 410 | 288 | 698 | ||||||||||||||||||||||||||
Total noninterest income | 5,830 | 2,149 | 7,979 | 2,851 | (2,031 | ) | 820 | 7,151 | (3,068 | ) | 4,083 | ||||||||||||||||||||||||||||
Total revenue, net of interest expense | (1,092 | ) | 11,399 | 10,307 | (5,168 | ) | 6,670 | 1,502 | (307 | ) | 4,959 | 4,652 | |||||||||||||||||||||||||||
Provision for credit losses | (3,431 | ) | 11,399 | 7,968 | (3,769 | ) | 6,670 | 2,901 | (5,210 | ) | 4,959 | (251 | ) | ||||||||||||||||||||||||||
Merger and restructuring charges | 2,721 | – | 2,721 | 935 | – | 935 | 410 | – | 410 | ||||||||||||||||||||||||||||||
All other noninterest expense | 1,997 | – | 1,997 | 189 | – | 189 | 69 | – | 69 | ||||||||||||||||||||||||||||||
Income (loss) before income taxes | (2,379 | ) | – | (2,379 | ) | (2,523 | ) | – | (2,523 | ) | 4,424 | – | 4,424 | ||||||||||||||||||||||||||
Income tax expense (benefit) (3) | (2,857 | ) | – | (2,857 | ) | (1,283 | ) | – | (1,283 | ) | 1,153 | – | 1,153 | ||||||||||||||||||||||||||
Net income (loss) | $ | 478 | $ | – | $ | 478 | $ | (1,240 | ) | $ | – | $ | (1,240 | ) | $ | 3,271 | $ | – | $ | 3,271 | |||||||||||||||||||
| (1) | Provision for credit losses represents: For Global Card Services – Provision for credit losses on held loans combined with realized credit losses associated with the securitized loan portfolio and for All Other – Provision for credit losses combined with the Global Card Services securitization offset. |
| (2) | The securitization impact/offset on net interest income is on a funds transfer pricing methodology consistent with the way funding costs are allocated to the businesses. |
| (3) | FTE basis |
| Bank of America 2009 | 199 |
The following tables present a reconciliation of the six business segments' ( Deposits, Global Card Services, Home Loans & Insurance, Global Banking, Global Markets and GWIM ) total revenue, net of interest expense, on a FTE basis, and net income to the Consolidated Statement of Income, and total assets to the Consolidated Balance Sheet. The adjustments presented in the tables below include consolidated income, expense and asset amounts not specifically allocated to individual business segments.
| (Dollars in millions) | 2009 | 2008 | 2007 | |||||||||
Segment total revenue, net of interest expense (1) | $ | 122,036 | $ | 79,144 | $ | 68,889 | ||||||
Adjustments: | ||||||||||||
ALM activities | (960 | ) | 2,605 | 66 | ||||||||
Equity investment income | 9,020 | 265 | 3,745 | |||||||||
Liquidating businesses | 1,300 | 256 | 1,060 | |||||||||
FTE basis adjustment | (1,301 | ) | (1,194 | ) | (1,749 | ) | ||||||
Managed securitization impact to total revenue, net of interest expense | (11,399 | ) | (6,670 | ) | (4,959 | ) | ||||||
Other | 947 | (1,624 | ) | (219 | ) | |||||||
Consolidated revenue, net of interest expense | $ | 119,643 | $ | 72,782 | $ | 66,833 | ||||||
Segment net income | $ | 5,798 | $ | 5,248 | $ | 11,711 | ||||||
Adjustments, net of taxes: | ||||||||||||
ALM activities | (6,278 | ) | (554 | ) | (241 | ) | ||||||
Equity investment income | 5,683 | 167 | 2,359 | |||||||||
Liquidating businesses | 445 | 86 | 613 | |||||||||
Merger and restructuring charges | (1,714 | ) | (630 | ) | (258 | ) | ||||||
Other | 2,342 | (309 | ) | 798 | ||||||||
Consolidated net income | $ | 6,276 | $ | 4,008 | $ | 14,982 | ||||||
| (1) | FTE basis |
| December 31 | ||||||||
| (Dollars in millions) | 2009 | 2008 | ||||||
Segment total assets | $ | 2,085,917 | $ | 1,738,523 | ||||
Adjustments: | ||||||||
ALM activities, including securities portfolio | 560,063 | 552,796 | ||||||
Equity investments | 34,662 | 31,422 | ||||||
Liquidating businesses | 22,244 | 3,172 | ||||||
Elimination of segment excess asset allocations to match liabilities | (561,607 | ) | (439,162 | ) | ||||
Elimination of managed securitized loans (1) | (89,715 | ) | (100,960 | ) | ||||
Other | 171,735 | 32,152 | ||||||
Consolidated total assets | $ | 2,223,299 | $ | 1,817,943 | ||||
| (1) | Represents Global Card Services securitized loans. |
| 200 | Bank of America 2009 |
NOTE 24 – Parent Company Information
The following tables present the Parent Company Only financial information:
Condensed Statement of Income
| (Dollars in millions) | 2009 | 2008 | 2007 | |||||||||
Income | ||||||||||||
Dividends from subsidiaries: | ||||||||||||
Bank holding companies and related subsidiaries | $ | 4,100 | $ | 18,178 | $ | 20,615 | ||||||
Nonbank companies and related subsidiaries | 27 | 1,026 | 181 | |||||||||
Interest from subsidiaries | 1,179 | 3,433 | 4,939 | |||||||||
Other income | 7,784 | 940 | 3,319 | |||||||||
Total income | 13,090 | 23,577 | 29,054 | |||||||||
Expense | ||||||||||||
Interest on borrowed funds | 4,737 | 6,818 | 7,834 | |||||||||
Noninterest expense | 4,238 | 1,829 | 3,127 | |||||||||
Total expense | 8,975 | 8,647 | 10,961 | |||||||||
Income before income taxes and equity in undistributed earnings of subsidiaries | 4,115 | 14,930 | 18,093 | |||||||||
Income tax benefit | 85 | 1,793 | 1,136 | |||||||||
Income before equity in undistributed earnings of subsidiaries | 4,200 | 16,723 | 19,229 | |||||||||
Equity in undistributed earnings (losses) of subsidiaries: | ||||||||||||
Bank holding companies and related subsidiaries | (2,183 | ) | (11,221 | ) | (4,497 | ) | ||||||
Nonbank companies and related subsidiaries | 4,259 | (1,494 | ) | 250 | ||||||||
Total equity in undistributed earnings (losses) of subsidiaries | 2,076 | (12,715 | ) | (4,247 | ) | |||||||
Net income | $ | 6,276 | $ | 4,008 | $ | 14,982 | ||||||
Net income (loss) applicable to common shareholders | $ | (2,204 | ) | $ | 2,556 | $ | 14,800 |
Condensed Balance Sheet
| December 31 | ||||||
| (Dollars in millions) | 2009 | 2008 | ||||
Assets | ||||||
Cash held at bank subsidiaries | $ | 91,892 | $ | 98,525 | ||
Debt securities | 8,788 | 16,241 | ||||
Receivables from subsidiaries: | ||||||
Bank holding companies and related subsidiaries | 58,931 | 39,239 | ||||
Nonbank companies and related subsidiaries | 13,043 | 23,518 | ||||
Investments in subsidiaries: | ||||||
Bank holding companies and related subsidiaries | 206,994 | 172,460 | ||||
Nonbank companies and related subsidiaries | 47,078 | 20,355 | ||||
Other assets | 13,773 | 20,428 | ||||
Total assets | $ | 440,499 | $ | 390,766 | ||
Liabilities and shareholders' equity | ||||||
Commercial paper and other short-term borrowings | $ | 5,968 | $ | 26,536 | ||
Accrued expenses and other liabilities | 19,204 | 15,244 | ||||
Payables to subsidiaries: | ||||||
Bank holding companies and related subsidiaries | 363 | 469 | ||||
Nonbank companies and related subsidiaries | 632 | 3 | ||||
Long-term debt | 182,888 | 171,462 | ||||
Shareholders' equity | 231,444 | 177,052 | ||||
Total liabilities and shareholders' equity | $ | 440,499 | $ | 390,766 | ||
| Bank of America 2009 | 201 |
Condensed Statement of Cash Flows
| (Dollars in millions) | 2009 | 2008 | 2007 | |||||||||
Operating activities | ||||||||||||
Net income | $ | 6,276 | $ | 4,008 | $ | 14,982 | ||||||
Reconciliation of net income to net cash provided by operating activities: | ||||||||||||
Equity in undistributed (earnings) losses of subsidiaries | (2,076 | ) | 12,715 | 4,247 | ||||||||
Other operating activities, net | 8,889 | (598 | ) | (276 | ) | |||||||
Net cash provided by operating activities | 13,089 | 16,125 | 18,953 | |||||||||
Investing activities | ||||||||||||
Net (purchases) sales of securities | 3,729 | (12,142 | ) | (839 | ) | |||||||
Net payments from (to) subsidiaries | (29,926 | ) | 2,490 | (44,457 | ) | |||||||
Other investing activities, net | (17 | ) | 43 | (824 | ) | |||||||
Net cash used in investing activities | (26,214 | ) | (9,609 | ) | (46,120 | ) | ||||||
Financing activities | ||||||||||||
Net increase (decrease) in commercial paper and other short-term borrowings | (20,673 | ) | (14,131 | ) | 8,873 | |||||||
Proceeds from issuance of long-term debt | 30,347 | 28,994 | 38,730 | |||||||||
Retirement of long-term debt | (20,180 | ) | (13,178 | ) | (12,056 | ) | ||||||
Proceeds from issuance of preferred stock | 49,244 | 34,742 | 1,558 | |||||||||
Repayment of preferred stock | (45,000 | ) | – | – | ||||||||
Proceeds from issuance of common stock | 13,468 | 10,127 | 1,118 | |||||||||
Common stock repurchased | – | – | (3,790 | ) | ||||||||
Cash dividends paid | (4,863 | ) | (11,528 | ) | (10,878 | ) | ||||||
Other financing activities, net | 4,149 | 5,030 | 576 | |||||||||
Net cash provided by financing activities | 6,492 | 40,056 | 24,131 | |||||||||
Net increase (decrease) in cash held at bank subsidiaries | (6,633 | ) | 46,572 | (3,036 | ) | |||||||
Cash held at bank subsidiaries at January 1 | 98,525 | 51,953 | 54,989 | |||||||||
Cash held at bank subsidiaries at December 31 | $ | 91,892 | $ | 98,525 | $ | 51,953 | ||||||
NOTE 25 – Performance by Geographical Area
Since the Corporation's operations are highly integrated, certain asset, liability, income and expense amounts must be allocated to arrive at total assets, total revenue, net of interest expense, income before income taxes and net income by geographic area. The Corporation identifies its geographic performance based on the business unit structure used to manage the capital or expense deployed in the region as applicable. This requires certain judgments related to the allocation of revenue so that revenue can be appropriately matched with the related expense or capital deployed in the region.
| December 31 | Year Ended December 31 | |||||||||||||||||
| (Dollars in millions) | Year | Total Assets (1) | Total Revenue, Net of Interest Expense (2) | Income Before | Net Income (Loss) | |||||||||||||
Domestic (3) | 2009 | $ | 1,840,232 | $ | 98,278 | $ | (6,901 | ) | $ | (1,025 | ) | |||||||
| 2008 | 1,678,853 | 67,549 | 3,289 | 3,254 | ||||||||||||||
| 2007 | 60,245 | 18,039 | 13,137 | |||||||||||||||
Asia (4) | 2009 | 118,921 | 10,685 | 8,096 | 5,101 | |||||||||||||
| 2008 | 50,567 | 1,770 | 1,207 | 761 | ||||||||||||||
| 2007 | 1,613 | 1,146 | 721 | |||||||||||||||
Europe, Middle East and Africa | 2009 | 239,374 | 9,085 | 2,295 | 1,652 | |||||||||||||
| 2008 | 78,790 | 3,020 | (456 | ) | (252 | ) | ||||||||||||
| 2007 | 4,097 | 894 | 592 | |||||||||||||||
Latin America and the Caribbean | 2009 | 24,772 | 1,595 | 870 | 548 | |||||||||||||
| 2008 | 9,733 | 443 | 388 | 245 | ||||||||||||||
| 2007 | 878 | 845 | 532 | |||||||||||||||
Total Foreign | 2009 | 383,067 | 21,365 | 11,261 | 7,301 | |||||||||||||
| 2008 | 139,090 | 5,233 | 1,139 | 754 | ||||||||||||||
| 2007 | 6,588 | 2,885 | 1,845 | |||||||||||||||
Total Consolidated | 2009 | $ | 2,223,299 | $ | 119,643 | $ | 4,360 | $ | 6,276 | |||||||||
| 2008 | 1,817,943 | 72,782 | 4,428 | 4,008 | ||||||||||||||
| 2007 | 66,833 | 20,924 | 14,982 | |||||||||||||||
| (1) | Total assets include long-lived assets, which are primarily located in the U.S. |
| (2) | There were no material intercompany revenues between geographic regions for any of the periods presented. |
| (3) | Includes the Corporation's Canadian operations, which had total assets of $31.1 billion and $13.5 billion at December 31, 2009 and 2008; total revenue, net of interest expense of $2.5 billion, $1.2 billion and $770 million; income before income taxes of $723 million, $552 million and $292 million; and net income of $488 million, $404 million and $195 million for 2009, 2008 and 2007, respectively. |
| (4) | The year ended December 31, 2009 amount includes pre-tax gains of $7.3 billion ($4.7 billion net-of-tax) on the sale of common shares of the Corporation's initial investment in CCB. |
| 202 | Bank of America 2009 |
Item 9. Changes in and Disagreements with Accountants on Accounting and Financial Disclosure
There were no changes in or disagreements with accountants on accounting and financial disclosure.
Item 9A. Controls And Procedures
Disclosure Controls and Procedures
As of the end of the period covered by this report and pursuant to Rule 13a-15 of the Securities Exchange Act of 1934 (Exchange Act), Bank of America's management, including the Chief Executive Officer and Interim Chief Financial Officer, conducted an evaluation of the effectiveness and design of our disclosure controls and procedures (as that term is defined in Rule 13a-15(e) of the Exchange Act). Based upon that evaluation, Bank of America's Chief Executive Officer and Interim Chief Financial Officer concluded that Bank of America's disclosure controls and procedures were effective, as of the end of the period covered by this report, in recording, processing, summarizing and reporting information required to be disclosed, within the time periods specified in the SEC's rules and forms.
Report of Management on Internal Control Over Financial Reporting
The Report of Management on Internal Control over Financial Reporting is set forth on page 112 and incorporated herein by reference. The Report of Independent Registered Public Accounting Firm with respect to the Corporation's internal control over financial reporting is set forth on page 113 and incorporated herein by reference.
Changes in Internal Control Over Financial Reporting
There have been no changes in our internal control over financial reporting (as defined in Rule 13a-15(f) of the Exchange Act) during the quarter ended December 31, 2009, that materially affected, or are reasonably likely to materially affect, our internal control over financial reporting.
Item 9B. Other Information
None
| Bank of America 2009 | 203 |
Part III |
| Bank of America Corporation and Subsidiaries |
Item 10. Directors, Executive Officers and Corporate Governance
Information included under the following captions in the Corporation's proxy statement relating to its 2010 annual meeting of stockholders (the 2010 Proxy Statement) is incorporated herein by reference:
| • | "Item 1: Election of Directors – The Nominees"; |
| • | "Section 16(a) Beneficial Ownership Reporting Compliance"; |
| • | "Corporate Governance – Additional Corporate Governance Information, Committee Charters and Code of Ethics"; |
| • | "Corporate Governance – Code of Ethics"; and |
Additional information required by Item 10 with respect to executive officers is set forth under "Executive Officers of The Registrant" in Part I of this report. Information regarding the Corporation's directors is set forth in the 2010 Proxy Statement under the caption "Item 1: Election of Directors – The Nominees."
Item 11. Executive Compensation
Information included under the following captions in the 2010 Proxy Statement is incorporated herein by reference:
| • | "Compensation Discussion and Analysis"; |
| • | "Executive Compensation"; |
| • | "Director Compensation"; |
| • | "Compensation and Benefits Committee Report"; and |
| • | "Compensation and Benefits Committee Interlocks and Insider Participation." |
Item 12. Security Ownership of Certain Beneficial Owners and Management and Related Stockholder Matters
Information included under the following caption in the 2010 Proxy Statement is incorporated herein by reference:
| • | "Stock Ownership." |
The following table presents information on equity compensation plans at December 31, 2009:
| Plan Category (1) (2) | Number of Shares to be Issued Under Outstanding Options and Rights (3) | Weighted Average Exercise Price of Outstanding Options (4) | Number of Shares | ||||
Plans approved by the Corporation's shareholders | 286,824,064 | $40.53 | 283,604,110 | (5) | |||
Plans not approved by the Corporation's shareholders (6) | 126,222,932 | $66.99 | 49,092,032 | (7) | |||
Total | 413,046,996 | $48.11 | 332,696,142 |
| (1) | This table does not include outstanding options to purchase 14,078,269 shares of the Corporation's common stock that were assumed by the Corporation in connection with prior acquisitions, under whose plans the options were originally granted. The weighted average option price of these assumed options was $73.55 at December 31, 2009. Also, at December 31, 2009 there were 324,681 vested deferred restricted stock units associated with these plans. No additional awards were granted under these plans following the respective dates of acquisition. |
| (2) | This table does not include outstanding options to purchase 13,726,608 shares of the Corporation's common stock that were assumed by the Corporation in connection with the Merrill Lynch acquisition, which were originally issued under certain Merrill Lynch plans. The weighted average option price of these assumed options was $57.50 at December 31, 2009. Also, at December 31, 2009 there were 27,242,816 outstanding restricted stock units and 1,980,847 vested deferred restricted stock units and stock option gain deferrals associated with such plans. These Merrill Lynch plans were frozen at the time of the acquisition and no additional awards may be granted under these plans. However, as previously approved by the Corporation's shareholders, if any of the outstanding awards under these frozen plans subsequently are cancelled, forfeited or settled in cash, the shares relating to such awards thereafter will be available for future awards issued under the Corporation's Key Associate Stock Plan (KASP). |
| (3) | Includes 89,089,935 outstanding restricted stock units and 834,728 vested deferred restricted stock units under plans approved by the Corporation's shareholders and 47,204,462 outstanding restricted stock units under plans not approved by the Corporation's shareholders. |
| (4) | Does not reflect restricted stock units included in the first column, which do not have an exercise price. |
| (5) | Includes 282,870,925 shares of common stock available for future issuance under the KASP (including 9,479,676 shares originally subject to awards outstanding under frozen Merrill Lynch plans at the time of the acquisition which subsequently have been cancelled, forfeited or settled in cash and become available for issuance under the KASP, as described in note (2) above) and 733,185 shares of common stock which are available for future issuance under the Corporation's Directors' Stock Plan. |
| (6) | In connection with the Merrill Lynch acquisition, the Corporation assumed and has continued to issue awards in accordance with applicable NYSE listing standards under the following plans, which were not approved by the Corporation's shareholders: the Merrill Lynch Employee Stock Compensation Plan (ESCP) and the Merrill Lynch Employee Stock Purchase Plan (ESPP), both of which were approved by Merrill Lynch's shareholders prior to the acquisition. The material features of these plans are described below under the heading "Description of Plans Not Approved by the Corporation's Shareholders." |
| (7) | This amount includes 36,661,929 shares of common stock available for future issuance under the ESCP and 12,430,103 shares of common stock available for future issuance under the ESPP. |
Description of Plans Not Approved by the Corporation's Shareholders
Merrill Lynch Employee Stock Compensation Plan. The ESCP covers associates who were salaried key employees of Merrill Lynch or its subsidiaries immediately prior to the effective date of the Merrill Lynch acquisition, other than executive officers. Under the ESCP, the Corporation may award restricted shares, restricted units, incentive stock options, nonqualified stock options and stock appreciation rights. Awards of restricted shares and restricted units are subject to a vesting schedule
specified in the grant documentation. Restricted shares and restricted units under the ESCP may generally be cancelled prior to the vesting date in the event of (i) violation of covenants specified in the grant documentation (including, but not limited to, non-competition, non-solicitation, nondisparagement and confidentiality covenants) or (ii) termination of employment prior to the end of the vesting period (except in certain limited circumstances, such as death, disability and retirement). Options have an exercise price equal to the fair market value of the stock on the date of grant. Options granted under the ESCP expire
| 204 | Bank of America 2009 |
not more than 10 years from the date of grant, and the applicable grant documentation specifies the extent to which options may be exercised during their respective terms, including in the event of an associate's death, disability or termination of employment. Shares that are cancelled, forfeited or settled in cash from an additional frozen Merrill Lynch plan also will become available for grant under the ESCP.
Merrill Lynch Employee Stock Purchase Plan . The purpose of the ESPP is to give employees of Merrill Lynch and its eligible subsidiaries an opportunity to purchase the Corporation's common stock through payroll deductions (an employee can elect either payroll deductions of 1% to 10% of current compensation or an annual dollar amount equal to a maximum of 10% of current eligible compensation). Shares are purchased quarterly at 95% of the fair market value (average of the highest and lowest share prices) on the date of the purchase and the maximum annual contribution is $23,750. An associate is eligible to participate if he or she was employed by Merrill Lynch or any participating subsidiary for at least one full year by the start of the new plan year.
For additional information on our equity compensation plans see Note 18 – Stock-Based Compensation Plans to the Consolidated Financial Statements beginning on page 182 which is incorporated herein by reference.
Item 13. Certain Relationships and Related Transactions, and Director Independence
Information included under the following captions in the 2010 Proxy Statement is incorporated herein by reference:
| • | "Certain Transactions"; |
| • | "Review of Related Person Transactions"; and |
| • | "Corporate Governance – Director Independence." |
Item 14. Principal Accounting Fees and Services
Information included under the following caption in the 2010 Proxy Statement is incorporated herein by reference:
| • | "Item 2: Ratification of the Registered Independent Public Accounting Firm for 2010 – Fees to Registered Independent Public Accounting Firm for 2009 and 2008" and "– Pre-approval Policies and Procedures." |
| Bank of America 2009 | 205 |
Part IV |
| Bank of America Corporation and Subsidiaries |
Item 15. Exhibits, Financial Statement Schedules
The following documents are filed as part of this report: | |||||
| (1 | ) | Financial Statements: | |||
Report of Independent Registered Public Accounting Firm | |||||
Consolidated Statement of Income for the years ended December 31, 2009, 2008 and 2007 | |||||
Consolidated Balance Sheet at December 31, 2009 and 2008 | |||||
Consolidated Statement of Changes in Shareholders' Equity for the years ended December 31, 2008, 2007 and 2006 | |||||
Consolidated Statement of Cash Flows for the years ended December 31, 2009, 2008 and 2007 | |||||
Notes to Consolidated Financial Statements | |||||
| (2 | ) | Schedules: | |||
None | |||||
| (3 | ) | The exhibits filed as part of this report and exhibits incorporated herein by reference to other documents are listed in the Index to Exhibits to this Annual Report on Form 10-K (pages E-1 through E-5, including executive compensation plans and arrangements which are listed under Exhibit Nos. 10(a) through 10(ddd)). |
With the exception of the information expressly incorporated herein by reference, the 2010 Proxy Statement is not to be deemed filed as part of this Annual Report on Form 10-K.
| 206 | Bank of America 2009 |
Signatures
Pursuant to the requirements of Section 13 of the Securities Exchange Act of 1934, the registrant has duly caused this report to be signed on its behalf by the undersigned, thereunto duly authorized.
Date: February 26, 2010
| Bank of America Corporation | ||
| By: | */s/ Brian T. Moynihan | |
Brian T. Moynihan Chief Executive Officer and President | ||
Pursuant to the requirements of the Securities Exchange Act of 1934, this report has been signed below by the following persons on behalf of the registrant and in the capacities and on the dates indicated.
Signature | Title | Date | ||
*/s/ Brian T. Moynihan Brian T. Moynihan | Chief Executive Officer, | February 26, 2010 | ||
*/s/ Neil Cotty Neil Cotty | Interim Chief Financial Officer | February 26, 2010 | ||
*/s/ Susan S. Bies Susan S. Bies | Director | February 26, 2010 | ||
*/s/ William P. Boardman William P. Boardman | Director | February 26, 2010 | ||
*/s/ Frank P. Bramble, Sr. Frank P. Bramble, Sr. | Director | February 26, 2010 | ||
*/s/ Virgis W. Colbert Virgis W. Colbert | Director | February 26, 2010 | ||
*/s/ Charles K. Gifford Charles K. Gifford | Director | February 26, 2010 | ||
*/s/ Charles O. Holliday, Jr. Charles O. Holliday, Jr. | Director | February 26, 2010 | ||
*/s/ D. Paul Jones D. Paul Jones | Director | February 26, 2010 | ||
| Bank of America 2009 | 207 |
Signature | Title | Date | ||
*/s/ Monica C. Lozano Monica C. Lozano | Director | February 26, 2010 | ||
*/s/ Walter E. Massey Walter E. Massey | Director | February 26, 2010 | ||
*/s/ Thomas J. May Thomas J. May | Director | February 26, 2010 | ||
*/s/ Donald E. Powell Donald E. Powell | Director | February 26, 2010 | ||
*/s/ Charles O. Rossotti Charles O. Rossotti | Director | February 26, 2010 | ||
*/s/ Thomas M. Ryan Thomas M. Ryan | Director | February 26, 2010 | ||
*/s/ Robert W. Scully Robert W. Scully | Director | February 26, 2010 | ||
*By: /s/ Teresa M. Brenner Teresa M. Brenner Attorney-in-Fact | ||||
| 208 | Bank of America 2009 |
Index to Exhibits
Exhibit No. | Description | |
| 2(a) | Agreement and Plan of Merger dated as of September 15, 2008 by and between Merrill Lynch & Co., Inc. and the registrant, incorporated by reference to Exhibit 2.1 of registrant's Current Report on Form 8-K (File No. 1-6523) filed September 18, 2008. | |
| 3(a) | Amended and Restated Certificate of Incorporation of registrant, as in effect on the date hereof, filed herewith. | |
| (b) | Amended and Restated Bylaws of registrant, as in effect on the date hereof, incorporated by reference to Exhibit 3.2 of registrant's Current Report on Form 8-K (File No. 1-6523) filed December 15, 2008. | |
| 4(a) | Indenture dated as of January 1, 1995 between registrant (successor to NationsBank Corporation) and BankAmerica National Trust Company incorporated by reference to Exhibit 4.1 of registrant's Registration Statement on Form S-3 (Registration No. 33-57533); First Supplemental Indenture thereto dated as of September 18, 1998, between registrant and U.S. Bank Trust National Association (successor to BankAmerica National Trust Company), incorporated by reference to Exhibit 4.3 of registrant's Current Report on Form 8-K (File No. 1-6523) filed November 18, 1998; Second Supplemental Indenture thereto dated as of May 7, 2001 between registrant, U.S. Bank Trust National Association, as Prior Trustee, and The Bank of New York, as Successor Trustee, incorporated by reference to Exhibit 4.4 of registrant's Current Report on Form 8-K (File No. 1-6523) filed June 14, 2001; Third Supplemental Indenture thereto dated as of July 28, 2004, between registrant and The Bank of New York, incorporated by reference to Exhibit 4.2 of registrant's Current Report on Form 8-K (File No. 1-6523) filed August 27, 2004; Fourth Supplemental Indenture thereto dated as of April 28, 2006 between the registrant and The Bank of New York, incorporated by reference to Exhibit 4.6 of registrant's Registration Statement on Form S-3 (Registration No. 333-133852); and Fifth Supplemental Indenture dated as of December 1, 2008 between the registrant and The Bank of New York Mellon Trust Company, N.A. (successor to The Bank of New York), incorporated by reference to Exhibit 4.1 of registrant's Current Report on Form 8-K (File No. 1-6523) filed December 5, 2008. | |
| (b) | Form of Senior Registered Note, incorporated by reference to Exhibit 4.7 of registrant's Registration Statement on Form S-3 (Registration No. 333-133852). | |
| (c) | Form of Global Senior Medium-Term Note, Series L, incorporated by reference to Exhibit 4.12 of registrant's Registration Statement on Form S-3 (Registration No. 333-158663). | |
| (d) | Indenture dated as of January 1, 1995 between registrant (successor to NationsBank Corporation) and The Bank of New York, incorporated by reference to Exhibit 4.5 of registrant's Registration Statement on Form S-3 (Registration No. 33-57533); First Supplemental Indenture thereto dated as of August 28, 1998, between registrant and The Bank of New York, incorporated by reference to Exhibit 4.8 of registrant's Current Report on Form 8-K (File No. 1-6523) filed November 18, 1998; and Second Supplemental Indenture thereto dated as of January 25, 2007, between registrant and The Bank of New York Trust Company, N.A. (successor to The Bank of New York), incorporated by reference to Exhibit 4.3 of registrant's Registration Statement on Form S-4 (Registration No. 333-141361). | |
| (e) | Form of Subordinated Registered Note, incorporated by reference to Exhibit 4.10 of registrant's Registration Statement on Form S-3 (Registration No. 333-133852). | |
| (f) | Form of Global Subordinated Medium-Term Note, Series L, incorporated by reference to Exhibit 4.17 of registrant's Registration Statement on Form S-3 (Registration No. 333-158663). | |
| (g) | Agency Agreement dated as of July 22, 2009, among the registrant, The Bank of New York Mellon, Bank of America, N.A., London Agent, Merrill Lynch Limited and other agents, incorporated by reference to Exhibit 4.1 of the registrant's Current Report on Form 8-K (File No. 1-6523) filed July 28, 2009. | |
| (h) | Amended and Restated Senior Indenture dated as of July 1, 2001 between registrant and The Bank of New York, pursuant to which registrant issued its Senior InterNotes SM , incorporated by reference to Exhibit 4.1 of registrant's Registration Statement on Form S-3 (Registration No. 333-65750). | |
| (i) | Amended and Restated Subordinated Indenture dated as of July 1, 2001 between registrant and The Bank of New York, pursuant to which registrant issued its Subordinated InterNotes SM , incorporated by reference to Exhibit 4.2 of registrant's Registration Statement on Form S-3 (Registration No. 333-65750). | |
| (j) | Restated Indenture dated as of November 1, 2001 between registrant and The Bank of New York, incorporated by reference to Exhibit 4.10 of registrant's Registration Statement on Form S-3 (Registration No. 333-70984). | |
| (k) | First Supplemental Indenture dated as of December 14, 2001 to the Restated Indenture dated as of November 1, 2001 between registrant and The Bank of New York pursuant to which registrant issued its 7% Junior Subordinated Notes due 2031, incorporated by reference to Exhibit 4.3 of registrant's Current Report on Form 8-K (File No. 1-6523) filed December 14, 2001. | |
| (l) | Second Supplemental Indenture dated as of January 31, 2002 to the Restated Indenture dated as of November 1, 2001 between registrant and The Bank of New York pursuant to which registrant issued its 7% Junior Subordinated Notes due 2032, incorporated by reference to Exhibit 4.3 of registrant's Current Report on Form 8-K (File No. 1-6523) filed January 31, 2002. | |
| (m) | Third Supplemental Indenture dated as of August 9, 2002 to the Restated Indenture dated as of November 1, 2001 between registrant and The Bank of New York pursuant to which registrant issued its 7% Junior Subordinated Notes due 2032, incorporated by reference to Exhibit 4.3 of registrant's Current Report on Form 8-K (File No. 1-6523) filed August 9, 2002. | |
| (n) | Fourth Supplemental Indenture dated as of April 30, 2003 to the Restated Indenture dated as of November 1, 2001 between registrant and The Bank of New York pursuant to which registrant issued its 5 7 / 8 % Junior Subordinated Notes due 2033, incorporated by reference to Exhibit 4.3 of registrant's Current Report on Form 8-K (File No. 1-6523) filed April 30, 2003. |
| E-1 |
Exhibit No. | Description | |
| (o) | Fifth Supplemental Indenture dated as of November 3, 2004 to the Restated Indenture dated as of November 1, 2001 between registrant and The Bank of New York pursuant to which registrant issued its 6% Junior Subordinated Notes due 2034, incorporated by reference to Exhibit 4.3 of registrant's Current Report on Form 8-K (File No. 1-6523) filed November 3, 2004. | |
| (p) | Sixth Supplemental Indenture dated as of March 8, 2005 to the Restated Indenture dated as of November 1, 2001 between the registrant and The Bank of New York pursuant to which registrant issued its 5 5 / 8 % Junior Subordinated Notes due 2035, incorporated by reference to Exhibit 4.3 of registrant's Current Report on Form 8-K (File No. 1-6523) filed March 9, 2005. | |
| (q) | Seventh Supplemental Indenture dated as of August 10, 2005 to the Restated Indenture dated as of November 1, 2001 between the registrant and The Bank of New York pursuant to which registrant issued its 5 1 / 4 % Junior Subordinated Notes due 2035, incorporated by reference to Exhibit 4.3 of registrant's Current Report on Form 8-K (File No. 1-6523) filed August 11, 2005. | |
| (r) | Eighth Supplemental Indenture dated as of August 25, 2005 to the Restated Indenture dated as of November 1, 2001 between the registrant and The Bank of New York pursuant to which registrant issued its 6% Junior Subordinated Notes due 2035, incorporated by reference to Exhibit 4.3 of the Current Report on Form 8-K (File No. 1-6523) filed August 26, 2005. | |
| (s) | Tenth Supplemental Indenture dated as of March 28, 2006 to the Restated Indenture dated as of November 1, 2001 between the registrant and The Bank of New York pursuant to which registrant issued its 6 1 / 4 % Junior Subordinated Notes due 2055, incorporated by reference to Exhibit 4(bb) of registrant's 2006 Annual Report on Form 10-K (File No. 1-6523) (the "2006 10-K"). | |
| (t) | Eleventh Supplemental Indenture dated as of May 23, 2006 to the Restated Indenture dated as of November 1, 2001 between the registrant and The Bank of New York pursuant to which registrant issued its 6 5 / 8 % Junior Subordinated Notes due 2036, incorporated by reference to Exhibit 4(cc) of the 2006 10-K. | |
| (u) | Twelfth Supplemental Indenture dated as of August 2, 2006 to the Restated Indenture dated as of November 1, 2001 between the registrant and The Bank of New York pursuant to which registrant issued its 6 7 / 8 % Junior Subordinated Notes due 2055, incorporated by reference to Exhibit 4(dd) of the 2006 10-K. | |
| (v) | Thirteenth Supplemental Indenture dated as of February 16, 2007 to the Restated Indenture dated as of November 1, 2001 between the registrant and The Bank of New York Trust Company, N.A. (successor to The Bank of New York) pursuant to which registrant issued its Remarketable Floating Rate Junior Subordinated Notes due 2043, incorporated by reference to Exhibit 4.6 of registrant's Current Report on Form 8-K (File No. 1-6523) filed February 16, 2007. | |
| (w) | Fourteenth Supplemental Indenture dated as of February 16, 2007 to the Restated Indenture dated as of November 1, 2001 between the registrant and The Bank of New York Trust Company, N.A. (successor to The Bank of New York) pursuant to which registrant issued its Remarketable Fixed Rate Junior Subordinated Notes due 2043, incorporated by reference to Exhibit 4.7 of registrant's Current Report on Form 8-K (File No. 1-6523) filed February 16, 2007. | |
| (x) | Fifteenth Supplemental Indenture dated as of May 31, 2007 to the Restated Indenture dated as of November 1, 2001 between the registrant and The Bank of New York Trust Company, N.A. (successor to The Bank of New York) pursuant to which registrant issued its Floating Rate Junior Subordinated Notes due 2056, incorporated by reference to Exhibit 4.4 of registrant's Current Report on Form 8-K (File No. 1-6523) filed June 1, 2007. | |
| (y) | Form of Supplemental Indenture to be used in connection with the issuance of registrant's junior subordinated notes, including form of Junior Subordinated Note, incorporated by reference to Exhibit 4.44 of registrant's Registration Statement on Form S-3 (Registration No. 333-133852). | |
| (z) | Form of Guarantee with respect to capital securities to be issued by various capital trusts, incorporated by reference to Exhibit 4.47 of registrant's Registration Statement on Form S-3 (Registration No. 333-133852). | |
| (aa) | Agreement of Appointment and Acceptance dated as of December 29, 2006 between registrant and The Bank of New York Trust Company, N.A., incorporated by reference to Exhibit 4(aaa) of the 2006 10-K. | |
| (bb) | Global Agency Agreement dated as of July 25, 2007 among Bank of America, N.A., Deutsche Bank Trust Company Americas, Deutsche Bank AG, London Branch, and Deutsche Bank Luxembourg S.A, incorporated by reference to Exhibit 4(x) of registrant's 2008 Annual Report on Form 10-K (File No. 1-6523) (the "2008 10-K"). | |
| (cc) | Supplement to Global Agency Agreement dated as of December 19, 2008 among Bank of America, N.A., Deutsche Bank Trust Company Americas, Deutsche Bank AG, London Branch and Deutsche Bank Luxembourg S.A, incorporated by reference to Exhibit 4(y) of the 2008 10-K. | |
The registrant has other long-term debt agreements, but these are omitted pursuant Item 601(6)(4)(iii) of Regulation S-K. Copies of these agreements will be furnished to the Commission on request. | ||
| 10(a) | NationsBank Corporation and Designated Subsidiaries Supplemental Executive Retirement Plan, incorporated by reference to Exhibit 10(j) of registrant's 1994 Annual
Report on Form 10-K (File No. 1-6523) (the "1994 10-K"); Amendment thereto dated as of June 28, 1989, incorporated by reference to Exhibit 10(g) of registrant's 1989 Annual Report on Form 10-K (File No. 1-6523) (the "1989
10-K"); Amendment thereto dated as of June 27, 1990, incorporated by reference to Exhibit 10(g) of registrant's 1990 Annual Report on Form 10-K (File No. 1-6523) (the "1990 10-K"); Amendment thereto dated as of July 21, 1991,
incorporated by reference to Exhibit 10(bb) of registrant's 1991 Annual Report on Form 10-K (File No. 1-6523) (the "1991 10-K"); Amendments thereto dated as of December 3, 1992 and December 15, 1992, incorporated by reference to
Exhibit 10(l) of registrant's 1992 Annual Report on Form 10-K (File No. 1-6523) (the "1992 10-K"); Amendment thereto dated as of September 28, 1994, incorporated by reference to Exhibit 10(j) of registrant's 1994 10-K; |
| E-2 |
Exhibit No. | Description | |
Amendments thereto dated March 27, 1996 and June 25, 1997, incorporated by reference to Exhibit 10(c) of registrant's 1997 Annual Report on Form 10-K; Amendments thereto dated April 10, 1998, June 24, 1998 and October 1, 1998, incorporated by reference to Exhibit 10(b) of registrant's 1998 Annual Report on Form 10-K (File No. 1-6523) (the "1998 10-K"); Amendment thereto dated December 14, 1999, incorporated by reference to Exhibit 10(b) of registrant's 1999 Annual Report on Form 10-K; Amendment thereto dated as of March 28, 2001, incorporated by reference to Exhibit 10(b) of registrant's 2001 Annual Report on Form 10-K (File No. 1-6523) (the "2001 10-K"); and Amendment thereto dated December 10, 2002, incorporated by reference to Exhibit 10(b) of registrant's 2002 Annual Report on Form 10-K (File No. 1-6523) (the "2002 10-K").* | ||
| (b) | NationsBank Corporation and Designated Subsidiaries Deferred Compensation Plan for Key Employees, incorporated by reference to Exhibit 10(k) of the 1994 10-K; Amendment thereto dated as of June 28, 1989, incorporated by reference to Exhibit 10(h) of the 1989 10-K; Amendment thereto dated as of June 27, 1990, incorporated by reference to Exhibit 10(h) of the 1990 10-K; Amendment thereto dated as of July 21, 1991, incorporated by reference to Exhibit 10(bb) of the 1991 10-K; Amendment thereto dated as of December 3, 1992, incorporated by reference to Exhibit 10(m) of the 1992 10-K; and Amendments thereto dated April 10, 1998 and October 1, 1998, incorporated by reference to Exhibit 10(b) of the 1998 10-K.* | |
| (c) | Bank of America Pension Restoration Plan, as amended and restated effective January 1, 2009, incorporated by reference to Exhibit 10(c) of registrant's 2008 10-K, and Amendment thereto dated December 18, 2009, filed herewith.* | |
| (d) | NationsBank Corporation Benefit Security Trust dated as of June 27, 1990, incorporated by reference to Exhibit 10(t) of the 1990 10-K; First Supplement thereto dated as of November 30, 1992, incorporated by reference to Exhibit 10(v) of the 1992 10-K; and Trustee Removal/Appointment Agreement dated as of December 19, 1995, incorporated by reference to Exhibit 10(o) of registrant's 1995 Annual Report on Form 10-K (File No. 1-6523).* | |
| (e) | Bank of America 401(k) Restoration Plan, as amended and restated effective January 1, 2009, incorporated by reference to Exhibit 10(a) of registrant's Quarterly Report on Form 10-Q (File No. 1-6523) for the quarter ended September 30, 2009, and Amendment thereto dated December 18, 2009, filed herewith.* | |
| (f) | Bank of America Executive Incentive Compensation Plan, as amended and restated effective December 10, 2002, incorporated by reference to Exhibit 10(g) of the 2002 10-K.* | |
| (g) | Bank of America Director Deferral Plan, as amended and restated effective January 1, 2005, incorporated by reference to Exhibit 10(g) of the registrant's 2006 10-K.* | |
| (h) | Bank of America Corporation Directors' Stock Plan as amended and restated effective April 26, 2006, incorporated by reference to Exhibit 10.2 to the registrant's Current Report on Form 8-K filed December 14, 2005; form of Restricted Stock Award Agreement incorporated by reference to Exhibit 10(h) of registrant's 2004 Annual Report on Form 10-K (File No. 1-6523) (the "2004 10-K"); and Form of Directors Stock Plan Restricted Stock Award Agreement for Nonemployee Chairman, incorporated by reference to Exhibit 10(b) of registrant's Quarterly Report on Form 10-Q (File No. 1-6523) for the quarter ended September 30, 2009. | |
| (i) | Bank of America Corporation 2003 Key Associate Stock Plan, effective January 1, 2003, as amended and restated effective April 1, 2004, incorporated by reference to Exhibit 10(f) of registrant's Registration Statement on Form S-4 (File No. 333-110924); Amendment thereto dated March 13, 2006, form of Restricted Stock Units Award Agreement and form of Stock Option Award Agreement, incorporated by reference to Exhibit 10(i) of the registrant's 2007 Annual Report on Form 10-K (File No. 1-6523); Amendment thereto dated December 17, 2008, incorporated by reference to Appendix F of Part I to the document included in registrant's Registration Statement on Form S-4/A (Registration No. 333-153771); and 2008 form of Restricted Stock Units Award Agreement for non-executives and 2008 form of Stock Option Award Agreement for non-executives, filed herewith.* | |
| (j) | Split Dollar Life Insurance Agreement dated as of September 28, 1998 between registrant and J. Steele Alphin, as Trustee under that certain Irrevocable Trust Agreement dated June 23, 1998, by and between Kenneth D. Lewis, as Grantor, and J. Steele Alphin, as Trustee, incorporated by reference to Exhibit 10(ee) of the 1998 10-K; and Amendment thereto dated January 24, 2002, incorporated by reference to Exhibit 10(p) of the 2001 10-K.* | |
| (k) | Amendment to various plans in connection with FleetBoston Financial Corporation merger, incorporated by reference to Exhibit 10(v) of registrant's 2003 Annual Report on Form 10-K.* | |
| (l) | FleetBoston Supplemental Executive Retirement Plan, as amended by Amendment One thereto effective January 1, 1997, Amendment Two thereto effective October 15, 1997, Amendment Three thereto effective July 1, 1998, Amendment Four thereto effective August 15, 1999, Amendment Five thereto effective January 1, 2000, Amendment Six thereto effective October 10, 2001, Amendment Seven thereto effective February 19, 2002, Amendment Eight thereto effective October 15, 2002, Amendment Nine thereto effective January 1, 2003, Amendment Ten thereto effective October 21, 2003, and Amendment Eleven thereto effective December 31, 2004, incorporated by reference to Exhibit 10(r) of the 2004 10-K.* | |
| (m) | FleetBoston Amended and Restated 1992 Stock Option and Restricted Stock Plan, incorporated by reference to Exhibit 10(s) of the 2004 10-K.* | |
| (n) | FleetBoston Executive Deferred Compensation Plan No. 2, as amended by Amendment One thereto effective February 1, 1999, Amendment Two thereto effective January 1, 2000, Amendment Three thereto effective January 1, 2002, Amendment Four thereto effective October 15, 2002, Amendment Five thereto effective January 1, 2003, and Amendment Six thereto effective December 16, 2003, incorporated by reference to Exhibit 10(u) of the 2004 10-K.* | |
| (o) | FleetBoston Executive Supplemental Plan, as amended by Amendment One thereto effective January 1, 2000, Amendment Two thereto effective January 1, 2002, Amendment Three thereto effective January 1, 2003, Amendment Four thereto effective January 1, 2003, and Amendment Five thereto effective December 31, 2004, incorporated by reference to Exhibit 10(v) of the 2004 10-K.* | |
| (p) | Retirement Income Assurance Plan for Legacy Fleet, as amended and restated effective January 1, 2009, filed herewith.* |
| E-3 |
Exhibit No. | Description | |
| (q) | Trust Agreement for the FleetBoston Executive Deferred Compensation Plans No. 1 and 2, incorporated by reference to Exhibit 10(x) of the 2004 10-K.* | |
| (r) | Trust Agreement for the FleetBoston Executive Supplemental Plan, incorporated by reference to Exhibit 10(y) of the 2004 10-K.* | |
| (s) | Trust Agreement for the FleetBoston Retirement Income Assurance Plan and the FleetBoston Supplemental Executive Retirement Plan, incorporated by reference to Exhibit 10(z) of the 2004 10-K.* | |
| (t) | FleetBoston Directors Deferred Compensation and Stock Unit Plan, as amended by an amendment thereto effective as of July 1, 2000, a Second Amendment thereto effective as of January 1, 2003, a Third Amendment thereto dated April 14, 2003, and a Fourth Amendment thereto effective January 1, 2004, incorporated by reference to Exhibit 10(aa) of the 2004 10-K.* | |
| (u) | FleetBoston 1996 Long-Term Incentive Plan, incorporated by reference to Exhibit 10(bb) of the 2004 10-K.* | |
| (v) | BankBoston Corporation and its Subsidiaries Deferred Compensation Plan, as amended by a First Amendment thereto, a Second Amendment thereto, a Third Amendment thereto, an Instrument thereto (providing for the cessation of accruals effective December 31, 2000) and an Amendment thereto dated December 24, 2001, incorporated by reference to Exhibit 10(cc) of the 2004 10-K.* | |
| (w) | BankBoston, N.A. Bonus Supplemental Employee Retirement Plan, as amended by a First Amendment, a Second Amendment, a Third Amendment and a Fourth Amendment thereto, incorporated by reference to Exhibit 10(dd) of the 2004 10-K.* | |
| (x) | Description of BankBoston Supplemental Life Insurance Plan, incorporated by reference to Exhibit 10(ee) of the 2004 10-K.* | |
| (y) | BankBoston, N.A. Excess Benefit Supplemental Employee Retirement Plan, as amended by a First Amendment, a Second Amendment, a Third Amendment thereto (assumed by FleetBoston on October 1, 1999) and an Instrument thereto, incorporated by reference to Exhibit 10(ff) of the 2004 10-K.* | |
| (z) | Description of BankBoston Supplemental Long-Term Disability Plan, incorporated by reference to Exhibit 10(gg) of the 2004 10-K.* | |
| (aa) | BankBoston Director Stock Award Plan, incorporated by reference to Exhibit 10(hh) of the 2004 10-K.* | |
| (bb) | BankBoston Directors Deferred Compensation Plan, as amended by a First Amendment and a Second Amendment thereto, incorporated by reference to Exhibit 10(ii) of the 2004 10-K.* | |
| (cc) | BankBoston, N.A. Directors' Deferred Compensation Plan, as amended by a First Amendment and a Second Amendment thereto, incorporated by reference to Exhibit 10(jj) of the 2004 10-K.* | |
| (dd) | BankBoston 1997 Stock Option Plan for Non-Employee Directors, as amended by an amendment thereto dated as of October 16, 2001, incorporated by reference to Exhibit 10(kk) of the 2004 10-K.* | |
| (ee) | Description of BankBoston Director Retirement Benefits Exchange Program, incorporated by reference to Exhibit 10(ll) of the 2004 10-K.* | |
| (ff) | Employment Agreement, dated as of March 14, 1999, between FleetBoston and Charles K. Gifford, as amended by an amendment thereto effective as of February 7, 2000, a Second Amendment thereto effective as of April 22, 2002, and a Third Amendment thereto effective as of October 1, 2002, incorporated by reference to Exhibit 10(mm) of the 2004 10-K.* | |
| (gg) | Form of Change in Control Agreement entered into with Charles K. Gifford, incorporated by reference to Exhibit 10(nn) of the 2004 10-K.* | |
| (hh) | Global amendment to definition of "change in control" or "change of control," together with a list of plans affected by such amendment, incorporated by reference to Exhibit 10(oo) of the 2004 10-K.* | |
| (ii) | Retirement Agreement dated January 26, 2005 between Bank of America Corporation and Charles K. Gifford, incorporated by reference to Exhibit 10.1 to the registrant's Current Report on Form 8-K (File No. 1-6523) filed January 26, 2005.* | |
| (jj) | Amendment to various FleetBoston stock option awards, dated March 25, 2004, incorporated by reference to Exhibit 10(ss) of the 2004 10-K.* | |
| (kk) | MBNA Corporation Supplemental Executive Retirement Plan, as amended and restated effective January 1, 2005, incorporated by reference to Exhibit 10(kk) of the 2008 10-K.* | |
| (ll) | Supplemental Executive Insurance Plan, as amended and restated effective January 1, 2005, incorporated by reference to Exhibit 10(ll) of the 2008 10-K.* | |
| (mm) | MBNA Corporation Executive Deferred Compensation Plan, as amended and restated effective January 1, 2005, incorporated by reference to Exhibit 10(mm) of the 2008 10-K. | |
| (nn) | MBNA Corporation 1997 Long Term Incentive Plan, as amended effective April 24, 2000 and restated, as adjusted for July 2002 stock split and as further amended effective April 15, 2005 and restated, and Amendment thereto dated December 15, 2006, incorporated by reference to Exhibit 10(nn) of the 2008 10-K.* | |
| (oo) | Executive Non-Competition Agreement dated August 9, 1999 among Richard K. Struthers, MBNA Corporation and MBNA America Bank, N.A., incorporated by reference to Exhibit 10(pp) of the 2008 10-K.* | |
| (pp) | Agreement Regarding Participation in the MBNA Corporation Supplemental Executive Retirement Plan dated December 22, 2008 between Bank of America Corporation and Richard K. Struthers, incorporated by reference to Exhibit 10(qq) of the 2008 10-K.* | |
| (qq) | Merrill Lynch & Co., Inc. Employee Stock Compensation Plan, incorporated by reference to Exhibit 10(rr) of the 2008 10-K, and 2009 Restricted Stock Unit Award Agreement for Thomas K. Montag, filed herewith.* | |
| (rr) | Employment Agreement dated October 27, 2003 between Bank of America Corporation and Brian T. Moynihan, incorporated by reference to Exhibit 10(d) of registrant's Registration Statement on Form S-4 (Registration No. 333-110924).* | |
| (ss) | Cancellation Agreement dated October 26, 2005 between Bank of America Corporation and Brian T. Moynihan, incorporated by reference to Exhibit 10.1 of registrant's Current Report on Form 8-K (File No. 1-6523) filed October 26, 2005.* | |
| (tt) | Agreement Regarding Participation in the Fleet Boston Supplemental Executive Retirement Plan dated October 26, 2005 between Bank of America Corporation and Brian T. Moynihan, incorporated by reference to Exhibit 10.2 of registrant's Current Report on Form 8-K (File No. 1-6523) filed October 26, 2005.* |
| E-4 |
Exhibit No. | Description | |
| (uu) | Forms of Stock Unit Agreements for salary stock units awarded to certain executive officers in connection with registrant's participation in the U.S. Department of Treasury's Troubled Asset Relief Program, filed herewith.* | |
| (vv) | Boatmen's Supplemental Retirement Plan, effective as of August 8, 1989, filed herewith.* | |
| (ww) | Employment Agreement dated January 30, 1996 between Boatmen's Bancshares, Inc. and Gregory L. Curl, filed herewith.* | |
| (xx) | Employment Agreement dated September 26, 1996 between NationsBank Corporation and Gregory L. Curl, filed herewith.* | |
| (yy) | Employment Letter dated May 7, 2001 between Bank of America Corporation and Gregory L. Curl, filed herewith.* | |
| (zz) | Bank of America Corporation Equity Incentive Plan amended and restated effective as of January 1, 2008, filed herewith.* | |
| (aaa) | Merrill Lynch & Co., Inc. Long-Term Incentive Compensation Plan amended as of January 1, 2009 and 2008 Restricted Units/Stock Option Grant Document for Thomas K. Montag, filed herewith.* | |
| (bbb) | Employment Letter dated May 1, 2008 between Merrill Lynch & Co., Inc. and Thomas K. Montag and Summary of Agreement with respect to Post-Employment Medical Coverage, filed herewith.* | |
| (ccc) | Amendment to various plans as required to the extent necessary to comply with Section III of the Emergency Economic Stabilization Act of 2008 (EESA) and form of waiver for any changes to compensation or benefits required to comply with the EESA, all in connection with the registrant's October 26, 2008 participation in the U.S. Department of Treasury's Troubled Assets Relief Program, incorporated by reference to Exhibit 10(ss) of the 2008 10-K.* | |
| (ddd) | Further amendment to various plans and further form of waiver for any changes to compensation or benefits in connection with the registrant's January 15, 2009 participation in the U.S. Department of Treasury's Troubled Assets Relief Program, incorporated by reference to Exhibit 10(tt) of the 2008 10-K.* | |
| (eee) | Letter Agreement, dated October 26, 2008, between the registrant and U.S. Department of the Treasury, with respect to the issuance and sale of registrant's Fixed Rate Cumulative Perpetual Preferred Stock, Series N and a warrant to purchase common stock, incorporated by reference to Exhibit 10.1 of registrant's Current Report on Form 8-K (File No. 1-6523) filed October 30, 2008. | |
| (fff) | Letter Agreement, dated January 9, 2009, between the registrant and U.S. Department of the Treasury, with respect to the issuance and sale of registrant's Fixed Rate Cumulative Perpetual Preferred Stock, Series Q and a warrant to purchase common stock, incorporated by reference to Exhibit 10.1 of registrant's Current Report on Form 8-K (File No. 1-6523) filed January 13, 2009. | |
| (ggg) | Securities Purchase Agreement, dated January 15, 2009, between the registrant and U.S. Department of the Treasury, with respect to the issuance and sale of registrant's Fixed Rate Cumulative Perpetual Preferred Stock, Series R and a warrant to purchase common stock, incorporated by reference to Exhibit 10.1 of registrant's Current Report on Form 8-K (File No. 1-6523) filed January 22, 2009. | |
| (hhh) | Summary of Terms, dated January 15, 2009, incorporated by reference to Exhibit 10.2 of registrant's Current Report on Form 8-K (File No. 1-6523) filed January 22, 2009. | |
| (iii) | Letter Agreement dated December 9, 2009 between the registrant and the U.S. Department of the Treasury, amending the Securities Purchase Agreement dated January 9, 2009, filed herewith. | |
| (jjj) | Letter Agreement dated December 9, 2009 between the registrant and the U.S. Department of the Treasury, amending the Securities Purchase Agreement dated January 15, 2009, filed herewith. | |
| 12 | Ratio of Earnings to Fixed Charges, filed herewith. | |
Ratio of Earnings to Fixed Charges and Preferred Dividends, filed herewith. | ||
| 21 | List of Subsidiaries, filed herewith. | |
| 23 | Consent of PricewaterhouseCoopers LLP, filed herewith. | |
| 24(a) | Power of Attorney, filed herewith. | |
| (b) | Corporate Resolution, filed herewith. | |
| 31(a) | Certification of the Chief Executive Officer pursuant to Section 302 of the Sarbanes-Oxley Act of 2002, filed herewith. | |
| (b) | Certification of the Interim Chief Financial Officer pursuant to Section 302 of the Sarbanes-Oxley Act of 2002, filed herewith. | |
| 32(a) | Certification of the Chief Executive Officer pursuant to 18 U.S.C. Section 1350, as adopted pursuant to Section 906 of the Sarbanes-Oxley Act of 2002, filed herewith. | |
| (b) | Certification of the Interim Chief Financial Officer pursuant to 18 U.S.C. Section 1350, as adopted pursuant to Section 906 of the Sarbanes-Oxley Act of 2002, filed herewith. | |
| Exhibit 101.INS | XBRL Instance Document | |
| Exhibit 101.SCH | XBRL Taxonomy Extension Schema Document | |
| Exhibit 101.CAL | XBRL Taxonomy Extension Calculation Linkbase Document | |
| Exhibit 101.LAB | XBRL Taxonomy Extension Label Linkbase Document | |
| Exhibit 101.PRE | XBRL Taxonomy Extension Presentation Linkbase Document | |
| Exhibit 101.DEF | XBRL Taxonomy Extension Definitions Linkbase Document |
| * | Exhibit is a management contract or a compensatory plan or arrangement. |
| E-5 |