
UNITED STATES
SECURITIES AND EXCHANGE COMMISSION
Washington, D.C. 20549
FORM 10-K
(Mark One)
| x | ANNUAL REPORT PURSUANT TO SECTION 13 OR 15(d) OF THE SECURITIES EXCHANGE ACT OF 1934 |
For the fiscal year ended December 31, 2010
or
| ¨ | TRANSITION REPORT PURSUANT TO SECTION 13 OR 15(d) OF THE SECURITIES EXCHANGE ACT OF 1934 |
For the transition period from to
Commission file number 1-442
THE BOEING COMPANY
(Exact name of registrant as specified in its charter)
Delaware | 91-0425694 | |||
State or other jurisdiction of incorporation or organization | (I.R.S. Employer Identification No.) | |||
100 N. Riverside Plaza, Chicago, IL | 60606-1596 | |||
| (Address of principal executive offices) | (Zip Code) | |||
Registrant's telephone number, including area code (312) 544-2000
Securities registered pursuant to Section 12(b) of the Act:
Common Stock, $5 par value | New York Stock Exchange | |||
| (Title of each class) | (Name of each exchange on which registered) |
Securities registered pursuant to Section 12(g) of the Act: None
Indicate by check mark if the registrant is a well-known seasoned issuer, as defined in Rule 405 of the Securities Act. Yes x No ¨
Indicate by check mark if the registrant is not required to file reports pursuant to Section 13 or Section 15(d) of the Act. Yes ¨ No x
Indicate by check mark whether the registrant (1) has filed all reports required to be filed by Section 13 or 15(d) of the Securities Exchange Act of 1934 during the preceding 12 months (or for such shorter period that the registrant was required to file such reports), and (2) has been subject to such filing requirements for the past 90 days. Yes x No ¨
Indicate by check mark whether the registrant has submitted electronically and posted on its corporate Web site, if any, every Interactive Data File required to be submitted and posted pursuant to Rule 405 of Regulation S-T (§ 232.405 of this chapter) during the preceding 12 months (or for such shorter period that the registrant was required to submit and post such files). Yes x No ¨
Indicate by check mark if disclosure of delinquent filers pursuant to Item 405 of Regulation S-K (§ 229.405 of this chapter) is not contained herein, and will not be contained, to the best of registrant's knowledge, in definitive proxy or information statements incorporated by reference in Part III of this Form 10-K or any amendment to this Form 10-K. ¨
Indicate by check mark whether the registrant is a large accelerated filer, accelerated filer, a non-accelerated filer, or a smaller reporting company. See the definitions of "large accelerated filer," "accelerated filer" and "smaller reporting company" in Rule 12b-2 of the Exchange Act.
Large accelerated filer x | Accelerated filer ¨ | |
Non-accelerated filer ¨ (Do not check if a smaller reporting company) | Smaller reporting company ¨ |
Indicate by check mark whether the registrant is a shell company (as defined in Rule 12b-2 of the Exchange Act). Yes ¨ No x
As of June 30, 2010, there were 731,190,389 common shares outstanding held by nonaffiliates of the registrant, and the aggregate market value of the common shares (based upon the closing price of these shares on the New York Stock Exchange) was approximately $45.9 billion.
The number of shares of the registrant's common stock outstanding as of February 1, 2011 was 736,295,504.
DOCUMENTS INCORPORATED BY REFERENCE
Part III incorporates information by reference to the registrant's definitive proxy statement, to be filed with the Securities and Exchange Commission within 120 days after the close of the fiscal year ended December 31, 2010.
THE BOEING COMPANY
Index to the Form 10-K
For the Fiscal Year Ended December 31, 2010
| PART I | Page | |||||||
Item 1. | Business | 1 | ||||||
Item 1A. | Risk Factors | 6 | ||||||
Item 1B. | Unresolved Staff Comments | 14 | ||||||
Item 2. | Properties | 14 | ||||||
Item 3. | Legal Proceedings | 15 | ||||||
Item 4. | Removed and Reserved | 15 | ||||||
PART II | ||||||||
Item 5. | Market for Registrant's Common Equity, Related Stockholder Matters and Issuer Purchases of Equity Securities | 16 | ||||||
Item 6. | Selected Financial Data | 17 | ||||||
Item 7. | Management's Discussion and Analysis of Financial Condition and Results of Operations | 18 | ||||||
Item 7A. | Quantitative and Qualitative Disclosures About Market Risk | 48 | ||||||
Item 8. | Financial Statements and Supplementary Data | 49 | ||||||
Item 9. | Changes in and Disagreements With Accountants on Accounting and Financial Disclosure | 111 | ||||||
Item 9A. | Controls and Procedures | 111 | ||||||
Item 9B. | Other Information | 111 | ||||||
PART III | ||||||||
Item 10. | Directors, Executive Officers and Corporate Governance | 112 | ||||||
Item 11. | Executive Compensation | 114 | ||||||
Item 12. | Security Ownership of Certain Beneficial Owners and Management and Related Stockholder Matters | 115 | ||||||
Item 13. | Certain Relationships and Related Transactions, and Director Independence | 115 | ||||||
Item 14. | Principal Accounting Fees and Services | 115 | ||||||
PART IV | ||||||||
Item 15. | Exhibits, Financial Statement Schedules | 116 | ||||||
Signatures | 120 | |||||||
Schedule II – Valuation and Qualifying Accounts | 121 | |||||||
Exhibit (12) – Computation of Ratio of Earnings to Fixed Charges | 122 | |||||||
Exhibit (21) – List of Company Subsidiaries | 123 | |||||||
Exhibit (23) – Consent of Independent Registered Public Accounting Firm | 128 | |||||||
Exhibit (31)(i) – CEO Section 302 Certification | 129 | |||||||
Exhibit (31)(ii) – CFO Section 302 Certification | 130 | |||||||
Exhibit (32)(i) – CEO Section 906 Certification | 131 | |||||||
Exhibit (32)(ii) – CFO Section 906 Certification | 132 | |||||||
Item 1. Business
The Boeing Company, together with its subsidiaries (herein referred to as "Boeing," the "Company," "we," "us," "our"), is one of the world's major aerospace firms.
We are organized based on the products and services we offer. We operate in five principal segments:
| · | Commercial Airplanes; |
| · | Our Boeing Defense, Space & Security (BDS) business comprises three segments: |
| · | Boeing Military Aircraft (BMA), |
| · | Network & Space Systems (N&SS) and |
| · | Global Services & Support (GS&S); and |
| · | Boeing Capital Corporation (BCC). |
Our Other segment includes the unallocated activities of Engineering, Operations & Technology (EO&T) and Shared Services Group (SSG), as well as intercompany guarantees provided to BCC. EO&T provides Boeing with technical and functional capabilities, including information technology, research and development, test and evaluation, technology strategy development, environmental remediation management and intellectual property management.
Commercial Airplanes Segment
The Commercial Airplanes segment develops, produces and markets commercial jet aircraft and provides related support services, principally to the commercial airline industry worldwide. We are a leading producer of commercial aircraft and offer a family of commercial jetliners designed to meet a broad spectrum of passenger and cargo requirements of domestic and non-U.S. airlines. This family of commercial jet aircraft in production includes the 737 narrow-body model and the 767 and 777 wide-body models. The 747-8 and 787 wide-body models are currently under development. The Commercial Airplanes segment also offers aviation services support, aircraft modifications, spares, training, maintenance documents and technical advice to commercial and government customers worldwide.
Boeing Defense, Space & Security
Our BDS operations principally involve research, development, production, modification and support of the following products and related systems: global strike systems, including fighters, bombers, combat rotorcraft systems, weapons and unmanned systems; global mobility systems, including transport and tanker aircraft, rotorcraft transport and tilt-rotor systems; airborne surveillance and reconnaissance aircraft, including command and control, battle management and airborne anti-submarine aircraft; network and tactical systems, including information and battle management systems; intelligence and security systems; missile defense systems; space and intelligence systems, including satellites and commercial satellite launching vehicles; and space exploration. BDS is committed to providing affordable, best-of-industry solutions and brings value to customers through its ability to solve the most complex problems utilizing expertise in large-scale systems integration, knowledge of legacy platforms and development of common network-enabled solutions across all customers' domains. BDS' primary customer is the United States Department of Defense (U.S. DoD) with 82% of BDS 2010 revenues being derived from this customer. Other significant revenues were derived from the National Aeronautics and Space Administration (NASA) and international defense markets, civil markets and commercial satellite markets. BDS consists of three capabilities-driven businesses: BMA, N&SS and GS&S. Additionally, the Phantom Works group is an integrated team that works with the three businesses via product development, rapid prototyping and customer engagement through experimentation and enterprise technology investment strategies.
1
Boeing Military Aircraft Segment
This segment is engaged in the research, development, production and modification of manned and unmanned military weapons systems for the global strike, mobility and surveillance and engagement markets as well as related services. Included in this segment are the A160 Hummingbird, AH-64 Apache, Airborne Early Warning and Control (AEW&C), CH-47 Chinook, C-17 Globemaster, EA-18G Growler Airborne Attack Electronic Aircraft, F/A-18E/F Super Hornet, F-15 Strike Eagle, F-22 Raptor, Harpoon, KC-767 International Tanker, Joint Direct Attack Munition, P-8A Poseidon, P8-I, ScanEagle, Small Diameter Bomb and V-22 Osprey.
Network & Space Systems Segment
This segment is engaged in the research, development, production and modification of products and services to assist our customers in transforming their operations through network integration, information, intelligence and surveillance systems, communications, architectures and space exploration. Included in this segment are the Airborne Laser, Family of Advanced Beyond Line-of-Sight Terminals (FAB-T), Brigade Combat Team Modernization (BCTM), Future Rapid Effects System, Global Positioning System, Ground-based Midcourse Defense (GMD), International Space Station, Joint Tactical Radio System (JTRS), Satellite Systems, Cyber and Security Programs, Space Payloads and Space Shuttle.
Global Services & Support Segment
This segment is engaged in the operations, maintenance, training, upgrades and logistics support functions for military platforms and operations. Included in this segment are the following activities: Integrated Logistics on platforms including AH-64, AV-8B, C-17, CH-47, F-15, F/A-18, F-22, GMD, KC-767 International Tanker and V-22; Maintenance, Modifications and Upgrades on platforms including A-10, B-1, B-52, C-32, C-40, C-130, E-4B, E-6, KC-10, KC-135, T-38 and VC-25; Training Systems and Services on platforms including AH-64, C-17, F-15, F-16, F/A-18 and T-45; and Defense and Government Services including the UK Future Logistics Information Services program.
Boeing Capital Corporation Segment
In the commercial aircraft market, BCC facilitates, arranges, structures and provides selective financing solutions for our Commercial Airplanes customers. In the space and defense markets, BCC primarily arranges and structures financing solutions for our BDS government customers. BCC's portfolio consists of equipment under operating leases, finance leases, notes and other receivables, assets held for sale or re-lease and investments.
Financial and Other Business Information
See page 55 for the Summary of Business Segment Data and Note 21 to our Consolidated Financial Statements for financial information, including revenues and earnings from operations, for each of our business segments.
Intellectual Property
We own numerous patents and have licenses for the use of patents owned by others, which relate to our products and their manufacture. In addition to owning a large portfolio of intellectual property, we also license intellectual property to and from third parties. For example, the U.S. government has licenses in our patents that are developed in performance of government contracts, and it may use or authorize others to use the inventions covered by such patents for government purposes. Unpatented
2
research, development and engineering skills, as well as certain trademarks and other intellectual property rights, also make an important contribution to our business. While our intellectual property rights in the aggregate are important to the operation of each of our businesses, we do not believe that our business would be materially affected by the expiration of any particular intellectual property right or termination of any particular intellectual property patent license agreement.
Non-U.S. Revenues
See Note 21 to our Consolidated Financial Statements for information regarding non-U.S. revenues.
Research and Development
Research and development expenditures involve experimentation, design, development and related test activities for defense systems, new and derivative jet aircraft including both commercial and military, advanced space and other company-sponsored product development. These are expensed as incurred including amounts allocable as reimbursable overhead costs on U.S. government contracts.
Our total research and development expense amounted to $4.1 billion, $6.5 billion and $3.8 billion in 2010, 2009 and 2008, respectively. The 2008 amount is net of 787-related research and development cost sharing payments from suppliers of $50 million. Research and development expense in 2009 included $2.7 billion of production costs related to the first three flight test 787 aircraft that cannot be sold due to the inordinate amount of rework and unique and extensive modifications that would be made to the aircraft.
Research and development costs also include bid and proposal efforts related to government products and services, as well as costs incurred in excess of amounts estimated to be recoverable under cost-sharing research and development agreements. Bid and proposal costs were $355 million, $343 million and $330 million in 2010, 2009 and 2008, respectively.
Research and development highlights for each of the major business segments are discussed in more detail in Segment Results of Operations and Financial Condition on pages 22 – 38.
Employees
Total workforce level at December 31, 2010 was 160,500.
As of December 31, 2010, our principal collective bargaining agreements were with the following unions:
| Union | Percent of our Employees Represented | Status of the Agreements with the Union | ||
| The International Association of Machinists and Aerospace Workers (IAM) | 19% | We have two major agreements; one expiring in September of 2012 and one in January of 2015. | ||
| The Society of Professional Engineering Employees in Aerospace (SPEEA) | 13% | We have two major agreements expiring in October of 2012. | ||
| The United Automobile, Aerospace and Agricultural Implement Workers of America (UAW) | 2% | We have two major agreements; one expiring in October of 2014 and one in February of 2015. | ||
3
Competition
The commercial jet aircraft market and the airline industry remain extremely competitive. We face aggressive international competitors who are intent on increasing their market share, such as Airbus, Embraer and Bombardier, and other entrants from Russia, China and Japan. We are focused on improving our processes and continuing cost reduction efforts. We intend to continue to compete with other airplane manufacturers by providing customers with greater value products, services, and support. We continue to leverage our extensive customer support services network which includes aviation support, spares, training, maintenance documents and technical advice for airlines throughout the world to provide a higher level of customer satisfaction and productivity.
BDS faces strong competition in all market segments, primarily from Lockheed Martin Corporation, Northrop Grumman Corporation, Raytheon Company and General Dynamics Corporation. Non-U.S. companies such as BAE Systems and European Aeronautic Defence and Space Company (EADS), the parent of Airbus, continue to build a strategic presence in the U.S. market by strengthening their North American operations and partnering with U.S. defense companies. In addition, certain of our competitors have occasionally formed teams with other competitors to address specific customer requirements. BDS expects the trend of strong competition to continue into 2011 with many international firms pursuing announced intentions of increasing their U.S. presence.
Regulatory Matters
Our businesses are heavily regulated in most of our markets. We deal with numerous U.S. government agencies and entities, including but not limited to all of the branches of the U.S. military, NASA and the Department of Homeland Security. Similar government authorities exist in our international markets.
U.S. Government Contracts. The U.S. government, and other governments, may terminate any of our government contracts at their convenience, as well as for default, based on our failure to meet specified performance measurements. If any of our government contracts were to be terminated for convenience, we generally would be entitled to receive payment for work completed and allowable termination or cancellation costs. If any of our government contracts were to be terminated for default, generally the U.S. government would pay only for the work that has been accepted and can require us to pay the difference between the original contract price and the cost to re-procure the contract items, net of the work accepted from the original contract. The U.S. government can also hold us liable for damages resulting from the default.
Commercial Aircraft. In the United States, our commercial aircraft products are required to comply with Federal Aviation Administration regulations governing production and quality systems, airworthiness and installation approvals, repair procedures and continuing operational safety. Internationally, similar requirements exist for airworthiness, installation and operational approvals. These requirements are generally administered by the national aviation authorities of each country and, in the case of Europe, coordinated by the European Joint Aviation Authorities.
Environmental. We are subject to various federal, state, local and non-U.S. laws and regulations relating to environmental protection, including the discharge, treatment, storage, disposal and remediation of hazardous substances and wastes. We continually assess our compliance status and management of environmental matters to ensure our operations are in substantial compliance with all applicable environmental laws and regulations. Operating and maintenance costs associated with environmental compliance and management of sites are a normal, recurring part of our operations. These costs often are allowable costs under our contracts with the U.S. government. It is reasonably possible that continued environmental compliance could have a material impact on our results of operations, financial condition or cash flows if more stringent clean-up standards are imposed, additional contamination is discovered and/or clean-up costs are higher than estimated.
4
A Potentially Responsible Party (PRP) has joint and several liability under existing U.S. environmental laws. Where we have been designated a PRP by the Environmental Protection Agency or a state environmental agency, we are potentially liable to the government or third parties for the full cost of remediating contamination at our facilities or former facilities or at third-party sites. If we were required to fully fund the remediation of a site, the statutory framework would allow us to pursue rights to contribution from other PRPs. For additional information relating to environmental contingencies, see Note 11 to our Consolidated Financial Statements.
International. Our international sales are subject to U.S. and non-U.S. governmental regulations and procurement policies and practices, including regulations relating to import-export control, investment, exchange controls and repatriation of earnings. International sales are also subject to varying currency, political and economic risks.
Raw Materials
We are highly dependent on the availability of essential materials, parts and subassemblies from our suppliers and subcontractors. The most important raw materials required for our aerospace products are aluminum (sheet, plate, forgings and extrusions), titanium (sheet, plate, forgings and extrusions) and composites (including carbon and boron). Although alternative sources generally exist for these raw materials, qualification of the sources could take one year or more. Many major components and product equipment items are procured or subcontracted on a sole-source basis with a number of companies.
Suppliers
We are dependent upon the ability of a large number of suppliers and subcontractors to meet performance specifications, quality standards and delivery schedules at anticipated costs. While we maintain an extensive qualification and performance surveillance system to control risk associated with such reliance on third parties, failure of suppliers or subcontractors to meet commitments could adversely affect production schedules and program/contract profitability, thereby jeopardizing our ability to fulfill commitments to our customers. We are also dependent on the availability of energy sources, such as electricity, at affordable prices. A number of our suppliers have made assertions for higher prices or other contractual compensation relief which could affect program/contract profitability.
Seasonality
No material portion of our business is considered to be seasonal.
Other Information
Boeing was originally incorporated in the State of Washington in 1916 and reincorporated in Delaware in 1934. Our principal executive offices are located at 100 N. Riverside Plaza, Chicago, Illinois 60606 and our telephone number is (312) 544-2000.
General information about us can be found at www.boeing.com. The information contained on or connected to our web site is not incorporated by reference into this Annual Report on Form 10-K and should not be considered part of this or any other report filed with the Securities and Exchange Commission (SEC). Our Annual Report on Form 10-K, Quarterly Reports on Form 10-Q and Current Reports on Form 8-K, as well as any amendments to those reports, are available free of charge through our web site as soon as reasonably practicable after we file them with, or furnish them to, the SEC. These reports may also be obtained at the SEC's public reference room at 100 F Street, N.E., Washington, DC 20549. The SEC also maintains a web site at www.sec.gov that contains reports, proxy statements and other information regarding SEC registrants, including Boeing.
5
Forward-Looking Statements
This report, as well as our Annual Report to Shareholders, quarterly reports, and other filings we make with the SEC, press releases and other written and oral communications, contains "forward-looking statements" within the meaning of the Private Securities Litigation Reform Act of 1995. Words such as "may," "will," "should," "expects," "intends," "projects," "believes," "estimates," "targets," "anticipates" and similar expressions are used to identify these forward-looking statements. Forward-looking statements include any statement that does not directly relate to any historical or current fact.
Forward-looking statements are based on our current expectations and assumptions, which may not prove to be accurate. These statements are not guarantees and are subject to risks, uncertainties and changes in circumstances that are difficult to predict. Many factors, including those set forth in the "Risk Factors" section below, could cause actual results to differ materially and adversely from these forward-looking statements. Any forward-looking statement speaks only as of the date on which it is made, and we assume no obligation to publicly update any forward-looking statement, except as required by law.
Item 1A. Risk Factors
An investment in our common stock or debt securities involves risks and uncertainties and our actual results and future trends may differ materially from our past or projected future performance. We urge investors to consider carefully the risk factors described below in evaluating the information contained in this report.
Our commercial aircraft business depends heavily on commercial airlines and our suppliers, and is subject to unique risks.
Our ability to deliver aircraft on time depends on a variety of factors, which are subject to unique risks. Our ability to deliver aircraft on schedule is dependent upon a variety of factors, including execution of internal performance plans, availability of raw materials (such as aluminum, titanium and composites) and internally and supplier produced parts and structures, conversion of raw materials into parts and assemblies, performance of suppliers and subcontractors and regulatory certification. The failure of any or all of these factors could result in significant out-of-sequence work and disrupted process flows adversely affecting production schedules and program/contract profitability, the latter through increased costs as well as possible customer and/or supplier claims or assertions. In addition, the introduction of new commercial aircraft programs and major derivative aircraft involves increased risk associated with meeting development, production and certification schedules.
Market conditions have a significant impact on our ability to sell aircraft into the future. The worldwide market for commercial jet aircraft is predominantly driven by long-term trends in airline passenger and cargo traffic. The principal factors underlying long-term traffic growth are sustained economic growth and political stability, both in developed and emerging countries. Demand for our commercial aircraft is further influenced by airline industry profitability, world trade policies, availability of financing, government-to-government relations, terrorism, disease outbreaks, environmental constraints imposed upon aircraft operations, technological changes and price and other competitive factors.
Our commercial aircraft customers may request to cancel, modify or reschedule orders. We generally make sales under aircraft purchase agreements that may, for a variety of reasons, become the subject of cancellation, modification or rescheduling. Changes in the economic environment and the financial condition of the airline industry and our customers could result in customer requests to reschedule or cancel contractual orders. Our contracts have specific provisions relating to schedule and performance and failure to deliver airplanes in accordance with such provisions could result in cancellations and/or claims for compensation. Any such cancellations, modification, rescheduling or claims could significantly reduce our backlog, revenues, profitability and cash flows.
6
Commercial aircraft pricing is based in part on escalation formulas established well in advance of delivery and is therefore subject to factors beyond our control. Price escalation provisions in our sales contracts are designed to adjust for economic fluctuations between the contract date and aircraft delivery, a period which can span many years. As a result, aircraft pricing generally consists of a fixed amount as modified by a price escalation formula using pre-defined factors. Our revenue estimates are based on current expectations with respect to these escalation formulas. Changes in escalation amounts can significantly impact revenues and operating margins in our Commercial Airplanes business.
We derive a significant portion of our revenues from a limited number of major commercial airlines. We can make no assurance that any customer will purchase additional products or services from us after our contract with the customer ends. In addition, fleet decisions, consolidation or financial challenges involving any of our major commercial airline customers could significantly reduce our revenues and limit our opportunity to generate profits from those customers.
Our commercial aircraft production rates could change. Production rate reductions could cause us to incur disruption and other costs and result in infrastructure costs being allocated to a smaller quantity of airplanes, all of which could reduce our profitability. The introduction of a new aircraft program and/or higher orders for our aircraft could lead to production rate increases in order to meet the delivery schedules. Failure to successfully implement any production rate changes could lead to extended delivery commitments, and depending on the length of delay in meeting delivery commitments, additional costs and customers rescheduling their deliveries or terminating their related contract with us.
The profitability of our commercial aircraft development programs depends upon a variety of factors, which are subject to unique risks.
We are currently engaged in the demanding flight testing and certification phases of program development on both the 787-8 and 747-8 Freighter aircraft. These airplanes have highly complex designs, utilize exotic materials and require extensive coordination and integration with supplier partners. As a result, our ability to deliver aircraft on time, meet contractual performance requirements and achieve program profitability is subject to significant risks.
Operational issues, including delays or defects in supplier components, the inability to efficiently and cost-effectively incorporate design changes into production aircraft, and aircraft performance issues, could result in additional expenses or lower program revenues. For example, in 2009 we determined that three of the six 787 flight test aircraft could not be sold due to the inordinate amount of work that would be required to prepare the aircraft for sale. As a result, we reclassified $2.7 billion from inventory to research and development expense. If we determine that one or more of the other flight test aircraft will not be sold, we may incur additional charges. In addition, flight testing and certification delays or supplier or other operational challenges that impact our ability to achieve our targeted production rates may result in aircraft delivery delays and higher costs to complete. For example, on January 18, 2011, we announced that the expected date of first delivery of our 787 Dreamliner had been moved to the third quarter of 2011 due to a combination of flight testing delays, supplier challenges and other issues common to commercial aircraft development programs. Our inability to deliver aircraft to our customers in a timely manner could result in order cancellations or other significant financial exposures, or could otherwise reduce the profitability of our Commercial Airplanes business. We continue to work with our customers and suppliers to assess the specific impact of schedule changes and otherwise to ensure that our aircraft meet customer expectations.
Looking beyond entry into service for the 787-8 and 747-8 Freighter, we continue to work toward improving production efficiencies and supplier performance, incorporating design changes into aircraft
7
that have already been produced, improving aircraft performance, successfully implementing planned increases in production rates and introducing the 787-9 and 747-8 Intercontinental airplanes. For example, we are increasing production capacity in Everett and Charleston and working closely with our suppliers to support 787 production rate increases. If assembly line ramp-up efforts are delayed or if our suppliers cannot timely deliver components to us at the rates necessary to achieve our planned rate increases, we may be unable to meet delivery targets and the financial performance of one or more of our programs may suffer.
Management uses its best judgment to estimate the cost to perform the work, the price we will eventually be paid and the number of units to include in the initial accounting quantity. Changes to estimates of the program accounting quantity, customer and model mix, production costs and rates, learning curve, costs of derivative aircraft, customer negotiations/settlements, supplier claims and certification issues could affect margins or result in reach-forward losses. The cumulative impact of production challenges, schedule delays and customer and supplier impacts has resulted in a reach-forward loss on the 747 program and continues to place significant pressure on revenues, costs and the profitability of the 787 program.
Our BDS business could be adversely affected by changing acquisition priorities of the U.S. government, particularly the Department of Defense, including an increased emphasis on affordability.
The U.S. government participates in an increasingly wide variety of operations, including homeland defense, natural disasters, stabilization efforts, counterinsurgency and counterterrorism, that employ our products and services. The U.S. government, primarily operating through the U.S. DoD, continues to adjust its funding priorities in response to this changing threat environment. In addition, defense funding currently faces pressures due to the overall economic environment and competing budget priorities. Due to these pressures, we expect the total U.S. DoD budget growth rate to remain stable or even decline slightly over the next several years. Any reduction in the growth rate or overall levels of U.S. DoD spending or cancellations or delays impacting existing contracts could have a significant impact on the operating results of our BDS business. We also expect that the U.S. DoD will continue to emphasize cost-cutting and other efficiency initiatives in its procurement processes. These initiatives will require us and our competitors to focus increasingly on long-term cost competitiveness and affordability when responding to proposals and/or pursuing development programs. If the priorities of the U.S. government change and/or we are unable to meet affordability targets, our BDS revenues and profitability could be negatively impacted.
We depend heavily on U.S. government contracts, which are subject to unique risks.
In 2010, 43% of our revenues were derived from U.S. government contracts. In addition to normal business risks, our contracts with the U.S. government are subject to unique risks, some of which are beyond our control.
The funding of U.S. government programs is subject to congressional appropriations . Many of the U.S. government programs in which we participate may last several years; however, these programs are normally funded annually. Changes in military strategy and priorities may affect our future procurement opportunities and existing programs. Long-term government contracts and related orders are subject to cancellation, delay or restructure, if appropriations for subsequent performance periods are not made. The termination or reduction of funding for existing or new U.S. government programs could result in a material adverse effect on our earnings, cash flow and financial position.
The U.S. government may modify, curtail or terminate our contracts. The U.S. government may modify, curtail or terminate its contracts and subcontracts with us, without prior notice and at its convenience
8
upon payment for work done and commitments made at the time of termination. Modification, curtailment or termination of one or more of our major programs or contracts could have a material adverse effect on our results of operations and financial condition.
Our contract costs are subject to audits by U.S. government agencies . U.S. government representatives may audit the costs we incur on our U.S. government contracts, including allocated indirect costs. Such audits could result in adjustments to our contract costs. Any costs found to be improperly allocated to a specific contract will not be reimbursed, and such costs already reimbursed must be refunded. We have recorded contract revenues based upon costs we expect to realize upon final audit. However, we do not know the outcome of any future audits and adjustments and we may be required to reduce our revenues or profits upon completion and final negotiation of audits. If any audit uncovers improper or illegal activities, we may be subject to civil and criminal penalties and administrative sanctions, including termination of contracts, forfeiture of profits, suspension of payments, fines and suspension or prohibition from doing business with the U.S. government.
Our business is subject to potential U.S. government inquiries and investigations. We are sometimes subject to certain U.S. government inquiries and investigations due to our participation in government contracts. Any such inquiry or investigation could potentially result in a material adverse effect on our results of operations and financial condition.
Our U.S. government business is also subject to specific procurement regulations and other requirements. These requirements, although customary in U.S. government contracts, increase our performance and compliance costs. These costs might increase in the future, reducing our margins, which could have a negative effect on our financial condition. Failure to comply with these regulations and requirements could lead to suspension or debarment, or withholding of revenue and profit, for cause, from U.S. government contracting or subcontracting for a period of time and could have a negative effect on our reputation and ability to secure future U.S. government contracts.
We enter into fixed-price contracts which could subject us to losses if we have cost overruns.
Approximately 55% of BDS revenues are generated from fixed-price contracts. While firm fixed price contracts enable us to benefit from performance improvements, cost reductions and efficiencies, they also subject us to the risk of reduced margins or incurring losses if we are unable to achieve estimated costs and revenues. If our estimated costs exceed our estimated price, we recognize reach-forward losses which can significantly affect our reported results. The long term nature of many of our contracts makes the process of estimating costs and revenues on fixed-price contracts inherently risky. Fixed-price contracts often contain price incentives and penalties tied to performance which can be difficult to estimate and have significant impacts on margins. In addition, some of our contracts have specific provisions relating to cost, schedule and performance.
Fixed-price development contracts are generally subject to more uncertainty than fixed-price production contracts. Many of these development programs have highly complex designs. If we fail to meet the terms specified in those contracts, our sales price could be reduced. As technical or quality issues arise, we may experience schedule delays and higher costs to complete, which would adversely affect our financial condition. Examples of significant BDS fixed-price development contracts include AEW&C, KC-767 International Tanker, P-8I and commercial and military satellites.
We enter into cost-type contracts which also carry risks.
Approximately 45% of BDS revenues are generated from cost-type contracting arrangements. Some of these are development programs that have complex design and technical challenges. These cost-type programs typically have award or incentive fees that are subject to uncertainty and may be earned over
9
extended periods. In these cases the associated financial risks are primarily in lower profit rates or program cancellation if cost, schedule or technical performance issues arise. Programs whose contracts are primarily cost-type include GMD, BCTM, P-8A Poseidon, Proprietary programs, JTRS, FAB-T and the EA-18G Growler.
We enter into contracts that include in-orbit incentive payments that subject us to risks.
Contracts in the commercial satellite industry and certain government satellite contracts include in-orbit incentive payments. These in-orbit payments may be paid over time after final satellite acceptance or paid in full prior to final satellite acceptance. In both cases, the in-orbit incentive payment is at risk if the satellite does not perform to specifications for up to 15 years after acceptance. The net present value of in-orbit incentive fees we ultimately expect to realize is recognized as revenue in the construction period. If the satellite fails to meet contractual performance criteria, customers will not be obligated to continue making in-orbit payments and/or we may be required to provide refunds to the customer and incur significant charges.
We use estimates in accounting for many contracts and programs. Changes in our estimates could adversely affect our future financial results.
Contract and program accounting require judgment relative to assessing risks, estimating revenues and costs and making assumptions for schedule and technical issues. Due to the size and nature of many of our contracts and programs, the estimation of total revenues and cost at completion is complicated and subject to many variables. Assumptions have to be made regarding the length of time to complete the contract or program because costs also include expected increases in wages, material prices and allocated fixed costs. Incentives or penalties related to performance on contracts are considered in estimating sales and profit rates, and are recorded when there is sufficient information for us to assess anticipated performance. Suppliers' assertions are also assessed and considered in estimating costs and profit rates. Estimates of award fees are also used in sales and profit rates based on actual and anticipated awards.
Under program accounting, inventoriable production costs (including overhead), program tooling costs and routine warranty costs are accumulated and charged as cost of sales by program instead of by individual units or contracts. A program consists of the estimated number of units (accounting quantity) of a product to be produced in a continuing, long-term production effort for delivery under existing and anticipated contracts limited by the ability to make reasonably dependable estimates. To establish the relationship of sales to cost of sales, program accounting requires estimates of (a) the number of units to be produced and sold in a program, (b) the period over which the units can reasonably be expected to be produced and (c) the units' expected sales prices, production costs, program tooling and routine warranty costs for the total program. Several factors determine accounting quantity, including firm orders, letters of intent from prospective customers and market studies. Such estimates are reconsidered throughout the life of our programs. Changes in underlying assumptions, supplier performance, circumstances or estimates concerning the selection of the accounting quantity or changes in market conditions, along with a failure to realize predicted costs, may adversely affect future financial performance.
Because of the significance of the judgments and estimation processes described above, it is likely that materially different sales and profit amounts could be recorded if we used different assumptions or if the underlying circumstances were to change. Changes in underlying assumptions, circumstances or estimates may adversely affect future period financial performance. For additional information on our accounting policies for recognizing sales and profits, see our discussion under "Management's Discussion and Analysis-Critical Accounting Policies-Contract Accounting/Program Accounting" on pages 42 - 44 and Note 1 to our Consolidated Financial Statements on pages 56 - 57 of this Form 10-K.
10
Competition within our markets may reduce our future contracts and sales.
The markets in which we operate are highly competitive and one or more of our competitors may have more extensive or more specialized engineering, manufacturing and marketing capabilities than we do in some areas. In our Commercial Airplanes business, we anticipate increasing competition among non-U.S. aircraft manufacturers and service providers in one or more of our market segments. In our BDS business, we anticipate that the effects of defense industry consolidation and new priorities, including long-term cost competitiveness, of our U.S. DoD customer will intensify competition for many of our products and services. Furthermore, we are facing increased international competition and cross-border consolidation of competition. There can be no assurance that we will be able to compete successfully against our current or future competitors or that the competitive pressures we face will not result in reduced revenues and market share.
We derive a significant portion of our revenues from non-U.S. sales and are subject to the risks of doing business in other countries.
In 2010, sales to non-U.S. customers accounted for 41% of our revenues. We expect that non-U.S. sales will continue to account for a significant portion of our revenues for the foreseeable future. As a result, we are subject to risks of doing business internationally, including:
| · | changes in regulatory requirements; |
| · | domestic and international government policies, including requirements to expend a portion of program funds locally and governmental industrial cooperation or participation requirements; |
| · | fluctuations in international currency exchange rates; |
| · | volatility in international political and economic environments and changes in non-U.S. national priorities and budgets, which can lead to delays or fluctuations in orders; |
| · | the complexity and necessity of using non-U.S. representatives and consultants; |
| · | the uncertainty of the ability of non-U.S. customers to finance purchases; |
| · | uncertainties and restrictions concerning the availability of funding credit or guarantees; |
| · | imposition of taxes, export controls, tariffs, embargoes and other trade restrictions; |
| · | the difficulty of management and operation of an enterprise spread over various countries; |
| · | compliance with a variety of international laws, as well as U.S. laws affecting the activities of U.S. companies abroad; and |
| · | economic and geopolitical developments and conditions. |
While the impact of these factors is difficult to predict, any one or more of these factors could adversely affect our operations in the future.
The outcome of litigation and of government inquiries and investigations involving our business is unpredictable and an adverse decision in any such matter could result in significant monetary payments and have a material adverse affect on our financial position and results of operations.
We are involved in a number of litigation matters. These claims may divert financial and management resources that would otherwise be used to benefit our operations. No assurances can be given that the results of these matters will be favorable to us. An adverse resolution of any of these lawsuits could have a material adverse affect on our financial position and results of operations. In addition, we are sometimes subject to government inquiries and investigations of our business due, among other
11
things, to our business relationships with the U.S government, the heavily regulated nature of our industry, and in the case of environmental proceedings, our ownership of certain property. Any such inquiry or investigation could potentially result in an adverse ruling against us, which could result in significant monetary payments (including possible environmental remediation costs) and a material adverse effect on our financial position and operating results.
A significant portion of our and Boeing Capital Corporation's customer financing portfolio is concentrated among certain customers based in the United States, and in certain types of Boeing aircraft, which exposes us to concentration risks.
A significant portion of our customer financing portfolio is concentrated among certain customers and in distinct geographic regions, particularly in the United States. Our portfolio is also concentrated by varying degrees across Boeing aircraft product types, most notably Boeing 717 aircraft. If one or more customers holding a significant portion of our portfolio assets experiences financial difficulties, or otherwise defaults on or does not renew its leases with us at their expiration, and we are unable to redeploy the aircraft on reasonable terms, or if the types of aircraft that are concentrated in our portfolio suffer greater than expected declines in value, our earnings, cash flows and/or financial position could be materially adversely affected.
We may be unable to obtain debt to fund our operations and contractual commitments at competitive rates, on commercially reasonable terms or in sufficient amounts.
We depend, in part, upon the issuance of debt to fund our operations and contractual commitments. If we were called upon to fund all outstanding financing commitments, our market liquidity may not be sufficient. A number of factors could cause us to incur increased borrowing costs and to have greater difficulty accessing public and private markets for debt. These factors include disruptions or declines in the global capital markets and/or a decline in our financial performance or outlook or credit ratings. The occurrence of any or all of these events may adversely affect our ability to fund our operations and contractual or financing commitments.
We may not realize the anticipated benefits of mergers, acquisitions, joint ventures/strategic alliances or divestitures.
As part of our business strategy, we may merge with or acquire businesses, form joint ventures/strategic alliances and divest operations. Whether we realize the anticipated benefits from these transactions depends, in part, upon the integration between the businesses involved, the performance of the underlying products, capabilities or technologies and the management of the transacted operations. Accordingly, our financial results could be adversely affected from unanticipated performance issues, transaction-related charges, amortization of expenses related to intangibles, charges for impairment of long-term assets, credit guarantees, partner performance and indemnifications. Consolidations of joint ventures could also impact our results of operations or financial position. While we believe that we have established appropriate and adequate procedures and processes to mitigate these risks, there is no assurance that these transactions will be successful. Divestitures may result in continued financial involvement in the divested businesses, such as through guarantees or other financial arrangements, following the transaction. Nonperformance by those divested businesses could affect our future financial results.
Our insurance coverage may be inadequate to cover all significant risk exposures.
We are exposed to liabilities that are unique to the products and services we provide. While we maintain insurance for certain risks and, in some circumstances, we may receive indemnification from the U.S. government, insurance cannot be obtained to protect against all risks and liabilities. It is
12
therefore possible that the amount of our insurance coverage may not cover all claims or liabilities, and we may be forced to bear substantial costs. For example, liabilities arising from the use of certain of our products, such as aircraft technologies, missile systems, border security systems, and/or air traffic management systems may not be insurable on commercially reasonable terms. While many of these products are shielded from liability within the U.S. under the SAFETY Act provisions of the 2002 Homeland Security Act, no such protection is available outside the U.S., potentially resulting in significant liabilities. The amount of insurance coverage we are able to maintain may be inadequate to cover these or other claims or liabilities.
Business disruptions could seriously affect our future sales and financial condition or increase our costs and expenses.
Our business may be impacted by disruptions including threats to physical security, information technology attacks or failures, damaging weather or other acts of nature and pandemics or other public health crises. Any of these disruptions could affect our internal operations or services provided to customers, and could impact our sales, increase our expenses or adversely affect our reputation or our stock price.
Some of our and our suppliers' workforces are represented by labor unions, which may lead to work stoppages.
Approximately 57,400 employees, which constitute 36% of our total workforce, are union represented as of December 31, 2010. We experienced a work stoppage in 2008 when a labor strike halted commercial aircraft and certain BMA program production and we may experience additional work stoppages in the future, which could adversely affect our business. We cannot predict how stable our relationships, currently with 14 different U.S. labor organizations and 7 different non-U.S. labor organizations, will be or whether we will be able to meet the unions' requirements without impacting our financial condition. The unions may also limit our flexibility in dealing with our workforce. Union actions at suppliers can also affect us. Work stoppages and instability in our union relationships could delay the production and/or development of our products, which could strain relationships with customers and cause a loss of revenues which would adversely affect our operations.
Significant changes in discount rates, actual investment return on pension assets and other factors could affect our earnings, equity, and pension contributions in future periods.
Our earnings may be positively or negatively impacted by the amount of income or expense we record for our pension and other postretirement benefit plans. Generally Accepted Accounting Principles in the United States of America (GAAP) require that we calculate income or expense for the plans using actuarial valuations. These valuations reflect assumptions relating to financial market and other economic conditions. Changes in key economic indicators can change the assumptions. The most significant year-end assumptions used to estimate pension or other postretirement income or expense for the following year are the discount rate, the expected long-term rate of return on plan assets and expected future medical inflation. In addition, we are required to make an annual measurement of plan assets and liabilities, which may result in a significant change to Shareholders' equity. For a discussion regarding how our financial statements can be affected by pension and other postretirement plan accounting policies, see "Management's Discussion and Analysis-Critical Accounting Policies-Postretirement Plans" on pages 46–47 of this Form 10-K. Although GAAP expense and pension or other postretirement contributions are not directly related, the key economic factors that affect GAAP expense would also likely affect the amount of cash or common stock we would contribute to the pension or other postretirement plans. Potential pension contributions include both mandatory amounts required under federal law Employee Retirement Income Security Act (ERISA) and discretionary contributions to improve the plans' funded status.
13
Our operations expose us to the risk of material environmental liabilities.
We are subject to various federal, state, local and non-U.S. laws and regulations related to environmental protection, including the discharge, treatment, storage, disposal and remediation of hazardous substances and wastes. We could incur substantial costs, including cleanup costs, fines and civil or criminal sanctions, as well as third-party claims for property damage or personal injury, if we were to violate or become liable under environmental laws or regulations. In some cases, we may be subject to such costs due to environmental impacts attributable to our current or past manufacturing operations or the operations of companies we have acquired. In other cases, we may become subject to such costs due to an indemnification agreement between us and a third party relating to such environmental liabilities. In addition, new laws and regulations, more stringent enforcement of existing laws and regulations, the discovery of previously unknown contamination or the imposition of new remediation requirements could result in additional costs. For additional information relating to environmental contingencies, see Note 11 to our Consolidated Financial Statements.
Item 1B. Unresolved Staff Comments
Not Applicable.
Item 2. Properties
We occupied approximately 85 million square feet of floor space on December 31, 2010 for manufacturing, warehousing, engineering, administration and other productive uses, of which approximately 96% was located in the United States.
The following table provides a summary of the floor space by business as of December 31, 2010:
| (Square feet in thousands) | Owned | Leased | Government Owned* | Total | ||||||||||||
Commercial Airplanes | 35,460 | 4,955 | 40,415 | |||||||||||||
Boeing Defense, Space & Security | 30,158 | 9,275 | 159 | 39,592 | ||||||||||||
Other** | 3,957 | 740 | 4,697 | |||||||||||||
Total | 69,575 | 14,970 | 159 | 84,704 | ||||||||||||
| * | Excludes rent-free space furnished by U.S. government landlord of 772 square feet. |
| ** | Other includes BCC; EO&T; SSG; and our Corporate Headquarters. |
At December 31, 2010, our segments occupied facilities at the following major locations that occupied in excess of 74 million square feet of floor space:
| · | Commercial Airplanes – Greater Seattle, WA; North Charleston, SC |
| · | Boeing Defense, Space & Security – Greater Los Angeles, CA; Greater Seattle, WA; Greater St. Louis, MO; Philadelphia, PA; San Antonio, TX; Huntsville, AL; Mesa, AZ; Wichita, KS; Houston, TX; and Greater Washington, DC |
| · | Other – Chicago, IL and Greater Seattle, WA |
Most runways and taxiways that we use are located on airport properties owned by others and are used jointly with others. Our rights to use such facilities are provided for under long-term leases with municipal, county or other government authorities. In addition, the U.S. government furnishes us certain office space, installations and equipment at U.S. government bases for use in connection with various contract activities.
14
We believe that our major properties are adequate for our present needs and, as supplemented by planned improvements and construction, expect them to remain adequate for the foreseeable future.
Item 3. Legal Proceedings
Currently, we are involved in a number of legal proceedings. For a discussion of contingencies related to legal proceedings, see Note 20 to our Consolidated Financial Statements, which is hereby incorporated by reference.
Item 4. Removed and Reserved
15
PART II
Item 5. Market for Registrant's Common Equity, Related Stockholder Matters and Issuer Purchases of Equity Securities
The principal market for our common stock is the New York Stock Exchange where it trades under the symbol BA. The number of holders of common stock as of February 1, 2011, was approximately 212,290. Additional information required by this item is incorporated by reference from Note 22 to our Consolidated Financial Statements.
Issuer Purchases of Equity Securities
The following table provides information about purchases we made during the quarter ended December 31, 2010 of equity securities that are registered by us pursuant to Section 12 of the Exchange Act:
(Dollars in millions, except per share data)
| (a) | (b) | (c) | (d) | |||||||||||||
| Total Number of Shares Purchased (1) | Average Price Paid per Share | Total Number of Shares Purchased as Part of Publicly Announced Plans or Programs | Approximate Dollar Value of Shares That May Yet be Purchased Under the Plans or Programs (2) | |||||||||||||
10/1/2010 thru 10/31/2010 | 29,776 | $ | 67.35 | $ | 3,610 | |||||||||||
11/1/2010 thru 11/30/2010 | 5,666 | 70.12 | 3,610 | |||||||||||||
12/1/2010 thru 12/31/2010 | 16,894 | 69.08 | 3,610 | |||||||||||||
Total | 52,336 | $ | 68.21 | |||||||||||||
| (1) | We purchased an aggregate of 52,061 shares transferred to us from employees in satisfaction of minimum tax withholding obligations associated with the vesting of restricted stock during the period. In addition, we purchased an aggregate of 275 shares in swap transactions. |
| (2) | On October 29, 2007, the Board approved the repurchase of up to $7 billion of common stock (the Program). Unless terminated earlier by a Board resolution, the Program will expire when we have used all authorized funds for repurchase. |
16
Item 6. Selected Financial Data
Five-Year Summary (Unaudited)
| (Dollars in millions, except per share data) | 2010 | 2009 | 2008 | 2007 | 2006 | |||||||||||||||
Operations | ||||||||||||||||||||
Revenues: | ||||||||||||||||||||
Commercial Airplanes | $ | 31,834 | $ | 34,051 | $ | 28,263 | $ | 33,386 | $ | 28,465 | ||||||||||
Boeing Defense, Space & Security: (1) | ||||||||||||||||||||
Boeing Military Aircraft | 14,238 | 14,304 | 13,445 | 13,545 | 14,014 | |||||||||||||||
Network & Space Systems | 9,455 | 10,877 | 11,346 | 11,481 | 11,772 | |||||||||||||||
Global Services & Support | 8,250 | 8,480 | 7,256 | 7,026 | 6,625 | |||||||||||||||
Total Boeing Defense, Space & Security | 31,943 | 33,661 | 32,047 | 32,052 | 32,411 | |||||||||||||||
Boeing Capital Corporation | 639 | 660 | 703 | 815 | 1,025 | |||||||||||||||
Other segment | 138 | 165 | 567 | 308 | 327 | |||||||||||||||
Unallocated items and eliminations | (248 | ) | (256 | ) | (671 | ) | (174 | ) | (698 | ) | ||||||||||
Total revenues | $ | 64,306 | $ | 68,281 | $ | 60,909 | $ | 66,387 | $ | 61,530 | ||||||||||
General and administrative expense | 3,644 | 3,364 | 3,084 | 3,531 | 4,171 | |||||||||||||||
Research and development expense | 4,121 | 6,506 | 3,768 | 3,850 | 3,257 | |||||||||||||||
Other income/(loss), net | 52 | (26 | ) | 247 | 484 | 420 | ||||||||||||||
Net earnings from continuing operations | $ | 3,311 | $ | 1,335 | $ | 2,654 | $ | 4,058 | $ | 2,206 | ||||||||||
Net (loss)/gain on disposal of discontinued operations, net of tax | (4 | ) | (23 | ) | 18 | 16 | 9 | |||||||||||||
Net earnings | $ | 3,307 | $ | 1,312 | $ | 2,672 | $ | 4,074 | $ | 2,215 | ||||||||||
Basic earnings per share from continuing operations | 4.50 | 1.89 | 3.68 | 5.36 | 2.88 | |||||||||||||||
Diluted earnings per share from continuing operations | 4.46 | 1.87 | 3.65 | 5.26 | 2.84 | |||||||||||||||
Cash dividends declared | $ | 1,245 | $ | 1,233 | $ | 1,187 | $ | 1,129 | $ | 991 | ||||||||||
Per share | 1.68 | 1.68 | 1.62 | 1.45 | 1.25 | |||||||||||||||
Additions to Property, plant and equipment | 1,125 | 1,186 | 1,674 | 1,731 | 1,681 | |||||||||||||||
Depreciation of Property, plant and equipment | 1,096 | 1,066 | 1,013 | 978 | 1,058 | |||||||||||||||
Employee salaries and wages | 15,709 | 15,424 | 15,559 | 14,852 | 15,871 | |||||||||||||||
Year-end workforce | 160,500 | 157,100 | 162,200 | 159,300 | 154,000 | |||||||||||||||
Financial position at December 31 | ||||||||||||||||||||
Total assets | $ | 68,565 | $ | 62,053 | $ | 53,779 | $ | 58,986 | $ | 51,794 | ||||||||||
Working capital | 5,177 | 2,392 | (4,809 | ) | (4,184 | ) | (6,665 | ) | ||||||||||||
Property, plant and equipment, net | 8,931 | 8,784 | 8,762 | 8,265 | 7,675 | |||||||||||||||
Cash and cash equivalents | 5,359 | 9,215 | 3,268 | 7,042 | 6,118 | |||||||||||||||
Short-term and other investments | 5,158 | 2,008 | 11 | 2,266 | 268 | |||||||||||||||
Total debt | 12,421 | 12,924 | 7,512 | 8,217 | 9,538 | |||||||||||||||
Customer financing assets | 4,680 | 5,834 | 6,282 | 7,105 | 8,890 | |||||||||||||||
Shareholders' equity (2) | 2,766 | 2,128 | (1,294 | ) | 9,004 | 4,739 | ||||||||||||||
Per share | 3.76 | 2.93 | (1.85 | ) | 12.22 | 6.25 | ||||||||||||||
Common shares outstanding (in millions) (3) | 735.3 | 726.3 | 698.1 | 736.7 | 757.8 | |||||||||||||||
Contractual Backlog: | ||||||||||||||||||||
Commercial Airplanes | $ | 255,591 | $ | 250,476 | $ | 278,575 | $ | 255,176 | $ | 174,276 | ||||||||||
Boeing Defense, Space & Security: (1) | ||||||||||||||||||||
Boeing Military Aircraft | 25,094 | 26,354 | 25,802 | 23,027 | 24,689 | |||||||||||||||
Network & Space Systems | 9,586 | 7,746 | 8,868 | 9,207 | 7,786 | |||||||||||||||
Global Services & Support | 13,684 | 11,924 | 10,615 | 9,554 | 9,812 | |||||||||||||||
Total Boeing Defense, Space & Security | 48,364 | 46,024 | 45,285 | 41,788 | 42,287 | |||||||||||||||
Total contractual backlog | $ | 303,955 | $ | 296,500 | $ | 323,860 | $ | 296,964 | $ | 216,563 | ||||||||||
Cash dividends have been paid on common stock every year since 1942.
| (1) | Effective January 1, 2010, certain programs were realigned between BDS segments. Prior years have been recast for segment realignments. |
| (2) | Shareholders' equity excludes noncontrolling interest. Prior year amounts have been adjusted to conform to this presentation. |
| (3) | Represents actual number of shares outstanding as of December 31 and excludes treasury shares and the outstanding shares held by the ShareValue Trust, which was terminated in July 2010. |
17
Item 7. Management's Discussion and Analysis of Financial Condition and Results of Operations
Consolidated Results of Operations and Financial Condition
Overview
We are a global market leader in design, development, manufacture, sale and support of commercial jetliners, military aircraft, satellites, missile defense, human space flight and launch systems and services. We are one of the two major manufacturers of 100+ seat airplanes for the worldwide commercial airline industry and one of the largest defense contractors in the U.S. While our principal operations are in the U.S., we conduct operations in many countries and rely extensively on a network of partners, key suppliers and subcontractors around the world.
Our strategy is centered on successful execution in healthy core businesses – Commercial Airplanes and Boeing Defense, Space & Security (BDS) – supplemented and supported by Boeing Capital Corporation (BCC). Taken together, these core businesses have historically generated substantial earnings and cash flow that permit us to invest in new products and services. We focus on producing the products and providing the services that the market demands and we price our products and services to provide a fair return for our shareholders while continuing to find new ways to improve efficiency and quality. Commercial Airplanes is committed to being the leader in commercial aviation by offering airplanes and services that deliver superior design, efficiency and value to customers around the world. BDS integrates its resources in defense, intelligence, communications, security and space to deliver capability-driven solutions to its customers at reduced costs. Our strategy is to leverage our core businesses to capture key next-generation programs while expanding our presence in adjacent and international markets, underscored by an intense focus on growth and productivity. Our strategy also benefits as the cyclicality of commercial and defense markets often offset. BCC delivers value by supporting our business units and managing overall financing exposure.
Consolidated Results of Operations
Revenues
(Dollars in millions)
| Years ended December 31, | 2010 | 2009 | 2008 | |||||||||
Commercial Airplanes | $ | 31,834 | $ | 34,051 | $ | 28,263 | ||||||
Boeing Defense, Space & Security | 31,943 | 33,661 | 32,047 | |||||||||
Boeing Capital Corporation | 639 | 660 | 703 | |||||||||
Other segment | 138 | 165 | 567 | |||||||||
Unallocated items and eliminations | (248 | ) | (256 | ) | (671 | ) | ||||||
Total | $ | 64,306 | $ | 68,281 | $ | 60,909 | ||||||
Revenues in 2010 decreased by $3,975 million or 6% compared with 2009. Commercial Airplanes revenues decreased by $2,217 million due to lower 777 deliveries primarily resulting from a production rate change from 7 to 5 per month beginning in June 2010 and no deliveries on the 747 program due to the transition from the 747-400 to the 747-8. These were partially offset by increases in commercial aviation services business. BDS revenues decreased by $1,718 million primarily due to lower revenues in the Network & Space Systems (N&SS) segment.
Revenues in 2009 increased by $7,372 million compared with 2008 due to higher revenues in Commercial Airplanes and BDS. Commercial Airplanes revenues increased by $5,788 million, primarily due to higher commercial airplane deliveries in 2009. Deliveries in 2008 were lower as a result of a
18
labor strike in 2008. Increases were partially offset by decreases in commercial aviation services and intercompany revenues. BDS revenues increased by $1,614 million, primarily due to higher revenues in Global Services & Support (GS&S) and Boeing Military Aircraft (BMA), partially offset by lower revenues in N&SS. BCC revenues decreased by $43 million during the year primarily due to a decrease in the customer financing portfolio. Other segment revenues decreased by $402 million partly due to higher revenues in 2008 from the sale of four C-17 aircraft held under operating lease. Lower Unallocated items and eliminations improved revenues by $415 million primarily due to lower P-8A Poseidon intercompany revenues recognized by Commercial Airplanes in 2009 compared with 2008.
Earnings From Operations
The following table summarizes our earnings/(loss) from operations:
(Dollars in millions)
| Years ended December 31, | 2010 | 2009 | 2008 | |||||||||
Commercial Airplanes | $ | 3,006 | $ | (583 | ) | $ | 1,186 | |||||
Boeing Defense, Space & Security | 2,875 | 3,299 | 3,232 | |||||||||
Boeing Capital Corporation | 152 | 126 | 162 | |||||||||
Other segment | (327 | ) | (152 | ) | (307 | ) | ||||||
Unallocated items and eliminations | (735 | ) | (594 | ) | (323 | ) | ||||||
Total | $ | 4,971 | $ | 2,096 | $ | 3,950 | ||||||
Operating earnings in 2010 increased by $2,875 million compared with 2009. Commercial Airplanes earnings increased by $3,589 million, primarily due to $2,693 million of costs related to the first three 787 flight test aircraft included in research and development expense in 2009 and the 2009 reach-forward losses on the 747 program of $1,352 million. BDS earnings decreased by $424 million compared with 2009 due to lower revenues and margins in the BMA segment and lower revenues in the N&SS segment. Other segment earnings decreased by $175 million primarily due to $119 million in intercompany guarantees related to aircraft impairment charges and reduced aircraft collateral values.
Operating earnings in 2009 decreased by $1,854 million compared with 2008. Commercial Airplanes earnings decreased by $1,769 million primarily due to $2,693 million of costs related to the first three 787 flight test aircraft included in research and development expense as a result of our determination in August 2009 that these aircraft could not be sold. The earnings decrease is also attributable to $1,352 million in reach-forward losses on the 747 program in 2009, compared with $667 million in 2008. Lower commercial aviation services and intercompany earnings also contributed to lower 2009 earnings. These decreases were partially offset by higher commercial airplane deliveries in 2009 compared with 2008. BDS earnings increased by $67 million compared with 2008 primarily due to higher earnings in the BMA segment partially offset by lower earnings in the N&SS segment. Other segment losses decreased by $155 million primarily due to recognition of pre-tax expense of $82 million in the prior year to increase the allowance for losses on customer financing receivables and lower environmental remediation charges compared with the prior year. Unallocated items and eliminations in 2009 reduced earnings by $271 million compared with 2008, which is further explained in the table below.
19
The most significant items included in Unallocated items and eliminations are shown in the following table:
| (Dollars in millions) | ||||||||||||
| Years ended December 31, | 2010 | 2009 | 2008 | |||||||||
Share-based plans | $ | (136 | ) | $ | (189 | ) | $ | (149 | ) | |||
Deferred compensation | (112 | ) | (158 | ) | 223 | |||||||
Pension | 54 | 110 | (208 | ) | ||||||||
Postretirement | (59 | ) | (93 | ) | (79 | ) | ||||||
Other unallocated items and eliminations | (482 | ) | (264 | ) | (110 | ) | ||||||
Total | $ | (735 | ) | $ | (594 | ) | $ | (323 | ) | |||
Share-based plans expense decreased in 2010 by $53 million primarily due to the expiration of the ShareValue trust at June 30, 2010.
Deferred compensation expense decreased by $46 million in 2010 and increased by $381 million in 2009. The year over year changes in deferred compensation expense are primarily driven by changes in our stock price and broad stock market conditions.
Other unallocated items and eliminations expense increased by $218 million in 2010 primarily due to timing of intercompany expense allocations and elimination of profit on intercompany items as well as a $55 million charitable contribution. The 2009 increase of $154 million was primarily due to timing of intercompany expense allocations, elimination of profit on intercompany items and a more favorable insurance adjustment.
Unallocated pension and other postretirement expense represents the difference between costs recognized under Generally Accepted Accounting Principles in the United States of America (GAAP) in the consolidated financial statements and federal cost accounting standards required to be utilized by our business segments for U.S. government contracting purposes. We recorded net periodic benefit cost related to pensions and other postretirement benefits of $1,864 million, $1,816 million and $1,132 million in 2010, 2009 and 2008, respectively. Not all net periodic benefit cost is recognized in earnings in the period incurred because it is allocated to production as product costs and a portion remains in inventory at the end of the reporting period. A portion of pension and other postretirement expense is recorded in the business segments and the remainder is included in unallocated pension and other postretirement expense. Earnings from operations included the following amounts allocated to business segments and Other unallocated items and eliminations.
| (Dollars in millions) | Pension | Other Postretirement Benefits | ||||||||||||||||||||||
| Years ended December 31, | 2010 | 2009 | 2008 | 2010 | 2009 | 2008 | ||||||||||||||||||
Allocated to business segments | $ | (1,155 | ) | $ | (989 | ) | $ | (488 | ) | $ | (421 | ) | $ | (522 | ) | $ | (428 | ) | ||||||
Other unallocated items and eliminations | 54 | 110 | (208 | ) | (59 | ) | (93 | ) | (79 | ) | ||||||||||||||
Total | $ | (1,101 | ) | $ | (879 | ) | $ | (696 | ) | $ | (480 | ) | $ | (615 | ) | $ | (507 | ) | ||||||
20
Other Earnings Items
(Dollars in millions)
| Years ended December 31, | 2010 | 2009 | 2008 | |||||||||
Earnings from operations | $ | 4,971 | $ | 2,096 | $ | 3,950 | ||||||
Other income/(expense), net | 52 | (26 | ) | 247 | ||||||||
Interest and debt expense | (516 | ) | (339 | ) | (202 | ) | ||||||
Earnings before income taxes | 4,507 | 1,731 | 3,995 | |||||||||
Income tax expense | (1,196 | ) | (396 | ) | (1,341 | ) | ||||||
Net earnings from continuing operations | $ | 3,311 | $ | 1,335 | $ | 2,654 | ||||||
Other income increased by $78 million in 2010 primarily due to investment income on higher cash and investment balances throughout 2010. The decrease in 2009 of $273 million was driven by lower investment income due to both lower interest rates and investment balances. Interest and debt expense increased by $177 million and $137 million in 2010 and 2009 due to debt issued in 2009.
Our effective income tax rate was 26.5%, 22.9% and 33.6% for the years ended December 31, 2010, 2009 and 2008, respectively. Our effective tax rate was higher in 2010, compared with 2009, primarily because pre-tax book income in 2010 was higher than in 2009 and because of an income tax charge of $150 million recorded during the first quarter of 2010 as a result of the Patient Protection and Affordable Care Act, as modified by the Health Care and Education Reconciliation Act of 2010. This was partially offset by a tax benefit of $371 million recorded during the fourth quarter of 2010 as a result of settling the 1998-2003 federal audit. Our effective tax rate was lower in 2009, compared with 2008, primarily because tax credits, such as research and development credits, represented a higher proportion of earnings before taxes due to the year-over-year reduction in earnings. For additional discussion related to Income Taxes, see Note 5 to our Consolidated Financial Statements.
Backlog
Our backlog at December 31 was as follows:
| (Dollars in millions) | 2010 | 2009 | 2008 | |||||||||
Contractual Backlog: | ||||||||||||
Commercial Airplanes | $ | 255,591 | $ | 250,476 | $ | 278,575 | ||||||
Boeing Defense, Space & Security: | ||||||||||||
Boeing Military Aircraft | 25,094 | 26,354 | 25,802 | |||||||||
Network & Space Systems | 9,586 | 7,746 | 8,868 | |||||||||
Global Services & Support | 13,684 | 11,924 | 10,615 | |||||||||
Total Boeing Defense, Space & Security | 48,364 | 46,024 | 45,285 | |||||||||
Total contractual backlog | $ | 303,955 | $ | 296,500 | $ | 323,860 | ||||||
Unobligated backlog | $ | 16,871 | $ | 19,058 | $ | 28,066 | ||||||
Contractual backlog of unfilled orders excludes purchase options, announced orders for which definitive contracts have not been executed, and unobligated U.S. and non-U.S. government contract funding. The increase in contractual backlog during 2010 was due to orders in excess of deliveries and changes in projected revenue escalation, partially reduced by cancellations of orders. The decrease in backlog during 2009 was due to deliveries in excess of orders, changes in projected revenue escalation and cancellations of orders.
21
Unobligated backlog includes U.S. and non-U.S. government definitive contracts for which funding has not been authorized. The decrease in unobligated backlog during 2010 is due to decreases at BDS of $1,993 million compared with 2009 primarily due to funding of existing multi-year contracts including the V-22, Brigade Combat Team Modernization (BCTM) and Chinook programs, partially offset by multi-year procurement contract awards on the F/A-18 and International Space Station programs. The decrease in unobligated backlog during 2009 is primarily due to decreases at BDS of $8,904 million compared with 2008 partly due to a partial termination for convenience by the U.S. Army of the BCTM System Development and Demonstration contract relating to Manned Ground Vehicles and associated systems and equipment. Approved funding of existing multi-year contracts including the BCTM, V-22, Chinook, Proprietary and GMD programs also reduced unobligated backlog.
Segment Results of Operations and Financial Condition
Commercial Airplanes
Business Environment and Trends
Airline Industry Environment Global passenger traffic exceeded initial expectations in 2010 growing an estimated 8% for the year and showing growth over prior 2008 peak levels. Significant variation existed between regions and airline business models with emerging markets and low cost carriers leading recovery and growth into 2011. Air cargo traffic also rebounded in 2010 after two years of contraction. Led by strong growth in Asian exports, air cargo traffic recovered to peak 2007 levels and is poised to resume growth in 2011.
Airlines cut capacity in 2009 to match the demand environment which allowed them to boost yields as demand recovered in 2010. Airlines have also pursued new revenue sources by expanding alliances and building ancillary revenue streams. In addition, airlines continued to focus on cutting costs and pursued consolidation opportunities, particularly in mature markets, to improve market positioning. These airline tactics, combined with improving demand and relatively stable fuel prices, have driven a strong turnaround in airline industry profitability. Airlines are forecast to earn $15 billion in 2010 following a $10 billion net loss in 2009. The 2011 outlook is for continued profitability which should allow airlines to rebuild balance sheets that suffered from fuel price spikes and recession in 2008-2009.
The long-term outlook for the industry remains positive due to the fundamental drivers of air travel growth: economic growth and the increasing propensity to travel due to increased trade, globalization and improved airline services driven by liberalization of air traffic rights between countries. Our 20-year forecast is for a long-term average growth rate of 5% per year for passenger and cargo traffic based on a projected average annual worldwide real economic growth rate of 3%. Based on long-term global economic growth projections, and factoring in increased utilization of the worldwide airplane fleet and requirements to replace older airplanes, we project a $3.6 trillion market for 30,900 new airplanes over the next 20 years.
The industry remains vulnerable to near-term exogenous developments including fuel price spikes, disease outbreaks (such as avian or H1N1 flu), terrorism, conflicts and increased global environmental regulations.
Industry Competitiveness The commercial jet aircraft market and the airline industry remain extremely competitive. We expect the existing long-term downward trend in passenger revenue yields worldwide (measured in real terms) to continue into the foreseeable future. Market liberalization in Europe and Asia has enabled low-cost airlines to continue gaining market share. These airlines have increased the downward pressure on airfares. This results in continued cost pressures for all airlines and price pressure on our products. Major productivity gains are essential to ensure a favorable market position at acceptable profit margins.
22
Continued access to global markets remains vital to our ability to fully realize our sales potential and long-term investment returns. Approximately 10% of Commercial Airplanes' contractual backlog in dollar terms is with U.S. airlines.
We face aggressive international competitors who are intent on increasing their market share. They offer competitive products and have access to most of the same customers and suppliers. Airbus has historically invested heavily to create a family of products to compete with ours. Regional jet makers Embraer and Bombardier, coming from the less than 100-seat commercial jet market, continue to develop larger and more capable airplanes. Additionally, other competitors from Russia, China and Japan are likely to enter the 70 to 190 seat aircraft market over the next few years. Many of these competitors have historically enjoyed access to government-provided support, including "launch aid," which greatly reduces the commercial risks associated with airplane development activities and enables planes to be brought to market more quickly than otherwise possible. This market environment has resulted in intense pressures on pricing and other competitive factors and we expect these pressures to continue or intensify in the coming years.
Worldwide, airplane sales are generally conducted in U.S. dollars. Fluctuating exchange rates affect the profit potential of our major competitors, all of whom have significant costs in other currencies. Changes in value of the U.S. dollar relative to their local currencies as experienced in 2010 impacted competitors' revenues and profits. Competitors routinely respond to relatively weaker dollars by aggressively reducing costs and increasing productivity, thereby improving their longer-term competitive posture. Airbus has announced such initiatives targeting overhead cost savings, a reduction in its development cycle and a significant increase in overall productivity through 2012. If the U.S. dollar strengthens again, Airbus can use the improved efficiency to fund product development, gain market share through pricing and/or improve earnings.
We are focused on improving our processes and continuing cost-reduction efforts. We continue to leverage our extensive customer support services network which includes aviation support, spares, training, maintenance documents and technical advice for airlines throughout the world. This enables us to provide a high level of customer satisfaction and productivity. These efforts enhance our ability to pursue pricing strategies that enable us to price competitively.
Operating Results
(Dollars in millions)
| Years ended December 31, | 2010 | 2009 | 2008 | |||||||||
Revenues | $ | 31,834 | $ | 34,051 | $ | 28,263 | ||||||
% of Total company revenues | 50 | % | 50 | % | 46 | % | ||||||
Earnings/(loss) from operations | $ | 3,006 | $ | (583 | ) | $ | 1,186 | |||||
Operating margins | 9.4 | % | -1.7 | % | 4.2 | % | ||||||
Research and development | $ | 2,975 | $ | 5,383 | $ | 2,838 | ||||||
Contractual backlog | $ | 255,591 | $ | 250,476 | $ | 278,575 | ||||||
23
Revenues
Year-over-year changes in Revenue are shown in the following table:
| (Dollars in millions) | 2010 vs. 2009 | 2009 vs. 2008 | ||||||
New airplane sales | $ | (2,733 | ) | $ | 6,129 | |||
Commercial aviation services business | 569 | (308 | ) | |||||
Other | (53 | ) | (33 | ) | ||||
Total | $ | (2,217 | ) | $ | 5,788 | |||
Revenues for 2010 decreased by $2,217 million or 6.5% compared with 2009. The decrease in new airplane revenues primarily reflects lower 777 deliveries resulting from a production rate change from 7 to 5 per month beginning in June 2010 and no deliveries on the 747 program due to the transition from the 747-400 to the 747-8 derivative. The increase in revenues from commercial aviation services business was primarily due to increased sales of spares.
The increase in revenue of $5,788 million in 2009 from 2008 was primarily attributable to higher new airplane deliveries partially offset by lower intercompany revenues. 2008 revenues were negatively impacted by a 2008 IAM strike. The decrease in revenues from commercial aviation services business was driven by economic conditions.
Commercial jet aircraft deliveries as of December 31 were as follows:
| 737 | 747 | 767 | 777 | Total | ||||||||||||||||
2010 | ||||||||||||||||||||
Cumulative Deliveries | 3,504 | 1,418 | 994 | 910 | ||||||||||||||||
Deliveries | 376 | (1) | 12 | 74 | 462 | |||||||||||||||
2009 | ||||||||||||||||||||
Cumulative Deliveries | 3,128 | 1,418 | 982 | 836 | ||||||||||||||||
Deliveries | 372 | (1) | 8 | 13 | 88 | 481 | ||||||||||||||
2008 | ||||||||||||||||||||
Cumulative Deliveries | 2,756 | 1,410 | 969 | 748 | ||||||||||||||||
Deliveries | 290 | (1) | 14 | 10 | (1) | 61 | 375 | |||||||||||||
| (1) | Includes intercompany deliveries of 5 737 aircraft in 2010, 5 737 aircraft in 2009 and 2 767 aircraft and 2 737 aircraft in 2008. |
Earnings From Operations
Earnings from operations for 2010 increased by $3,589 million compared with 2009. The increase was primarily due to the 2009 reclassification from inventory to research and development expense of costs related to the first three 787 flight test aircraft, and the 2009 reach-forward losses on the 747 program. Costs of $2,693 million included in research and development expense in 2009 for the first three flight test 787 airplanes were a result of our determination that these aircraft could not be sold. The reach-forward loss on the 747 program of $1,352 million during 2009 was primarily due to increased production costs, reductions in projected delivery price increases associated with escalation and the difficult market conditions affecting the 747-8. The remaining net decrease in earnings for 2010 was primarily attributable to increased research and development expense of $285 million and lower new airplane deliveries.
24
Earnings from operations for 2009 decreased by $1,769 million compared with 2008, primarily due to the reclassification from inventory to research and development expense of the three 787 flight test aircraft previously recorded as inventory, partially offset by a $148 million decrease in other research and development expense. The decrease in earnings is also attributable to $1,352 million in reach-forward losses on the 747 program in 2009, compared with $685 million in 2008. Lower commercial aviation services revenues and margins reduced earnings by $245 million. Higher infrastructure cost allocations related to the 787 and 747-8 schedule delays announced in 2008 and 2009 and infrastructure costs incurred during the 2008 IAM strike reduced earnings by $199 million. Increased period and other costs reduced earnings by $47 million. These decreases were partially offset by increased earnings of $1,934 million related to new airplane deliveries.
Backlog Firm backlog represents orders for products and services where no contingencies remain before Boeing and the customer are required to perform. Backlog does not include prospective orders where customer controlled contingencies remain, such as the customers receiving approval from their Board of Directors, shareholders or government and completing financing arrangements. All such contingencies must be satisfied or have expired prior to recording a new firm order even if satisfying such conditions is highly certain. Firm orders exclude options. A number of our customers may have contractual remedies that may be implicated by program delays. We continue to address customer claims and requests for other contractual relief as they arise. However, once orders are included in firm backlog, orders remain in backlog until canceled or fulfilled, although the value of orders is adjusted as changes to price and schedule are agreed to with customers.
The increase in contractual backlog during 2010 was due to orders in excess of deliveries and changes in projected revenue escalation, partially reduced by cancellations of orders. The decrease in backlog during 2009 was due to deliveries in excess of orders, changes in projected revenue escalation and cancellations of orders.
Accounting Quantity The accounting quantity is our estimate of the quantity of airplanes that will be produced for delivery under existing and anticipated contracts. The determination of the accounting quantity is limited by the ability to make reasonably dependable estimates of the revenue and cost of existing and anticipated contracts. It is a key determinant of the gross margins we recognize on sales of individual airplanes throughout a program's life. Estimation of each program's accounting quantity takes into account several factors that are indicative of the demand for that program, including firm orders, letters of intent from prospective customers and market studies. We review our program accounting quantities quarterly.
Commercial aircraft production costs include a significant amount of infrastructure costs, a portion of which does not vary with production rates. As the amount of time needed to produce the accounting quantity increases, the average cost of the accounting quantity also increases as these infrastructure costs are included in the total cost estimates. This has the effect of decreasing the gross margin and related earnings provided other factors do not change.
The accounting quantity for each program may include units that have been delivered, undelivered units under contract, and units anticipated to be under contract in the reasonable future (anticipated orders). In developing total program estimates, all of these items within the accounting quantity must be considered.
25
The table below provides details of the accounting quantities and firm orders by program as of December 31. Cumulative firm orders represent the cumulative number of commercial jet aircraft deliveries plus undelivered firm orders.
| Program | ||||||||||||||||||||
| 737 | 747 | 767 | 777 | 787 | ||||||||||||||||
2010 | ||||||||||||||||||||
Program accounting quantities | 5,000 | 1,524 | 1,048 | 1,150 | * | |||||||||||||||
Undelivered units under firm orders | 2,186 | 107 | 50 | 253 | 847 | |||||||||||||||
Cumulative firm orders | 5,690 | 1,525 | 1,044 | 1,163 | 847 | |||||||||||||||
2009 | ||||||||||||||||||||
Program accounting quantities | 4,600 | 1,499 | 1,035 | 1,100 | * | |||||||||||||||
Undelivered units under firm orders | 2,076 | 108 | 59 | 281 | 851 | |||||||||||||||
Cumulative firm orders | 5,204 | 1,526 | 1,041 | 1,117 | 851 | |||||||||||||||
2008 | ||||||||||||||||||||
Program accounting quantities | 4,200 | 1,499 | 1,023 | 1,050 | * | |||||||||||||||
Undelivered units under firm orders | 2,270 | 114 | 70 | 350 | 910 | |||||||||||||||
Cumulative firm orders | 5,026 | 1,524 | 1,039 | 1,098 | 910 | |||||||||||||||
| * | A final determination of the initial accounting quantity for the 787 program will be made in the quarter of first airplane delivery, targeted for the third quarter of 2011. |
737 Program The accounting quantity for the 737 program increased by 400 units during 2010. During 2010, we announced plans to increase monthly production of the 737 from 31.5 to 35 airplanes per month beginning in the first quarter of 2012 and a further increase to 38 airplanes per month beginning in the second quarter of 2013.
747 Program The accounting quantity for the 747 program increased by 25 units during 2010. During 2009 and 2008, we recorded charges of $1,352 million and $685 million to recognize reach-forward losses on the 747 program reflecting higher than anticipated costs, a reduction in delivery price increases associated with escalation and difficult cargo market conditions which caused us to defer a planned production rate increase for 747-8. First flight of the 747-8 Freighter occurred on February 8, 2010. A fourth aircraft was added to the flight test program in July 2010 to improve flight test efficiency. On September 30, 2010, we announced that the expected first delivery of the 747-8 Freighter would move to the middle of 2011 from the fourth quarter of 2010 and a fifth airplane would be added to the flight test fleet to support the new schedule. The new delivery schedule followed an assessment of the expected cumulative impact of flight test discoveries, which include a low frequency vibration in certain flight conditions and an underperforming aileron actuator. While neither issue required structural changes to the airplane, they led to disruptions to certification testing, which the program was unable to offset within the prior schedule. We are currently producing 747-8 airplanes and until completion of our flight test program, there is risk that additional items may be identified that require further modifications or other changes to those aircraft we have produced. On March 19, 2010, we announced that we will accelerate, from mid-2013 to mid-2012, a planned production rate increase from 1.5 to 2 airplanes per month. Certification and first delivery of the Intercontinental passenger derivative is expected in the fourth quarter of 2011. Schedule and other risks inherent in the demanding flight test and certification phases of program development remain.
767 Program The accounting quantity for the 767 program increased by 13 units during 2010.
777 Program The accounting quantity for the 777 program increased by 50 units during 2010. In April 2009, we announced that monthly production of the 777 will decline from 7 to 5 airplanes per month
26
beginning in June 2010. In March 2010, we announced that we will accelerate by approximately six months, from early 2012 to mid-2011, a planned production rate increase to 7 airplanes per month. In December 2010, we announced that monthly production of the 777 will increase from 7 to 8.3 airplanes per month in the first quarter 2013.
787 Program First flight of the 787 occurred on December 15, 2009 and flight testing for certification continued during 2010. Flight testing involves six flight test aircraft and a limited amount of testing on two production-configured airplanes prior to first delivery. On August 27, 2010, we announced that the expected date of first delivery of the 787 had been moved to mid-first quarter 2011 from the fourth quarter of 2010. This schedule revision followed an assessment of the cumulative impact of a number of issues, including supplier workmanship issues related to the horizontal stabilizer, instrumentation delays and the expected availability date of an engine needed to support the final phases of flight test. On November 9, 2010, a flight test aircraft lost primary electrical power as a result of an onboard fire. Back-up systems functioned as expected allowing the crew to complete a safe landing. Flight testing was suspended pending investigation. On November 24, 2010, we announced minor design changes to power distribution panels and updates to systems software resulting from the investigation. On December 23, 2010, we resumed Boeing flight test activities and on January 17, 2011 resumed certification testing. On January 18, 2011, we announced that the expected date of first delivery had been moved to the third quarter of 2011 due to the flight testing and certification delays.
A number of engineering and other design changes have been identified in conjunction with the flight test program that are being incorporated into our production system and on aircraft already completed. During 2010, we continued to produce 787 airplanes and until completion of our flight test program, there is risk that additional items will be identified that require further modifications or other changes to those aircraft we have produced.
We continue to monitor and address challenges associated with assembly of initial airplanes including management of our extended global supply chain, incorporation of design changes into aircraft in various stages of assembly, completion and integration of traveled work as well as weight and systems integration. For example, during the second quarter of 2010 we delayed some 787 component deliveries to reduce out of sequence work moving into final assembly at our Everett factory and improve supply chain efficiency.
We continue to work toward planned increases in 787 production rates as well as the timely introduction of the 787-9 derivative. Such efforts include the construction of a second assembly line in North Charleston, South Carolina and establishing transitional surge capacity at our Everett, Washington location. On July 1, 2010, we completed firm configuration of the 787-9 airplane with first delivery scheduled for late 2013.
We continue to work with our customers and suppliers to assess the specific impacts of schedule changes, including delivery delays and supplier assertions. Efforts continue to ensure we remain focused on satisfying customer mission and performance needs in light of the anticipated weight of their respective aircraft. A number of our customers have contractual remedies for schedule delays and/or performance. We continue to address customer and supplier claims and requests for other contractual relief as brought forth.
During 2009, we concluded that the first three flight-test 787 aircraft could not be sold as previously anticipated due to the inordinate amount of rework and unique and extensive modifications made to those aircraft. As a result, costs associated with these aircraft were included in research and development expense. We believe that the other three 787 flight test aircraft are commercially saleable and we continue to include costs related to those aircraft in program inventory at December 31, 2010. If we determine that one or more of the other flight test aircraft cannot be sold, we may incur additional charges.
27
Our current assessment is that the program is not in a reach-forward loss position, however the cumulative impacts of the production challenges, schedule delays and customer and supplier impacts have created significant pressure on program profitability and we expect to record zero margin on our initial deliveries. We continue to implement mitigation plans and cost-reduction efforts to address this pressure.
Fleet Support We provide the operators of our commercial airplanes with assistance and services to facilitate efficient and safe aircraft operation. Collectively known as fleet support services, these activities and services begin prior to aircraft delivery and continue throughout the operational life of the aircraft. They include flight and maintenance training, field service support costs, engineering services and technical data and documents. The costs for fleet support are expensed as incurred and have been historically less than 1.5% of total consolidated costs of products and services. These costs are expected to increase with 787 and 747-8 entry into service.
Research and Development The following chart summarizes the time horizon between go-ahead and planned certification/initial delivery for major Commercial Airplanes derivatives and programs.
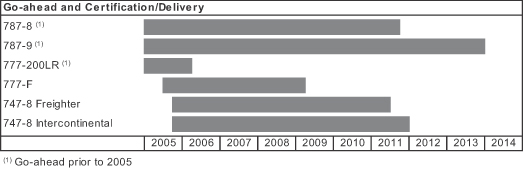
Our Research and development expense decreased by $2,408 million in 2010. This was primarily due to the reclassification to research and development expense of $2,693 million of production costs related to the three 787 flight test aircraft in 2009, partially offset by a $285 million increase of other research and development expense.
Our Research and development expense increased by $2,545 million in 2009. This was due to the 2009 reclassification of production costs related to the three 787 flight test aircraft and $50 million of lower supplier development cost sharing payments, partially offset by a $198 million decrease of other research and development expense.
Additional Considerations
The 787 and 747-8 programs highlight the risks inherent in new airplane programs and new derivative airplanes, particularly as both the 747-8 Freighter and the 787-8 continue the demanding flight test and certification phases of program development. Development also continues on the 787-9 and 747-8 Intercontinental. Costs related to development of new programs and derivative airplanes are expensed as incurred. Costs to produce new aircraft are included in inventory and accounted for using program accounting. Airplane programs have risk for reach-forward losses if our estimated production costs exceed our estimated program revenues for the accounting quantity. Generally commercial airplanes are sold on a firm fixed-price basis with an indexed price escalation clause and are often sold several years before scheduled delivery. Each customer purchase agreement contains an escalation clause to account for the effects of economic fluctuations over the period of time from airplane sale to airplane delivery. A price escalation formula based on pre-defined factors is used to determine the final price of
28
the airplane at the time of customer delivery. While firm fixed-price contracts allow us to benefit from cost savings, they also expose us to the risk of cost overruns. Many new airplanes and derivatives have highly complex designs, utilize exotic materials and require extensive coordination and integration with supplier partners. As technical or quality issues arise, such as issues experienced on the 787 and 747-8 programs, we may experience schedule delays and higher costs to complete new programs and derivative aircraft. Additionally, price escalation factors may also impact margins by reducing the estimated price of airplanes delivered in the future. There are other factors that could also result in lower margins or a material charge if a program has or is determined to have reach-forward losses. These include: changes to the program accounting quantity, customer and model mix, production costs and rates, capital expenditures and other costs associated with increasing or adding new production capacity, learning curve, anticipated cost reductions, flight test and certification schedules, costs, schedule and demand for derivative airplanes and status of customer claims, supplier assertions and other contractual negotiations. While we believe the cost and revenue estimates incorporated in the financial statements are appropriate, the technical complexity of these programs creates financial risk as additional completion costs may become necessary or scheduled delivery dates could be extended, which could trigger termination provisions, order cancellations or other financially significant exposure.
Boeing Defense, Space & Security
Business Environment and Trends
U.S. Defense Environment Overview The U.S. continues to balance funding priorities to plan for the broadest possible range of operations that include homeland defense, natural disasters, stabilization efforts, counterinsurgency and counterterrorism operations, or nation state aggressors with growing sophistication and military means. The U.S. Department of Defense (U.S. DoD) faces the simultaneous requirements to execute the national security policy, recapitalize important capabilities, and transform the force to meet the changing national security threat environment as articulated in the 2010 National Security Strategy and Quadrennial Defense Review. These actions must be carried out against a backdrop of significant competing national priorities including the economic crisis, the national debt and healthcare reform. As a result, the traditional roles of defense and security are converging into a single set of customer needs. We anticipate that the national security environment will remain dynamic and challenging well into this decade trending with the threat environment.
U.S. government policies impacting the defense environment include: efficiency initiatives to save at least $100 billion through 2016, defense acquisition reform, increased insourcing, concerns over the decline of the U.S. industrial base, a shift in emphasis towards more affordable solutions, and emphasis on increasing diplomatic efforts to expand and strengthen our alliances. In January 2011, the U.S. DoD announced its intention to further reduce its top-line base budget by $78 billion over the next five years.
Although the U.S. DoD budget has grown substantially over the past decade, we expect the total budget growth rate to level off or even decline slightly over the next several years due to these shifting priorities and budget pressures. The fiscal year 2011 discretionary budget of $708 billion includes an Overseas Contingency Operations (OCO) budget of $159 billion. Procurement is expected to increase, while research and development accounts are expected to decrease due to growing requirements from operations and maintenance (O&M) and personnel costs tied to U.S. commitments overseas. However, this trend is partially offset by equipment recapitalization efforts and continued demand for systems development. The near-term forecast of the defense budget environment shows limited growth in the 2012 to 2016 period for investment efforts. Although opportunities may exist following complete U.S. troop draw-downs in Iraq in late 2011, they may be offset by sustained O&M requirements in Afghanistan. Early indications suggest that coalition forces will sustain operations in the Afghanistan Theater longer than initially anticipated. We continue to see pressure to reduce OCO requests that have been used to cover the ongoing costs of the wars.
29
It is unlikely that the U.S. DoD will be able to fully fund all programs of record already in development as well as new initiatives. This imbalance between future costs of programs and expected funding levels is not uncommon in the U.S. DoD and is routinely managed by internally adjusting priorities and schedules, restructuring programs, and lengthening production runs to meet the constraints of available funding and occasionally by cancellation of programs. We expect the U.S. DoD will respond to future budget constraints by focusing on affordability strategies from acquisition efficiencies and reforms and emphasizing utilization of commercial off-the-shelf solutions and network-enabled operations. These strategies will be enabled through persistent intelligence, surveillance, and reconnaissance (ISR), long-range strike, special operations, unmanned systems, cybersecurity, precision-guided kinetic and non-kinetic weapons, electronic warfare, as well as selected outsourcing of logistics and support activities to improve overall effectiveness while maintaining control over costs.
International Environment Overview The international market continues to be driven by rapidly evolving security challenges and countries' need to modernize aging inventories. Western governments are pressured by new threats to security while at the same time dealing with constrained budgets. In Europe, global economic conditions are creating downward pressure on budget resources and austerity measures have been put in place to reduce defense spending in the near term.
The strongest opportunities for 2011 growth of the BDS portfolio will be in the Middle East and Asia-Pacific regions where modernization budgets remain relatively stable. With increasing needs and aging equipment, these regions have the financial strength necessary to make future defense purchases. Boeing's portfolio of defense, space and security solutions offers proven capability, predictable price, and near-term availability that are well matched to this challenging international environment.
Adjacent Market Environment Overview We are repositioning our business to expand our capabilities and accelerate growth in the following targeted adjacencies: Unmanned Systems; Cyber and Information Services; Security; Command, Control, Communications, Computers, Intelligence, Surveillance, and Reconnaissance (C4ISR); and Logistics Command and Control (LogC2) and Energy Services.
We anticipate continued growth in unmanned systems as these products provide critical mission functions to the warfighter with a focus on affordability, persistence, and accuracy. The demand for defensive, offensive, and exploit operations in the emerging Cyber market provides unique growth opportunities as explicit needs are further defined by customers. Key growth areas in Security include aviation security, border security, maritime security and cybersecurity as the U.S. government looks to work more closely with state and local institutions. The dependence on time-critical information for intelligence-based operations has fueled the need for C4ISR technologies that locate, identify, and track elusive and ephemeral targets. We continue to find opportunity in the LogC2 market in areas including logistics operations, supply chain management, and logistics training and simulations. Lastly, as energy volatility increases and pressure is placed on the national grid infrastructure, we expect that the need for energy services such as energy management, infrastructure security, and scenario modeling will increase accordingly.
BDS Realignment
Effective January 1, 2010, 2009 and 2008, certain programs were realigned among BDS segments. Business segment data for all periods presented have been adjusted to reflect the realignment.
30
Operating Results
(Dollars in millions)
| Years ended December 31, | 2010 | 2009 | 2008 | |||||||||
Revenues | $ | 31,943 | $ | 33,661 | $ | 32,047 | ||||||
% of Total company revenues | 50 | % | 49 | % | 53 | % | ||||||
Earnings from operations | $ | 2,875 | $ | 3,299 | $ | 3,232 | ||||||
Operating margins | 9.0 | % | 9.8 | % | 10.1 | % | ||||||
Research and development | $ | 1,136 | $ | 1,101 | $ | 933 | ||||||
Contractual backlog | $ | 48,364 | $ | 46,024 | $ | 45,285 | ||||||
Unobligated backlog | $ | 16,822 | $ | 18,815 | $ | 27,719 | ||||||
Since our operating cycle is long-term and involves many different types of development and production contracts with varying delivery and milestone schedules, the operating results of a particular year, or year-to-year comparisons of revenues and earnings, may not be indicative of future operating results. In addition, depending on the customer and their funding sources, our orders might be structured as annual follow-on contracts, or as one large multi-year order or long-term award. As a result, period-to-period comparisons of backlog are not necessarily indicative of future workloads. The following discussions of comparative results among periods should be viewed in this context.
Revenues BDS revenues decreased by $1,718 million in 2010 compared with 2009, due to lower revenues in all three segments, with the largest decrease in the N&SS segment. BDS revenues increased by $1,614 million in 2009 compared with 2008, due to higher revenues in GS&S and BMA, partially offset by decreases in N&SS.
Operating Earnings BDS operating earnings in 2010 decreased by $424 million compared with 2009 primarily due to lower margins in the BMA segment and lower revenues in the N&SS segment. BDS operating earnings in 2009 increased by $67 million compared with 2008 primarily due to higher earnings in the BMA segment, partially offset by lower earnings in the N&SS segment.
Backlog Total backlog is comprised of contractual backlog, which represents work we are on contract to perform for which we have received funding, and unobligated backlog, which represents work we are on contract to perform for which funding has not yet been authorized and appropriated. BDS total backlog increased by less than 1% in 2010, from $64,839 million to $65,186 million, primarily due to multi-year procurement contract awards on the F/A-18 and International Space Station programs, two commercial satellite contract awards, and the UK Future Logistics Information Services (FLIS) contract award, offset by current year deliveries and sales on multi-year contracts awarded in prior years. For further details on the changes between periods, refer to the discussions of the individual segments below.
Additional Considerations
Our business includes a variety of development programs which have complex design and technical challenges. Many of these programs have cost-type contracting arrangements. In these cases the associated financial risks are primarily in lower profit rates or program cancellation if milestones and technical progress are not accomplished. Examples of these programs include Family of Beyond Line-of-Sight Terminals, BCTM, GMD, Joint Tactical Radio System, P-8A Poseidon and Proprietary programs.
Some of our development programs are contracted on a fixed-price basis. Many of these programs have highly complex designs. As technical or quality issues arise, we may experience schedule delays
31
and cost impacts, which could increase our estimated cost to perform the work or reduce our estimated price, either of which could result in a material charge. These programs are ongoing, and while we believe the cost and fee estimates incorporated in the financial statements are appropriate, the technical complexity of these programs creates financial risk as additional completion costs may become necessary or scheduled delivery dates could be extended, which could trigger termination provisions, the loss of satellite in-orbit incentive payments, or other financially significant exposure. These programs have risk for reach-forward losses if our estimated costs exceed our estimated contract revenues. Examples of our fixed-price development programs include Airborne Early Warning and Control (AEW&C), P-8I, KC-767 International Tanker, and commercial and military satellites.
Boeing Military Aircraft
Operating Results
(Dollars in millions)
| Years ended December 31, | 2010 | 2009 | 2008 | |||||||||
Revenues | $ | 14,238 | $ | 14,304 | $ | 13,445 | ||||||
% of Total company revenues | 22 | % | 21 | % | 22 | % | ||||||
Earnings from operations | $ | 1,258 | $ | 1,528 | $ | 1,294 | ||||||
Operating margins | 8.8 | % | 10.7 | % | 9.6 | % | ||||||
Research and development | $ | 589 | $ | 582 | $ | 486 | ||||||
Contractual backlog | $ | 25,094 | $ | 26,354 | $ | 25,802 | ||||||
Unobligated backlog | $ | 8,297 | $ | 9,297 | $ | 10,035 | ||||||
Revenues BMA revenues decreased by less than 1% in 2010 and increased by 6% in 2009. Lower revenues in 2010 on the C-17, Apache and T-45 programs were nearly offset by higher Chinook, F/A-18 and AEW&C revenues. The increase of $859 million in 2009 was primarily due to higher revenues on the Apache, V-22, Chinook, F/A-18, and Proprietary programs, partly offset by lower revenues on the F-22 and several weapons programs.
Deliveries of new-build production aircraft, excluding remanufactures and modifications, were as follows:
| Years ended December 31, | 2010 | 2009 | 2008 | |||||||||
F/A-18 Models | 50 | 49 | 45 | |||||||||
F-15E Eagle | 13 | 13 | 14 | |||||||||
C-17 Globemaster | 14 | 16 | 16 | |||||||||
AH-64 Apache | 13 | 23 | 3 | |||||||||
CH-47 Chinook | 20 | 11 | 12 | |||||||||
AEW&C | 4 | |||||||||||
KC-767 Tanker | 1 | 2 | 2 | |||||||||
T-45TS Goshawk | 7 | 7 | ||||||||||
Total new-build production aircraft | 115 | 121 | 99 | |||||||||
Operating Earnings BMA earnings decreased by $270 million in 2010 primarily due to lower deliveries of C-17 aircraft and less favorable pricing and mix on the C-17 program. BMA operating earnings increased by $234 million in 2009 partly due to higher deliveries on several programs and volume, partially offset by a change in delivery mix. Operating earnings in both years were negatively impacted by charges recorded on the AEW&C and KC-767 International Tanker programs.
32
Research and Development The BMA segment continues to focus research and development resources to leverage customer knowledge, technical expertise and system integration of manned and unmanned systems that provide innovative solutions to meet the warfighter's enduring needs. Research and development expense remained flat in 2010 but in 2009 increased by 20% over 2008 primarily due to increased prototyping activities which were partially offset by lower international tanker development costs. Research and development activities utilize our capabilities in architectures, system-of-systems integration and weapon systems technologies to develop solutions which are designed to better prepare us to meet customers' needs in U.S. and international growth areas such as: military-commercial derivatives, rotorcraft, global strike, missiles and unmanned airborne systems, and surveillance and engagement systems. The products of our research and development support both new manned and unmanned systems as well as enhanced versions of existing fielded products. Investments support vertical integration of our product line in areas such as autonomous operation of unmanned systems, advanced sensors and electronic warfare. These efforts focus on increasing mission effectiveness, interoperability, reliability and reducing the cost of ownership.
Backlog BMA total backlog in 2010 decreased 6% from 2009, primarily due to deliveries and sales on multi-year contracts awarded in prior years partially offset by a multi-year contract award on the F/A-18 program. Total backlog in 2009 was virtually unchanged from 2008. Backlog increases due to 2009 orders for C-17, P-8I and Chinook aircraft were offset by revenues recognized on multi-year contracts received in prior years with the largest decrease in the F/A-18 program.
Additional Considerations
AEW&C The AEW&C development program, also known as Wedgetail in Australia, Peace Eagle in Turkey and Peace Eye in the Republic of Korea, consists of 737-700 aircraft outfitted with a variety of command and control and advanced radar systems, some of which have never been installed on an airplane before. Wedgetail includes six aircraft and Peace Eagle and Peace Eye include four aircraft each. During 2010, 2009 and 2008, we recorded charges increasing the reach-forward losses on the AEW&C programs in Australia and Turkey by $174 million, $133 million and $308 million, respectively. These charges reflect technical performance issues associated with the test program, delivery schedule delays, subsystem development issues, and additional time for integration testing. During 2010, four Wedgetail aircraft were delivered to Australia with initial customer acceptance. Final customer acceptance for all six Wedgetail aircraft is scheduled to be completed by the end of 2011. In January 2011, the Peace Eagle program began the formal test phase. These are advanced and complex fixed-price development programs involving technical challenges at the individual subsystem level and in the overall integration of these subsystems into a reliable and effective operational capability. We believe that the cost and revenue estimates incorporated in the financial statements are appropriate; however, the technical complexity of the programs creates financial risk as additional completion costs may be necessary or scheduled delivery dates could be delayed.
KC-767 International Tanker The KC-767 International Tanker program includes four aircraft for the Italian Air Force and four aircraft for the Japanese Air Self Defense Force. During 2010, 2009 and 2008, we recorded charges increasing the reach-forward losses in the KC-767 International Tanker program by $53 million, $78 million and $85 million, respectively. The final delivery to Japan was made in December 2009 and first delivery to Italy was made in December 2010. The Italian KC-767 Tanker program is ongoing, and while we believe the revenue and cost estimates incorporated in the financial statements are appropriate, the technical complexity of the program creates financial risk as additional completion and development costs may be necessary or remaining scheduled delivery dates could be delayed.
C-17 See the discussion of the C-17 program in Note 11 to our Consolidated Financial Statements.
33
Network & Space Systems
Operating Results
(Dollars in millions)
| Years ended December 31, | 2010 | 2009 | 2008 | |||||||||
Revenues | $ | 9,455 | $ | 10,877 | $ | 11,346 | ||||||
% of Total company revenues | 15 | % | 16 | % | 19 | % | ||||||
Earnings from operations | $ | 711 | $ | 839 | $ | 1,034 | ||||||
Operating margins | 7.5 | % | 7.7 | % | 9.1 | % | ||||||
Research and development | $ | 417 | $ | 397 | $ | 298 | ||||||
Contractual backlog | $ | 9,586 | $ | 7,746 | $ | 8,868 | ||||||
Unobligated backlog | $ | 8,435 | $ | 9,187 | $ | 16,981 | ||||||
Revenues N&SS revenues decreased 13% in 2010 and 4% in 2009. The decrease of $1,422 million in 2010 is primarily due to lower volume on the BCTM and GMD programs. The decrease of $469 million in 2009 is primarily due to lower volume on the GMD, Intelligence and Security Systems, and Proprietary programs, partly offset by higher volume on several satellite programs.
Delta launch and new-build satellite deliveries were as follows:
| Years ended December 31, | 2010 | 2009 | 2008 | |||||||||
Delta II | 1 | 1 | 2 | |||||||||
Delta IV | 1 | 1 | ||||||||||
Commercial and civil satellites | 3 | 3 | 1 | |||||||||
Military satellites | 1 | 3 | ||||||||||
Operating Earnings N&SS earnings decreased by $128 million in 2010 primarily due to lower revenues. N&SS earnings decreased by $195 million in 2009 primarily due to lower revenues and charges related to the Sea Launch bankruptcy. Earnings in 2009 were also reduced by charges related to the settlement of a satellite contract dispute and indemnification of Delta II inventory. Earnings in 2008 included a favorable settlement on a civil satellite program. N&SS operating earnings include equity earnings of $189 million, $164 million and $178 million from the United Space Alliance joint venture and the United Launch Alliance (ULA) joint venture in 2010, 2009 and 2008, respectively.
Research and Development The N&SS research and development funding remains focused on the development of C4ISR that support a network-enabled architecture approach for our customers. We are investing in capabilities to enhance connectivity between existing and new air/ground and maritime platforms, to increase communications availability, utility and bandwidth through more robust space systems, and to leverage innovative networking and ISR concepts. Investments were also made to develop concepts and capabilities related to cyber and security products, as well as the development of next-generation space and intelligence systems. Along with increased funding to support these network-enabled capabilities, we also maintained our investment levels in missile defense, directed energy and advanced exploration systems.
Backlog N&SS total backlog increased 6% in 2010 compared with 2009 primarily due to two commercial satellite contract awards, a multi-year contract award on the International Space Station program and GMD contract awards, partially offset by revenues recognized on the BCTM program. Total backlog decreased by 34% in 2009 compared with 2008 partly due to the partial termination for convenience by the U.S. Army of the BCTM System Development and Demonstration contract related to Manned Ground Vehicles and associated systems and equipment. 2009 deliveries and sales on multi-year contracts awarded in prior years including BCTM, GMD, and Proprietary programs also contributed to the backlog reduction.
34
Additional Considerations
United Launch Alliance On December 1, 2006, we and Lockheed Martin Corporation (Lockheed) created a 50/50 joint venture named United Launch Alliance L.L.C. ULA combines the production, engineering, test and launch operations associated with U.S. government launches of Boeing Delta and Lockheed Atlas rockets. We initially contributed net assets of $914 million at December 1, 2006. The book value of our investment exceeded our proportionate share of ULA's net assets. This difference is expensed ratably in future years. Based on the adjusted contributions and the conformed accounting policies established by ULA, this amortization is expected to be approximately $15 million annually for the next 14 years.
In connection with the formation of ULA, we and Lockheed each committed to provide up to $200 million to support ULA's working capital requirements through December 1, 2011. We and Lockheed transferred performance responsibility for certain U.S. government contracts to ULA as of the closing date. We and Lockheed agreed to jointly guarantee the performance of those contracts to the extent required by the U.S. government. We and Lockheed have also each committed to provide ULA with up to $232 million of additional capital contributions in the event ULA does not have sufficient funds to make a required payment to us under an inventory supply agreement. See Note 11 to our Consolidated Financial Statements.
We agreed to indemnify ULA through December 31, 2020 against potential non-recoverability and non-allowability of $1,360 million of Boeing Delta launch program inventory included in contributed assets plus $1,860 million of inventory subject to an inventory supply agreement which ends on March 31, 2021. Since inception, ULA has consumed $1,201 million of inventory that was contributed by us. ULA has made advance payments of $420 million to us and we have recorded revenues and cost of sales of $166 million under the inventory supply agreement through December 31, 2010. ULA is continuing to assess the future of the Delta II program beyond what is currently on contract. In the event ULA is unable to sell additional Delta II inventory, our earnings could be reduced by up to $70 million.
We agreed to indemnify ULA against potential losses that ULA may incur in the event ULA is unable to obtain certain additional contract pricing from the U.S. Air Force (USAF) for four satellite missions. We believe ULA is entitled to additional contract pricing. In December 2008, ULA submitted a claim to the USAF to re-price the contract value for two satellite missions. In March 2009, the USAF issued a denial of that claim and in June 2009, ULA filed an appeal. During 2009, the USAF exercised its option for a third satellite mission. During the third quarter of 2010, ULA submitted a claim to the USAF to re-price the contract value of the third mission. The USAF did not exercise an option for a fourth mission prior to expiration. If ULA is unsuccessful in obtaining additional pricing, we may be responsible for a portion of the shortfall and may record up to $283 million in pre-tax losses associated with the three missions, representing up to $261 million for the indemnification payment and up to $22 million for our portion of additional contract losses incurred by ULA.
Sea Launch See the discussion of the Sea Launch receivables in Note 6 to our Consolidated Financial Statements.
Satellites See the discussions of Boeing Satellite Systems International, Inc. (BSSI) in Note 20 to our Consolidated Financial Statements.
35
Global Services & Support
Operating Results
(Dollars in millions)
| Years ended December 31, | 2010 | 2009 | 2008 | |||||||||
Revenues | $ | 8,250 | $ | 8,480 | $ | 7,256 | ||||||
% of Total company revenues | 13 | % | 12 | % | 12 | % | ||||||
Earnings from operations | $ | 906 | $ | 932 | $ | 904 | ||||||
Operating margins | 11.0 | % | 11.0 | % | 12.5 | % | ||||||
Research and development | $ | 130 | $ | 122 | $ | 149 | ||||||
Contractual backlog | $ | 13,684 | $ | 11,924 | $ | 10,615 | ||||||
Unobligated backlog | $ | 90 | $ | 331 | $ | 703 | ||||||
Revenues GS&S revenues decreased $230 million in 2010, a decrease of 3%, and increased $1,224 million in 2009, an increase of 17%, in each case compared with the prior year. The 2010 decrease is primarily due to lower revenues on several Maintenance, Modifications and Upgrades (MM&U) programs partially offset by higher revenues on several Integrated Logistics (IL) programs. The 2009 increase was due to increased volume in the IL programs and the Training Systems and Services (TS&S) divisions.
Operating Earnings GS&S operating earnings decreased by 3% in 2010 primarily due to lower revenues. Operating earnings increased 3% in 2009 as additional earnings from increased volume were partially offset by lower margins due to contract adjustments and changes in contract mix.
Research and Development GS&S continues to focus investment strategies on its core businesses including IL, MM&U and TS&S, as well as on moving into new market areas of logistics command and control (Log C2) in Advanced Services and energy management in Boeing Energy. Investments have been made to continue the development and implementation of innovative tools, processes and systems as market discriminators in the delivery of integrated customer solutions.
Backlog GS&S total backlog increased by 12% in 2010 compared with 2009 primarily due to the award of the UK FLIS contract. Backlog also increased due to increases in several IL and MM&U programs, partially offset by decreases in several Training Systems programs. Total backlog increased by 8% in 2009 compared with 2008 due to significant growth in International Support and Defense and Government Services programs and partially offset by decreases in several IL and MM&U programs.
Boeing Capital Corporation
Business Environment and Trends
BCC's customer financing and investment portfolio at December 31, 2010 totaled $4,694 million. A substantial portion of BCC's portfolio is concentrated among certain U.S. commercial airline customers. BCC's portfolio is also concentrated by varying degrees across Boeing aircraft product types most notably out of production Boeing aircraft such as 717 aircraft.
We provided greater amounts of financing to Boeing customers during 2009 than in any of the preceding five years. Sources of financing available for aircraft deliveries improved during 2010 and as a result, we provided no financing for Boeing aircraft deliveries.
Aircraft values and lease rates are impacted by the number and type of aircraft that are currently out of service. Approximately 2,200 western-built commercial jet aircraft (10.5% of current world fleet) were
36
parked at the end of 2010, including both in-production and out-of-production aircraft types. Of these parked aircraft, over 30% are not expected to return to service. At the end of 2009 and 2008, 11.6% and 11.0% of the western-built commercial jet aircraft were parked. Aircraft valuations could decline if significant numbers of additional aircraft, particularly types with relatively few operators, are placed out of service.
Summary Financial Information
(Dollars in millions)
| Years ended December 31, | 2010 | 2009 | 2008 | |||||||||
Revenues | $ | 639 | $ | 660 | $ | 703 | ||||||
Earnings from operations | $ | 152 | $ | 126 | $ | 162 | ||||||
Operating margins | 24 | % | 19 | % | 23 | % | ||||||
Revenues
BCC segment revenues consist principally of lease income from equipment under operating lease and interest from financing receivables and notes. BCC's revenues decreased $21 million and $43 million in 2010 and 2009, due to a smaller portfolio of equipment under operating leases as a result of aircraft returns and lower lease rates on re-leased aircraft.
Earnings From Operations
BCC's operating earnings are presented net of interest expense, provision for (recovery of) losses, asset impairment expense, depreciation on leased equipment and other operating expenses. Operating earnings increased by $26 million in 2010 compared with 2009 primarily due to lower impairment expense and lower provision for losses. The impact of declines in aircraft collateral values recognized by BCC and reduced projected cash flows for certain aircraft was not as significant in 2010 as it was in 2009. The decrease in operating earnings in 2009 compared with 2008 was primarily due to lower revenues and higher asset impairment expense and provision for losses.
Financial Position
The following table presents selected financial data for BCC as of December 31:
| (Dollars in millions) | 2010 | 2009 | ||||||
BCC Customer Financing and Investment Portfolio | $ | 4,694 | $ | 5,666 | ||||
Valuation Allowance as a % of Total Receivables | 3.8 | % | 2.5 | % | ||||
Debt | $ | 3,446 | $ | 4,075 | ||||
Debt-to-Equity Ratio | 5.0-to-1 | 5.8-to-1 | ||||||
BCC's customer financing and investment portfolio at December 31, 2010 decreased from December 31, 2009 due to normal portfolio run-off and asset pre-payments. At December 31, 2010 and 2009, BCC had $583 million and $385 million of assets that were held for sale or re-lease, of which $28 million and $345 million had either executed term sheets with deposits or firm contracts to be sold or placed on lease. The increase was primarily due to BCC's termination of aircraft leases with Aevovias Caribe S.A. de C.V. (Click), an affiliate of Compania Mexicana de Aviacion S.A. de C.V. (Mexicana), in August 2010. Additionally, aircraft subject to leases with a carrying value of approximately $174 million are scheduled to be returned off lease during 2011. These aircraft are being remarketed or we are seeking to have the leases extended.
37
BCC enters into certain transactions with the Other segment in the form of intercompany guarantees and other subsidies that mitigate the effects of certain credit quality or asset impairment issues on the BCC segment.
Bankruptcies
In August 2010, Mexicana filed for bankruptcy protection in Mexico and the United States. At the time of those filings, BCC had leased and delivered 19 717 aircraft to Click, and 6 additional 717 aircraft were scheduled for delivery to Click under executed leases. On August 27, 2010, BCC served Click a notice of termination of all 25 leases as a result of non-payment. On or about August 28, 2010, Click ceased flight operations. In September 2010, Click filed for bankruptcy protection. BCC has recovered all of the aircraft that had been delivered to Click. In the third quarter of 2010, we recorded an $81 million net impairment charge related to certain 717 aircraft leased to Click. This charge was primarily recorded in the Other segment due to an intercompany guarantee between us and BCC. Additional impairment charges could be recorded if we are unable to re-lease the aircraft at anticipated rental rates.
Southwest/AirTran Merger
On September 26, 2010, Southwest Airlines Co. (Southwest) and AirTran Holdings, Inc. (AirTran) entered into an Agreement and Plan of Merger, whereby Southwest will acquire, subject to certain conditions, all of the outstanding common stock of AirTran. AirTran, together with its subsidiaries, represents approximately 27% of our gross customer financing portfolio carrying value, consisting principally of 717 aircraft. AirTran is the largest customer in terms of BCC's segment revenue and customer financing portfolio carrying value.
Restructurings and Restructuring Requests
From time to time, certain customers have requested a restructuring of their transactions with BCC. As of December 31, 2010, BCC has not reached agreement on any restructuring requests that would have a material adverse effect on its earnings, cash flows and/or financial position.
Other Segment
(Dollars in millions)
| Years ended December 31, | 2010 | 2009 | 2008 | |||||||||
Revenues | $ | 138 | $ | 165 | $ | 567 | ||||||
Loss from operations | (327 | ) | (152 | ) | (307 | ) | ||||||
Other segment operating losses for the year ended December 31, 2010 increased by $175 million primarily due to $144 million of charges related to our customer financing portfolio and higher environmental remediation expenses of $36 million.
Other segment revenues for the year ended December 31, 2009 decreased by $402 million compared with 2008 primarily due to the sale of three C-17 aircraft in 2008 held under operating lease. Other segment operating losses for the year ended December 31, 2009 decreased by $155 million primarily due to recognition of pre-tax expense of $82 million in the prior year to increase the allowance for losses on customer financing receivables related to lower U.S. airline customer credit ratings. During 2009, Other segment recognized $76 million in lower charges relating to environmental remediation than in 2008.
38
Liquidity and Capital Resources
Cash Flow Summary
(Dollars in millions) | ||||||||||||
| Years ended December 31, | 2010 | 2009 | 2008 | |||||||||
Net earnings | $ | 3,307 | $ | 1,312 | $ | 2,672 | ||||||
Non-cash items | 2,679 | 2,381 | 1,829 | |||||||||
Changes in working capital | (3,034 | ) | 1,910 | (4,902 | ) | |||||||
Net cash provided/(used) by operating activities | 2,952 | 5,603 | (401 | ) | ||||||||
Net cash (used)/provided by investing activities | (4,831 | ) | (3,794 | ) | 1,888 | |||||||
Net cash (used)/provided by financing activities | (1,962 | ) | 4,094 | (5,202 | ) | |||||||
Effect of exchange rate changes on cash and cash equivalents | (15 | ) | 44 | (59 | ) | |||||||
Net (decrease)/increase in cash and cash equivalents | (3,856 | ) | 5,947 | (3,774 | ) | |||||||
Cash and cash equivalents at beginning of year | 9,215 | 3,268 | 7,042 | |||||||||
Cash and cash equivalents at end of year | $ | 5,359 | $ | 9,215 | $ | 3,268 | ||||||
Operating Activities Net cash provided by operating activities decreased by $2,651 million to $2,952 million during 2010 compared with 2009 primarily due to higher net working capital in 2010, driven by growth in inventory as we continue to build inventories prior to the anticipated delivery and production ramp-up of the 787 and 747-8 programs. We expect the 787 inventory growth in 2011 to be similar to the growth experienced in 2010 while we expect 747-8 inventory to begin to decline as aircraft are delivered.
Investing Activities Cash used by investing activities totaled $4,831 million during 2010 compared with $3,794 million used during 2009, primarily due to higher net contributions to time deposits during 2010. In 2010, capital expenditures totaled $1,125 million down from $1,186 million in 2009. We expect capital spending in 2011 to be higher than 2010 due to the ongoing construction of a 787 final assembly line in North Charleston, South Carolina and higher spending to support commercial airplane production rate increases. Expenditures on acquisitions totaled $932 million, up from $639 million, largely reflecting the acquisition of Argon ST, Inc. for $782 million.
Financing Activities Cash used by financing activities totaled $1,962 million during 2010 compared with $4,094 million provided during 2009, primarily due to proceeds from borrowings of $5,961 million in 2009.
At December 31, 2010 and 2009, the recorded balance of debt was $12,421 million and $12,924 million, of which $948 million and $707 million were classified as short-term. This includes $3,446 million and $4,075 million of debt recorded at BCC, of which $801 million and $659 million were classified as short-term. In 2010, we repaid $689 million of debt, including repayments of $645 million of debt held at BCC.
In 2010, we had 494,939 shares transferred to us from employees for tax withholding and did not repurchase any shares through our open market share repurchase program. During 2009 and 2008, cash used in our open market share repurchase program totaled $50 million and $2,937 million. In 2008, we also repurchased shares for $95 million as part of the ShareValue Trust distribution.
Capital Resources We have substantial borrowing capacity. Any future borrowings may affect our credit ratings and are subject to various debt covenants as described below. We and BCC have commercial paper programs that continue to serve as significant potential sources of short-term liquidity. Throughout 2010 and at December 31, 2010, neither we nor BCC had any commercial paper borrowings outstanding. Currently, we have $4,376 million ($1,500 million exclusively available for BCC) of unused borrowing on revolving credit line agreements. We anticipate that these credit lines will primarily serve as backup liquidity to support possible commercial paper borrowings.
39
In the event we require additional funding to support strategic business opportunities, our commercial aircraft financing commitments, unfavorable resolution of litigation or other loss contingencies, or other business requirements, we expect to meet increased funding requirements by issuing commercial paper or term debt. We believe our ability to access external capital resources should be sufficient to satisfy existing short-term and long-term commitments and plans, and also to provide adequate financial flexibility to take advantage of potential strategic business opportunities should they arise within the next year. However, there can be no assurance of the cost or availability of future borrowings, if any, under our commercial paper program, in the debt markets or our credit facilities.
At December 31, 2010 and 2009, our pension plans were $9,854 million and $6,356 million underfunded as measured under GAAP. On an ERISA basis our plans are more than 100% funded. In 2011, we expect to make discretionary contributions to our plans of approximately $500 million. Absent increases in interest rates and/or higher asset values, we may be required to make significant contributions to our pension plans in the future.
As of December 31, 2010, we were in compliance with the covenants for our debt and credit facilities. The most restrictive covenants include a limitation on mortgage debt and sale and leaseback transactions as a percentage of consolidated net tangible assets (as defined in the credit agreements), and a limitation on consolidated debt as a percentage of total capital (as defined). When considering debt covenants, we continue to have substantial borrowing capacity.
Contractual Obligations
The following table summarizes our known obligations to make future payments pursuant to certain contracts as of December 31, 2010, and the estimated timing thereof.
| (Dollars in millions) | Total | Less than 1 year | 1-3 years | 3-5 years | After 5 years | |||||||||||||||
Long-term debt (including current portion) | $ | 12,253 | $ | 876 | $ | 3,510 | $ | 2,103 | $ | 5,764 | ||||||||||
Interest on debt (1) | 6,990 | 622 | 1,025 | 773 | 4,570 | |||||||||||||||
Pension and other postretirement cash requirements | 20,638 | 632 | 1,622 | 6,643 | 11,741 | |||||||||||||||
Capital lease obligations | 190 | 63 | 97 | 30 | ||||||||||||||||
Operating lease obligations | 1,159 | 217 | 280 | 164 | 498 | |||||||||||||||
Purchase obligations not recorded on the Consolidated Statements of Financial Position | 104,775 | 34,572 | 40,197 | 20,442 | 9,564 | |||||||||||||||
Purchase obligations recorded on the Consolidated Statements of Financial Position | 12,676 | 12,345 | 331 | |||||||||||||||||
Total contractual obligations | $ | 158,681 | $ | 49,327 | $ | 47,062 | $ | 30,155 | $ | 32,137 | ||||||||||
| (1) | Includes interest on variable rate debt calculated based on interest rates at December 31, 2010. Variable rate debt was approximately 1% of our total debt at December 31, 2010. |
Pension and Other Postretirement Benefits Pension cash requirements are based on an estimate of our minimum funding requirements, pursuant to ERISA regulations, although we may make additional discretionary contributions. Estimates of other postretirement benefits are based on both our estimated future benefit payments and the estimated contributions to plans that are funded through trusts.
Purchase Obligations Purchase obligations represent contractual agreements to purchase goods or services that are legally binding; specify a fixed, minimum or range of quantities; specify a fixed, minimum, variable, or indexed price provision; and specify approximate timing of the transaction. Purchase obligations include amounts recorded as well as amounts that are not recorded on the
40
Consolidated Statements of Financial Position. Approximately 8% of the purchase obligations disclosed above are reimbursable to us pursuant to cost-type government contracts.
Purchase Obligations Not Recorded on the Consolidated Statements of Financial Position Production related purchase obligations not recorded on the Consolidated Statements of Financial Position include agreements for production goods, tooling costs, electricity and natural gas contracts, property, plant and equipment, and other miscellaneous production related obligations. The most significant obligation relates to inventory procurement contracts. We have entered into certain significant inventory procurement contracts that specify determinable prices and quantities, and long-term delivery timeframes. In addition, we purchase raw materials on behalf of our suppliers. These agreements require suppliers and vendors to be prepared to build and deliver items in sufficient time to meet our production schedules. The need for such arrangements with suppliers and vendors arises from the extended production planning horizon for many of our products. A significant portion of these inventory commitments is supported by firm contracts and/or has historically resulted in settlement through reimbursement from customers for penalty payments to the supplier should the customer not take delivery. These amounts are also included in our forecasts of costs for program and contract accounting. Some inventory procurement contracts may include escalation adjustments. In these limited cases, we have included our best estimate of the effect of the escalation adjustment in the amounts disclosed in the table above.
Purchase Obligations Recorded on the Consolidated Statements of Financial Position Purchase obligations recorded on the Consolidated Statements of Financial Position primarily include accounts payable and certain other liabilities including accrued compensation.
Industrial Participation Agreements We have entered into various industrial participation agreements with certain customers outside of the U.S. to facilitate economic flow back and/or technology transfer to their businesses or government agencies as the result of their procurement of goods and/or services from us. These commitments may be satisfied by our placement of direct work or vendor orders for supplies, opportunities to bid on supply contracts, transfer of technology or other forms of assistance. However, in certain cases, our commitments may be satisfied through other parties (such as our vendors) who purchase supplies from our non-U.S. customers. We do not commit to industrial participation agreements unless a contract for sale of our products or services is signed. In certain cases, penalties could be imposed if we do not meet our industrial participation commitments. During 2010, we incurred no such penalties. As of December 31, 2010, we have outstanding industrial participation agreements totaling $9.7 billion that extend through 2024. Purchase order commitments associated with industrial participation agreements are included in the table above. To be eligible for such a purchase order commitment from us, a foreign supplier must have sufficient capability to meet our requirements and must be competitive in cost, quality and schedule.
Income Tax Obligations As of December 31, 2010, our total liability for income taxes payable, including uncertain tax positions, was $499 million, of which $81 million we expect to pay in the next twelve months. We are not able to reasonably estimate the timing of future cash flows related to the remaining $418 million. Our income tax obligations are excluded from the table above. See Note 5 to our Consolidated Financial Statements.
41
Commercial Commitments
The following table summarizes our commercial commitments outstanding as of December 31, 2010.
| (Dollars in millions) | Total Amounts Committed/Maximum Amount of Loss | Less than 1 year | 1-3 Years | 4-5 years | After 5 years | |||||||||||||||
Standby letters of credit and surety bonds | $ | 7,599 | $ | 5,560 | $ | 1,542 | $ | 328 | $ | 169 | ||||||||||
Commercial aircraft financing commitments | 9,865 | 1,234 | 2,035 | 2,775 | 3,821 | |||||||||||||||
Total commercial commitments | $ | 17,464 | $ | 6,794 | $ | 3,577 | $ | 3,103 | $ | 3,990 | ||||||||||
Commercial aircraft financing commitments include commitments to provide financing related to aircraft on order, under option for deliveries or proposed as part of sales campaigns based on estimated earliest potential funding dates. Based on historical experience, we currently do not anticipate that all of these commitments will be exercised by our customers; however there can be no assurances that we will not be required to fund greater amounts than historically required. See Note 11 to our Consolidated Financial Statements.
Contingent Obligations
We have significant contingent obligations that arise in the ordinary course of business, which include the following:
Legal Various legal proceedings, claims and investigations are pending against us. Legal contingencies are discussed in Note 20 to our Consolidated Financial Statements, including our contesting the default termination of the A-12 aircraft, certain employment and benefits litigation, litigation/arbitration involving BSSI programs and civil securities litigation relating to disclosures concerning the 787 program.
Environmental Remediation We are involved with various environmental remediation activities and have recorded a liability of $721 million at December 31, 2010. For additional information, see Note 11 to our Consolidated Financial Statements.
Income Taxes We have recorded a net liability of $1,198 million at December 31, 2010 for uncertain tax positions. For further discussion of these contingencies, see Note 5 to our Consolidated Financial Statements.
Off-Balance Sheet Arrangements
We are a party to certain off-balance sheet arrangements including certain guarantees. For discussion of these arrangements, see Note 12 to our Consolidated Financial Statements.
Critical Accounting Policies
Contract Accounting
Contract accounting involves a judgmental process of estimating the total sales and costs for each contract, which results in the development of estimated cost of sales percentages. For each contract, the amount reported as cost of sales is determined by applying the estimated cost of sales percentage to the amount of revenue recognized.
42
Due to the size, duration and nature of many of our contracts, the estimation of total sales and costs through completion is complicated and subject to many variables. Total contract sales estimates are based on negotiated contract prices and quantities, modified by our assumptions regarding contract options, change orders, incentive and award provisions associated with technical performance, and price adjustment clauses (such as inflation or index-based clauses). The majority of these contracts are with the U.S. government. Generally the price is based on estimated cost to produce the product or service plus profit. Federal acquisition regulations provide guidance on the types of cost that will be reimbursed in establishing contract price. Total contract cost estimates are largely based on negotiated or estimated purchase contract terms, historical performance trends, business base and other economic projections. Factors that influence these estimates include inflationary trends, technical and schedule risk, internal and subcontractor performance trends, business volume assumptions, asset utilization, and anticipated labor agreements.
The development of cost of sales percentages involves procedures and personnel in all areas that provide financial or production information on the status of contracts. Estimates of each significant contract's sales and costs are reviewed and reassessed quarterly. Any changes in these estimates result in recognition of cumulative adjustments to the contract profit in the period in which changes are made.
Due to the significance of judgment in the estimation process described above, it is likely that materially different cost of sales amounts could be recorded if we used different assumptions or if the underlying circumstances were to change. Changes in underlying assumptions/estimates, supplier performance, or circumstances may adversely or positively affect financial performance in future periods. If the combined gross margin for all contracts in BDS for all of 2010 had been estimated to be higher or lower by 1%, it would have increased or decreased pre-tax income for the year by approximately $319 million. A number of our contracts are in a reach–forward loss position. Changes to estimated loss in future periods are recorded immediately in earnings.
Program Accounting
Program accounting requires the demonstrated ability to reliably estimate the relationship of sales to costs for the defined program accounting quantity. A program consists of the estimated number of units (accounting quantity) of a product to be produced in a continuing, long-term production effort for delivery under existing and anticipated contracts. The determination of the accounting quantity is limited by the ability to make reasonably dependable estimates of the revenue and cost of existing and anticipated contracts. For each program, the amount reported as cost of sales is determined by applying the estimated cost of sales percentage for the total remaining program to the amount of sales recognized for airplanes delivered and accepted by the customer.
Factors that must be estimated include program accounting quantity, sales price, labor and employee benefit costs, material costs, procured part costs, major component costs, overhead costs, program tooling costs, and routine warranty costs. Estimation of the accounting quantity for each program takes into account several factors that are indicative of the demand for the particular program, such as firm orders, letters of intent from prospective customers, and market studies. Total estimated program sales are determined by estimating the model mix and sales price for all unsold units within the accounting quantity, added together with the sales prices for all undelivered units under contract. The sales prices for all undelivered units within the accounting quantity include an escalation adjustment that is based on projected escalation rates, consistent with typical sales contract terms. Cost estimates are based largely on negotiated and anticipated contracts with suppliers, historical performance trends, and business base and other economic projections. Factors that influence these estimates include production rates, internal and subcontractor performance trends, customer and/or supplier claims or assertions, asset utilization, anticipated labor agreements, and inflationary trends.
43
To ensure reliability in our estimates, we employ a rigorous estimating process that is reviewed and updated on a quarterly basis. Changes in estimates are normally recognized on a prospective basis; when estimated costs to complete a program exceed estimated revenues from undelivered units in the accounting quantity, a loss provision is recorded in the current period for the estimated loss on all undelivered units in the accounting quantity.
The program method of accounting allocates tooling and production costs over the accounting quantity for each program. Because of the higher unit production costs experienced at the beginning of a new program and substantial investment required for initial tooling, new commercial aircraft programs, such as the 787 program, typically have lower margins than established programs.
Due to the significance of judgment in the estimation process described above, it is likely that materially different cost of sales amounts could be recorded if we used different assumptions, or if the underlying circumstances were to change. Changes in underlying assumptions/estimates, supplier performance, or circumstances may adversely or positively affect financial performance in future periods. If combined cost of sales percentages for commercial airplane programs, excluding the 747 and 787 programs, for all of 2010 had been estimated to be higher or lower by 1%, it would have increased or decreased pre-tax income for the year by approximately $261 million.
The 747 program is in a reach-forward loss position having recorded a total of $2,037 million of reach-forward losses in 2009 and 2008. Absent changes in the estimated revenues or costs, subsequent deliveries are recorded at zero margin. Reductions to the estimated loss in subsequent periods are spread over all undelivered units in the accounting quantity, whereas increases to the estimated loss are recorded immediately.
Our current assessment is that the 787 program does not have a reach-forward loss. The cumulative impacts of the production challenges, schedule delays and customer and supplier impacts have created significant pressure on revenue and cost estimates such that we expect to record zero margin on the initial deliveries. The scale and duration of the 787 program is such that relatively minor changes in assumptions or variables could have a material effect on our reported results in any period if the program is determined to have a reach-forward loss.
Aircraft Valuation
Allowance for Losses on Customer Financing Receivables The allowance for losses on customer financing receivables (valuation provision) is used to provide for potential impairment of customer financing receivables in the Consolidated Statements of Financial Position. The balance represents an estimate of probable but unconfirmed losses in the customer financing receivables portfolio. The estimate is based on various qualitative and quantitative factors, including historical loss experience, collateral values, and results of individual credit and collectibility reviews. The adequacy of the allowance is assessed quarterly.
Three primary factors influencing the level of our allowance are customer credit ratings, collateral values and default rates. If each customer's credit rating were upgraded or downgraded by one major rating category at December 31, 2010, the allowance would have decreased by $163 million or increased by $343 million. If the collateral values were 20% higher or lower at December 31, 2010, the allowance would have decreased by $94 million or increased by $72 million. If the cumulative default rates used for each rating category should increase or decrease 1%, the allowance would have increased or decreased by $7 million.
Impairment Review for Assets Under Operating Leases and Held for Re-Lease We evaluate for impairment assets under operating lease or assets held for re-lease when events or changes in
44
circumstances indicate that the expected undiscounted cash flow from the asset may be less than its carrying value. We use various assumptions when determining the expected undiscounted cash flow including the expected future lease rates, lease terms, residual value of the asset, periods in which the asset may be held in preparation for a follow-on lease, maintenance costs, remarketing costs and the remaining economic life of the asset.
When we determine that impairment is indicated for an asset, the amount of impairment expense recorded is the excess of the carrying value over the fair value of the asset.
Had future lease rates on assets evaluated for impairment been 10% lower, we estimate that we would have incurred additional impairment expense of $30 million for the year ended December 31, 2010.
Residual Values Equipment under operating leases and assets held for re-lease are carried at cost less accumulated depreciation and are depreciated to estimated residual value using the straight-line method over the period that we project we will hold the asset for lease. Estimates used in determining residual values significantly impact the amount and timing of depreciation expense for equipment under operating leases and assets held for re-lease. If the estimated residual values declined 20% at December 31, 2010, we estimate that we would have incurred additional impairment expense of $31 million for the year ended December 31, 2010, and a future cumulative pre-tax earnings reduction of approximately $132 million recognized over the remaining depreciable periods, of which approximately $30 million would be recognized in 2011.
Our investment in sales-type/finance leases includes future minimum lease payments receivable plus the estimated residual value of leased assets less unearned income. Declines in estimated residual value that are deemed other than temporary are recognized in the period in which the decline occurs. If the estimated residual values declined 20% at December 31, 2010, we estimate that we would have reduced pre-tax income by $50 million for the year ended December 31, 2010.
Goodwill and Indefinite-Lived Intangible Impairments
Goodwill and other acquired intangible assets with indefinite lives are not amortized but are annually tested for impairment, and when an event occurs or circumstances change such that it is reasonably possible that an impairment may exist. April 1 is our annual testing date. We test goodwill for impairment by first comparing the book value of net assets to the fair value of the related operations. If the fair value is determined to be less than book value, a second step is performed to compute the amount of the impairment. In this process, a fair value for goodwill is estimated, based in part on the fair value of the operations, and is compared to its carrying value. The shortfall of the fair value below carrying value represents the amount of goodwill impairment.
We estimate the fair values of the related operations using discounted cash flows. Forecasts of future cash flows are based on our best estimate of future sales and operating costs, based primarily on existing firm orders, expected future orders, contracts with suppliers, labor agreements, and general market conditions. Changes in these forecasts could significantly change the amount of impairment recorded, if any.
The cash flow forecasts are adjusted by an appropriate discount rate derived from our market capitalization plus a suitable control premium at the date of evaluation. Therefore, changes in the stock price may also affect the amount of impairment recorded, if any.
Changes in our forecasts or decreases in the value of our common stock could cause book values of certain operations to exceed their fair values which may result in goodwill impairment charges in future
45
periods. A 10% decrease in the estimated fair value of any of our operations would have no impact on the carrying value of goodwill.
As of December 31, 2010 and 2009, we had $499 million of indefinite-lived intangible assets related to the Jeppesen and Aviall brand and trade names acquired in business combinations. We test these intangibles for impairment by comparing their carrying value to current projections of discounted cash flows attributable to the brand and trade names. Any excess carrying value over the amount of discounted cash flows represents the amount of the impairment. A 10% decrease in the discounted cash flows would reduce the carrying value of these indefinite-lived intangible assets by less than $1 million.
Postretirement Plans
Almost all of our employees are covered by defined benefit pension plans with the exception of all nonunion and some union employees hired after December 31, 2008. We also have other postretirement benefits consisting principally of healthcare coverage for eligible retirees and qualifying dependents. Accounting rules require an annual measurement of our projected obligations and plan assets. These measurements are based upon several assumptions, including the discount rate, the expected long-term rate of asset return, and medical trend rate (rate of growth for medical costs). Future changes in assumptions or differences between actual and expected outcomes can significantly affect our future annual expense, projected benefit obligations and Shareholders' equity.
The following table shows the sensitivity of our pension and other postretirement benefit plan liabilities and net periodic cost to a 25 basis point change in the discount rate as of December 31, 2010.
| (Dollars in millions) | Change in discount rate Increase 25 bps | Change in discount rate Decrease 25 bps | ||||||
Pension plans | ||||||||
Projected benefit obligation | $ | (1,772 | ) | $ | 2,204 | |||
Net periodic pension cost | (185 | ) | 225 | |||||
Other postretirement benefit plans | ||||||||
Accumulated postretirement benefit obligation | (192 | ) | 228 | |||||
Net periodic postretirement benefit cost | (15 | ) | 17 | |||||
Pension expense is also sensitive to changes in the expected long-term rate of asset return. A decrease or increase of 25 basis points in the expected long-term rate of asset return would have increased or decreased 2010 net periodic pension expense by $123 million.
Differences between actual and expected returns can affect future year's pension cost. The asset balance used to calculate the expected return on pension plan assets is a calculated value that recognizes changes in the fair value of assets over a five year period. Despite investment gains during 2010 and 2009, the significant losses incurred during 2008 will cause 2011 net periodic pension cost to increase by approximately $1.0 billion and the portion recognized in earnings for 2011 to increase by approximately $650 million primarily due to amortization of actuarial losses. Absent increases in interest rates, higher asset values and/or higher contributions, net periodic pension cost will increase further in future years.
46
The assumed medical trend rates have a significant effect on the following year's expense, recorded liabilities and Shareholders' equity. The following table shows the sensitivity of our other postretirement benefit plan liabilities and net periodic cost to a 100 basis point change as of December 31, 2010.
| (Dollars in millions) | Change in medical trend rate Increase 100 bps | Change in medical trend rate Decrease 100 bps | ||||||
Other postretirement benefit plans | ||||||||
Accumulated postretirement benefit obligation | $ | 742 | $ | (654 | ) | |||
Net periodic postretirement benefit cost | 125 | (110 | ) | |||||
47
Item 7A. Quantitative and Qualitative Disclosures About Market Risk
Interest Rate Risk
We have financial instruments that are subject to interest rate risk, principally fixed-rate debt obligations, and customer financing assets and liabilities. Additionally, BCC uses interest rate swaps with certain debt obligations to manage exposure to interest rate changes. Exposure to this risk is managed by generally matching the profile of BCC's liabilities with that of BCC's assets in relation to amount and terms such as expected maturities and fixed versus floating interest rates. As of December 31, 2010, the impact over the next 12 months of a 100 basis point immediate and sustained rise in interest rates would be a $5 million increase to BCC's pre-tax earnings. For purposes of the foregoing sensitivity analysis, we assume that the level of our floating rate assets and debt (including the impact of derivatives) remain unchanged from year-end 2010 and that they are all subject to immediate re-pricing. Historically, we have not experienced material gains or losses on our investments or customer financing assets and liabilities due to interest rate changes.
Based on the portfolio of other Boeing fixed-rate debt, the unhedged exposure to interest rate risk is not material. The investors in our fixed-rate debt obligations do not generally have the right to demand we pay off these obligations prior to maturity. Therefore, exposure to interest rate risk is not believed to be material for our fixed-rate debt.
Foreign Currency Exchange Rate Risk
We are subject to foreign currency exchange rate risk relating to receipts from customers and payments to suppliers in foreign currencies. We use foreign currency forward and option contracts to hedge the price risk associated with firmly committed and forecasted foreign denominated payments and receipts related to our ongoing business. Foreign currency forward and option contracts are sensitive to changes in foreign currency exchange rates. At December 31, 2010, a 10% increase in the exchange rate in our portfolio of foreign currency contracts would have decreased our unrealized gains by $159 million and a 10% decrease in the exchange rate would have increased our unrealized gains by $173 million. At December 31, 2009, a 10% increase in the exchange rate in our portfolio of foreign currency contracts would have decreased our unrealized gains by $136 million and a 10% decrease in the exchange rate would have increased our unrealized gains by $150 million. Consistent with the use of these contracts to neutralize the effect of exchange rate fluctuations, such unrealized losses or gains would be offset by corresponding gains or losses, respectively, in the remeasurement of the underlying transactions being hedged. When taken together, these forward currency contracts and the offsetting underlying commitments do not create material market risk.
48
Item 8. Financial Statements and Supplementary Data
Index to the Consolidated Financial Statements
| Page | ||||
Consolidated Statements of Operations | 50 | |||
Consolidated Statements of Financial Position | 51 | |||
Consolidated Statements of Cash Flows | 52 | |||
Consolidated Statements of Equity | 53 | |||
Summary of Business Segment Data | 55 | |||
Note 1 – Summary of Significant Accounting Policies | 56 | |||
Note 2 – Acquisition | 66 | |||
Note 3 – Goodwill and Acquired Intangibles | 68 | |||
Note 4 – Earnings Per Share | 69 | |||
Note 5 – Income Taxes | 69 | |||
Note 6 – Accounts Receivable | 72 | |||
Note 7 – Inventories | 73 | |||
Note 8 – Customer Financing | 74 | |||
Note 9 – Property, Plant and Equipment | 76 | |||
Note 10 – Investments | 77 | |||
Note 11 – Liabilities, Commitments and Contingencies | 78 | |||
Note 12 – Arrangements with Off-Balance Sheet Risk | 81 | |||
Note 13 – Debt | 83 | |||
Note 14 – Postretirement Plans | 84 | |||
Note 15 – Share-Based Compensation and Other Compensation Arrangements | 92 | |||
Note 16 – Shareholders' Equity | 95 | |||
Note 17 – Derivative Financial Instruments | 96 | |||
Note 18 – Significant Group Concentrations of Risk | 98 | |||
Note 19 – Fair Value Measurements | 99 | |||
Note 20 – Legal Proceedings | 100 | |||
Note 21 – Segment Information | 104 | |||
Note 22 – Quarterly Financial Data (Unaudited) | 108 | |||
Reports of Independent Registered Public Accounting Firm | 109 | |||
49
The Boeing Company and Subsidiaries
Consolidated Statements of Operations
| (Dollars in millions, except per share data) | ||||||||||||
Years ended December 31, | 2010 | 2009 | 2008 | |||||||||
Sales of products | $ | 52,586 | $ | 57,032 | $ | 50,180 | ||||||
Sales of services | 11,720 | 11,249 | 10,729 | |||||||||
Total revenues | 64,306 | 68,281 | 60,909 | |||||||||
Cost of products | (42,194 | ) | (47,639 | ) | (41,662 | ) | ||||||
Cost of services | (9,489 | ) | (8,726 | ) | (8,467 | ) | ||||||
Boeing Capital Corporation interest expense | (160 | ) | (175 | ) | (223 | ) | ||||||
Total costs and expenses | (51,843 | ) | (56,540 | ) | (50,352 | ) | ||||||
| 12,463 | 11,741 | 10,557 | ||||||||||
Income from operating investments, net | 267 | 249 | 241 | |||||||||
General and administrative expense | (3,644 | ) | (3,364 | ) | (3,084 | ) | ||||||
Research and development expense, net | (4,121 | ) | (6,506 | ) | (3,768 | ) | ||||||
Gain/(loss) on dispositions, net | 6 | (24 | ) | 4 | ||||||||
Earnings from operations | 4,971 | 2,096 | 3,950 | |||||||||
Other income/(expense), net | 52 | (26 | ) | 247 | ||||||||
Interest and debt expense | (516 | ) | (339 | ) | (202 | ) | ||||||
Earnings before income taxes | 4,507 | 1,731 | 3,995 | |||||||||
Income tax expense | (1,196 | ) | (396 | ) | (1,341 | ) | ||||||
Net earnings from continuing operations | 3,311 | 1,335 | 2,654 | |||||||||
Net (loss)/gain on disposal of discontinued operations, net of taxes of $2, $13 and ($10) | (4 | ) | (23 | ) | 18 | |||||||
Net earnings | $ | 3,307 | $ | 1,312 | $ | 2,672 | ||||||
Basic earnings per share from continuing operations | $ | 4.50 | $ | 1.89 | $ | 3.68 | ||||||
Net (loss)/gain on disposal of discontinued operations, net of taxes | (0.01 | ) | (0.03 | ) | 0.02 | |||||||
Basic earnings per share | $ | 4.49 | $ | 1.86 | $ | 3.70 | ||||||
Diluted earnings per share from continuing operations | $ | 4.46 | $ | 1.87 | $ | 3.65 | ||||||
Net (loss)/gain on disposal of discontinued operations, net of taxes | (0.01 | ) | (0.03 | ) | 0.02 | |||||||
Diluted earnings per share | $ | 4.45 | $ | 1.84 | $ | 3.67 | ||||||
See notes to the consolidated financial statements on pages 55 – 108.
50
The Boeing Company and Subsidiaries
Consolidated Statements of Financial Position
| (Dollars in millions, except per share data) | ||||||||
| December 31, | 2010 | 2009 | ||||||
Assets | ||||||||
Cash and cash equivalents | $ | 5,359 | $ | 9,215 | ||||
Short-term and other investments | 5,158 | 2,008 | ||||||
Accounts receivable, net | 5,422 | 5,785 | ||||||
Current portion of customer financing, net | 285 | 368 | ||||||
Deferred income taxes | 31 | 966 | ||||||
Inventories, net of advances and progress billings | 24,317 | 16,933 | ||||||
Total current assets | 40,572 | 35,275 | ||||||
Customer financing, net | 4,395 | 5,466 | ||||||
Property, plant and equipment, net | 8,931 | 8,784 | ||||||
Goodwill | 4,937 | 4,319 | ||||||
Other acquired intangibles, net | 2,979 | 2,877 | ||||||
Deferred income taxes | 4,031 | 3,062 | ||||||
Investments | 1,111 | 1,030 | ||||||
Pension plan assets, net | 6 | 16 | ||||||
Other assets, net of accumulated amortization of $630 and $492 | 1,603 | 1,224 | ||||||
Total assets | $ | 68,565 | $ | 62,053 | ||||
Liabilities and equity | ||||||||
Accounts payable | $ | 7,715 | $ | 7,096 | ||||
Other accrued liabilities | 13,802 | 12,822 | ||||||
Advances and billings in excess of related costs | 12,323 | 12,076 | ||||||
Deferred income taxes and income taxes payable | 607 | 182 | ||||||
Short-term debt and current portion of long-term debt | 948 | 707 | ||||||
Total current liabilities | 35,395 | 32,883 | ||||||
Accrued retiree health care | 8,025 | 7,049 | ||||||
Accrued pension plan liability, net | 9,800 | 6,315 | ||||||
Non-current income taxes payable | 418 | 827 | ||||||
Other long-term liabilities | 592 | 537 | ||||||
Long-term debt | 11,473 | 12,217 | ||||||
Shareholders' equity: | ||||||||
Common stock, par value $5.00 – 1,012,261,159 shares issued | 5,061 | 5,061 | ||||||
Additional paid-in capital | 3,866 | 3,724 | ||||||
Treasury stock, at cost | (17,187 | ) | (15,911 | ) | ||||
Retained earnings | 24,784 | 22,746 | ||||||
Accumulated other comprehensive loss | (13,758 | ) | (11,877 | ) | ||||
ShareValue Trust | (1,615 | ) | ||||||
Total shareholders' equity | 2,766 | 2,128 | ||||||
Noncontrolling interest | 96 | 97 | ||||||
Total equity | 2,862 | 2,225 | ||||||
Total liabilities and equity | $ | 68,565 | $ | 62,053 | ||||
See notes to the consolidated financial statements on pages 55 – 108.
51
The Boeing Company and Subsidiaries
Consolidated Statements of Cash Flows
| (Dollars in millions) | ||||||||||||
| Years ended December 31, | 2010 | 2009 | 2008 | |||||||||
Cash flows – operating activities: | ||||||||||||
Net earnings | $ | 3,307 | $ | 1,312 | $ | 2,672 | ||||||
Adjustments to reconcile net earnings to net cash provided/(used)by operating activities: | ||||||||||||
Non-cash items – | ||||||||||||
Share-based plans expense | 215 | 238 | 209 | |||||||||
Depreciation | 1,510 | 1,459 | 1,325 | |||||||||
Amortization of other acquired intangibles | 217 | 207 | 166 | |||||||||
Amortization of debt discount/premium and issuance costs | 19 | 12 | 11 | |||||||||
Investment/asset impairment charges, net | 174 | 151 | 50 | |||||||||
Customer financing valuation provision | 51 | 45 | 84 | |||||||||
Loss on disposal of discontinued operations | 6 | 36 | (28 | ) | ||||||||
(Gain)/loss on dispositions, net | (6 | ) | 24 | (4 | ) | |||||||
Other charges and credits, net | 512 | 214 | 116 | |||||||||
Excess tax benefits from share-based payment arrangements | (19 | ) | (5 | ) | (100 | ) | ||||||
Changes in assets and liabilities – | ||||||||||||
Accounts receivable | 8 | (391 | ) | 564 | ||||||||
Inventories, net of advances and progress billings | (7,387 | ) | (1,525 | ) | (6,168 | ) | ||||||
Accounts payable | 313 | 1,141 | 318 | |||||||||
Other accrued liabilities | 668 | 1,327 | 554 | |||||||||
Advances and billings in excess of related costs | 238 | (680 | ) | (1,120 | ) | |||||||
Income taxes receivable, payable and deferred | 822 | 607 | 744 | |||||||||
Other long-term liabilities | 328 | (12 | ) | (211 | ) | |||||||
Pension and other postretirement plans | 1,335 | 1,140 | 14 | |||||||||
Customer financing, net | 717 | 104 | 432 | |||||||||
Other | (76 | ) | 199 | (29 | ) | |||||||
Net cash provided/(used) by operating activities | 2,952 | 5,603 | (401 | ) | ||||||||
Cash flows – investing activities: | ||||||||||||
Property, plant and equipment additions | (1,125 | ) | (1,186 | ) | (1,674 | ) | ||||||
Property, plant and equipment reductions | 63 | 27 | 34 | |||||||||
Acquisitions, net of cash acquired | (932 | ) | (639 | ) | (964 | ) | ||||||
Contributions to investments | (15,548 | ) | (2,629 | ) | (6,673 | ) | ||||||
Proceeds from investments | 12,425 | 1,041 | 11,343 | |||||||||
Payments on Sea Launch guarantees | (448 | ) | ||||||||||
Reimbursement of Sea Launch guarantee payments | 82 | 40 | ||||||||||
Receipt of economic development program funds | 206 | |||||||||||
Purchase of distribution rights | (2 | ) | (178 | ) | ||||||||
Net cash (used)/provided by investing activities | (4,831 | ) | (3,794 | ) | 1,888 | |||||||
Cash flows – financing activities: | ||||||||||||
New borrowings | 41 | 5,961 | 13 | |||||||||
Debt repayments | (689 | ) | (551 | ) | (738 | ) | ||||||
Payments to noncontrolling interests | (40 | ) | ||||||||||
Repayments of distribution rights financing | (137 | ) | (357 | ) | ||||||||
Stock options exercised, other | 87 | 10 | 44 | |||||||||
Excess tax benefits from share-based payment arrangements | 19 | 5 | 100 | |||||||||
Employee taxes on certain share-based payment arrangements | (30 | ) | (21 | ) | (135 | ) | ||||||
Common shares repurchased | (50 | ) | (2,937 | ) | ||||||||
Dividends paid | (1,253 | ) | (1,220 | ) | (1,192 | ) | ||||||
Net cash (used)/provided by financing activities | (1,962 | ) | 4,094 | (5,202 | ) | |||||||
Effect of exchange rate changes on cash and cash equivalents | (15 | ) | 44 | (59 | ) | |||||||
Net (decrease)/increase in cash and cash equivalents | (3,856 | ) | 5,947 | (3,774 | ) | |||||||
Cash and cash equivalents at beginning of year | 9,215 | 3,268 | 7,042 | |||||||||
Cash and cash equivalents at end of year | $ | 5,359 | $ | 9,215 | $ | 3,268 | ||||||
See notes to the consolidated financial statements on pages 55 – 108.
52
The Boeing Company and Subsidiaries
Consolidated Statements of Equity
| Boeing shareholders | ||||||||||||||||||||||||||||||||
| (Dollars in millions, except per share data) | Common Stock | Additional Paid-In Capital | Treasury Stock | Share- Value Trust | Retained Earnings | Accumulated Other Comprehensive Loss | Non- controlling Interest | Total | ||||||||||||||||||||||||
Balance January 1, 2008 | $5,061 | $4,757 | ($14,842) | ($2,752) | $ | 21,376 | ($ | 4,596 | ) | $ | 74 | $ | 9,078 | |||||||||||||||||||
Net earnings | 2,672 | (2 | ) | 2,670 | ||||||||||||||||||||||||||||
Unrealized loss on derivative instruments, net of tax of $93 | (159 | ) | (159 | ) | ||||||||||||||||||||||||||||
Unrealized loss on certain investments, net of tax of $61 | (121 | ) | (121 | ) | ||||||||||||||||||||||||||||
Reclassification adjustment for losses realized in net earnings, net of tax of $(2) | 4 | 4 | ||||||||||||||||||||||||||||||
Currency translation adjustment | (180 | ) | (180 | ) | ||||||||||||||||||||||||||||
Postretirement liability adjustment, net of tax of $(4,883) | (8,565 | ) | (8,565 | ) | ||||||||||||||||||||||||||||
Comprehensive expense | (6,351 | ) | ||||||||||||||||||||||||||||||
Share-based compensation and related dividend equivalents | 243 | (8 | ) | 235 | ||||||||||||||||||||||||||||
ShareValue Trust activity | (1,540 | ) | 1,452 | (88 | ) | |||||||||||||||||||||||||||
Excess tax pools | 99 | 99 | ||||||||||||||||||||||||||||||
Treasury shares issued for stock options exercised, net | (9 | ) | 53 | 44 | ||||||||||||||||||||||||||||
Treasury shares issued for other share-based plans, net | (94 | ) | 65 | (29 | ) | |||||||||||||||||||||||||||
Treasury shares repurchased | (2,937 | ) | (2,937 | ) | ||||||||||||||||||||||||||||
Treasury shares transfer | (97 | ) | 97 | |||||||||||||||||||||||||||||
Cash dividends declared ($1.62 per share) | (1,187 | ) | (1,187 | ) | ||||||||||||||||||||||||||||
Postretirement transition amount, net of tax of $50 | (178 | ) | 92 | (86 | ) | |||||||||||||||||||||||||||
Changes in noncontrolling interest | 80 | 80 | ||||||||||||||||||||||||||||||
Balance December 31, 2008 | $5,061 | $3,456 | ($17,758) | ($1,203) | $ | 22,675 | ($ | 13,525 | ) | $ | 152 | ($ | 1,142 | ) | ||||||||||||||||||
Net earnings | 1,312 | 2 | 1,314 | |||||||||||||||||||||||||||||
Unrealized gain on derivative instruments, net of tax of $(92) | 159 | 159 | ||||||||||||||||||||||||||||||
Unrealized gain on certain investments, net of tax of $(18) | 30 | 30 | ||||||||||||||||||||||||||||||
Reclassification adjustment for losses realized in net earnings, net of tax of $(22) | 38 | 38 | ||||||||||||||||||||||||||||||
Currency translation adjustment | 154 | 154 | ||||||||||||||||||||||||||||||
Postretirement liability adjustment, net of tax of $(717) | 1,267 | 1,267 | ||||||||||||||||||||||||||||||
Comprehensive income | 2,962 | |||||||||||||||||||||||||||||||
Share-based compensation and related dividend equivalents | 243 | (8 | ) | 235 | ||||||||||||||||||||||||||||
ShareValue Trust activity | 412 | (412 | ) | |||||||||||||||||||||||||||||
Excess tax pools | (1 | ) | (1 | ) | ||||||||||||||||||||||||||||
Treasury shares issued for stock options exercised, net | (5 | ) | 15 | 10 | ||||||||||||||||||||||||||||
Treasury shares issued for other share-based plans, net | (80 | ) | 69 | (11 | ) | |||||||||||||||||||||||||||
Treasury shares repurchased | (50 | ) | (50 | ) | ||||||||||||||||||||||||||||
Cash dividends declared ($1.68 per share) | (1,233 | ) | (1,233 | ) | ||||||||||||||||||||||||||||
Treasury shares contributed to pension plans | (313 | ) | 1,813 | 1,500 | ||||||||||||||||||||||||||||
Changes in noncontrolling interest | 12 | (57 | ) | (45 | ) | |||||||||||||||||||||||||||
Balance December 31, 2009 | $5,061 | $ | 3,724 | ($15,911) | ($1,615) | $ | 22,746 | ($ | 11,877 | ) | $ | 97 | $ | 2,225 | ||||||||||||||||||
53
| Boeing shareholders | ||||||||||||||||||||||||||||||||
| (Dollars in millions, except per share data) | Common Stock | Additional Paid-In Capital | Treasury Stock | Share- Value Trust | Retained Earnings | Accumulated Other Comprehensive Loss | Non- controlling Interest | Total | ||||||||||||||||||||||||
Balance December 31, 2009 | $5,061 | $3,724 | ($15,911) | ($1,615) | $22,746 | ($11,877) | $97 | $2,225 | ||||||||||||||||||||||||
Net earnings | 3,307 | 1 | 3,308 | |||||||||||||||||||||||||||||
Unrealized gain on derivative instruments, net of tax of $(22) | 37 | 37 | ||||||||||||||||||||||||||||||
Reclassification adjustment for gains realized in net earnings, net of tax of $5 | (9 | ) | (9 | ) | ||||||||||||||||||||||||||||
Currency translation adjustment | 16 | 16 | ||||||||||||||||||||||||||||||
Postretirement liability adjustment, net of tax of $1,109 | (1,925 | ) | (1,925 | ) | ||||||||||||||||||||||||||||
Comprehensive income | 1,427 | |||||||||||||||||||||||||||||||
Share-based compensation and related dividend equivalents | 235 | (24 | ) | 211 | ||||||||||||||||||||||||||||
ShareValue Trust activity | 242 | (242 | ) | |||||||||||||||||||||||||||||
ShareValue Trust termination | (1,857 | ) | 1,857 | |||||||||||||||||||||||||||||
Excess tax pools | (234 | ) | (234 | ) | ||||||||||||||||||||||||||||
Treasury shares issued for stock options exercised, net | (45 | ) | 132 | 87 | ||||||||||||||||||||||||||||
Treasury shares issued for other share-based plans, net | (82 | ) | 60 | (22 | ) | |||||||||||||||||||||||||||
Treasury shares issued for 401(k) contribution | 26 | 389 | 415 | |||||||||||||||||||||||||||||
Cash dividends declared ($1.68 per share) | (1,245 | ) | (1,245 | ) | ||||||||||||||||||||||||||||
Changes in noncontrolling interest | (2 | ) | (2 | ) | ||||||||||||||||||||||||||||
Balance December 31, 2010 | $ | 5,061 | $ | 3,866 | ($ | 17,187 | ) | $ | 24,784 | ($ | 13,758 | ) | $ | 96 | $ | 2,862 | ||||||||||||||||
See notes to the consolidated financial statements on pages 55 – 108.
54
The Boeing Company and Subsidiaries
Notes to the Consolidated Financial Statements
Summary of Business Segment Data
| (Dollars in millions) | ||||||||||||
| Years ended December 31, | 2010 | 2009 | 2008 | |||||||||
Revenues: | ||||||||||||
Commercial Airplanes | $ | 31,834 | $ | 34,051 | $ | 28,263 | ||||||
Boeing Defense, Space & Security: | ||||||||||||
Boeing Military Aircraft | 14,238 | 14,304 | 13,445 | |||||||||
Network & Space Systems | 9,455 | 10,877 | 11,346 | |||||||||
Global Services & Support | 8,250 | 8,480 | 7,256 | |||||||||
Total Boeing Defense, Space & Security | 31,943 | 33,661 | 32,047 | |||||||||
Boeing Capital Corporation | 639 | 660 | 703 | |||||||||
Other segment | 138 | 165 | 567 | |||||||||
Unallocated items and eliminations | (248 | ) | (256 | ) | (671 | ) | ||||||
Total revenues | $ | 64,306 | $ | 68,281 | $ | 60,909 | ||||||
Earnings/(loss) from operations: | ||||||||||||
Commercial Airplanes | $ | 3,006 | $ | (583 | ) | $ | 1,186 | |||||
Boeing Defense, Space & Security: | ||||||||||||
Boeing Military Aircraft | 1,258 | 1,528 | 1,294 | |||||||||
Network & Space Systems | 711 | 839 | 1,034 | |||||||||
Global Services & Support | 906 | 932 | 904 | |||||||||
Total Boeing Defense, Space & Security | 2,875 | 3,299 | 3,232 | |||||||||
Boeing Capital Corporation | 152 | 126 | 162 | |||||||||
Other segment | (327 | ) | (152 | ) | (307 | ) | ||||||
Unallocated items and eliminations | (735 | ) | (594 | ) | (323 | ) | ||||||
Earnings from operations | 4,971 | 2,096 | 3,950 | |||||||||
Other income/(expense), net | 52 | (26 | ) | 247 | ||||||||
Interest and debt expense | (516 | ) | (339 | ) | (202 | ) | ||||||
Earnings before income taxes | 4,507 | 1,731 | 3,995 | |||||||||
Income tax expense | (1,196 | ) | (396 | ) | (1,341 | ) | ||||||
Net earnings from continuing operations | 3,311 | 1,335 | 2,654 | |||||||||
Net (loss)/gain on disposal of discontinued operations, net of taxes of $2, $13 and ($10) | (4 | ) | (23 | ) | 18 | |||||||
Net earnings | $ | 3,307 | $ | 1,312 | $ | 2,672 | ||||||
This information is an integral part of the notes to the consolidated financial statements. See Note 21 for further segment results.
55
The Boeing Company and Subsidiaries
Notes to the Consolidated Financial Statements
Years ended December 31, 2010, 2009 and 2008
(Dollars in millions, except per share data)
Note 1 – Summary of Significant Accounting Policies
Principles of Consolidation and Basis of Presentation
The Consolidated Financial Statements included in this report have been prepared by management of The Boeing Company (herein referred to as "Boeing," the "Company," "we," "us," or "our"). These statements include the accounts of all majority-owned subsidiaries and variable interest entities that are required to be consolidated. All significant intercompany accounts and transactions have been eliminated. Certain amounts have been reclassified to conform to the current year presentation.
Use of Estimates
Management makes assumptions and estimates to prepare financial statements in conformity with accounting principles generally accepted in the United States of America. Those assumptions and estimates directly affect the amounts reported in the Consolidated Financial Statements. Significant estimates for which changes in the near term are considered reasonably possible and that may have a material impact on the financial statements are disclosed in these notes to the Consolidated Financial Statements.
Operating Cycle
For classification of certain current assets and liabilities, we use the duration of the related contract or program as our operating cycle, which is generally longer than one year and could exceed three years.
Revenue and Related Cost Recognition
Contract Accounting Contract accounting is used for development and production activities predominantly by Boeing Defense, Space & Security (BDS). The majority of business conducted by BDS is performed under contracts with the U.S. government and other customers that extend over several years. Contract accounting involves a judgmental process of estimating the total sales and costs for each contract resulting in the development of estimated cost of sales percentages. For each contract, the amount reported as cost of sales is determined by applying the estimated cost of sales percentage to the amount of revenue recognized.
We combine contracts for accounting purposes when they are negotiated as a package with an overall profit margin objective, essentially represent an agreement to do a single project for a single customer, involve interrelated construction activities with substantial common costs, and are performed concurrently or sequentially. When a group of contracts is combined, revenue and profit are earned uniformly over the performance of the combined contracts.
Sales related to fixed-price contracts are recognized as deliveries are made, except for certain fixed-price contracts that require substantial performance over an extended period before deliveries begin, for which sales are recorded based on the attainment of performance milestones. Sales related to contracts in which we are reimbursed for costs incurred plus an agreed upon profit are recorded as costs are incurred. The Federal Acquisition Regulations provide guidance on the types of cost that will be reimbursed in establishing contract price. Contracts may contain provisions to earn incentive and award fees if specified targets are achieved. Incentive and award fees that can be reasonably estimated and are probable are recorded over the performance period of the contract. Incentive and award fees that cannot be reasonably estimated are recorded when awarded.
56
Program Accounting Our Commercial Airplanes segment predominantly uses program accounting to account for cost of sales related to its programs. Program accounting is applicable to products manufactured for delivery under production-type contracts where profitability is realized over multiple contracts and years. Under program accounting, inventoriable production costs, program tooling costs, and routine warranty costs are accumulated and charged to cost of sales by program instead of by individual units or contracts. A program consists of the estimated number of units (accounting quantity) of a product to be produced in a continuing, long-term production effort for delivery under existing and anticipated contracts. The determination of the accounting quantity is limited by the ability to make reasonably dependable estimates of the revenue and cost of existing and anticipated contracts. To establish the relationship of sales to cost of sales, program accounting requires estimates of (a) the number of units to be produced and sold in a program, (b) the period over which the units can reasonably be expected to be produced, and (c) the units' expected sales prices, production costs, program tooling, and routine warranty costs for the total program.
We recognize sales for commercial airplane deliveries as each unit is completed and accepted by the customer. Sales recognized represent the price negotiated with the customer, adjusted by an escalation formula as specified in the customer agreement. The amount reported as cost of sales is determined by applying the estimated cost of sales percentage for the total remaining program to the amount of sales recognized for airplanes delivered and accepted by the customer.
Concession Sharing Arrangements We account for sales concessions to our customers in consideration of their purchase of products and services as a reduction to revenue when the related products and services are delivered. The sales concessions incurred may be partially reimbursed by certain suppliers in accordance with concession sharing arrangements. We record these reimbursements, which are presumed to represent reductions in the price of the vendor's products or services, as a reduction in Cost of products.
Spare Parts Revenue We recognize sales of spare parts upon delivery and the amount reported as cost of sales is recorded at average cost.
Service Revenue Service revenue is recognized when the service is performed with the exception of U.S. government service agreements, which are accounted for using contract accounting. Service activities primarily include: support agreements associated with military aircraft and helicopter contracts, ongoing maintenance of International Space Station and Space Shuttle, commercial Delta launches and technical and flight operation services for commercial aircraft. Service revenue and associated cost of sales from pay-in-advance subscription fees are deferred and recognized as services are rendered.
Financial Services Revenue We record financial services revenue associated with sales-type finance leases, operating leases, and notes receivable.
Lease and financing revenue arrangements are included in Sales of services on the Consolidated Statements of Operations. For sales-type finance leases, we record an asset at lease inception. This asset is recorded at the aggregate future minimum lease payments, estimated residual value of the leased equipment, and deferred incremental direct costs less unearned income. Income is recognized over the life of the lease to approximate a level rate of return on the net investment. Residual values, which are reviewed periodically, represent the estimated amount we expect to receive at lease termination from the disposition of the leased equipment. Actual residual values realized could differ from these estimates. Declines in estimated residual value that are deemed other-than-temporary are recognized as Cost of services in the period in which the declines occur.
57
For operating leases, revenue on leased aircraft and equipment is recorded on a straight-line basis over the term of the lease. Operating lease assets, included in Customer financing, are recorded at cost and depreciated over the period that we project we will hold the asset to an estimated residual value, using the straight-line method. Prepayments received on operating lease contracts are classified as Other long-term liabilities on the Consolidated Statements of Financial Position. We periodically review our estimates of residual value and recognize forecasted changes by prospectively adjusting depreciation expense.
For notes receivable, notes are recorded net of any unamortized discounts and deferred incremental direct costs. Interest income and amortization of any discounts are recorded ratably over the related term of the note.
Reinsurance Revenue Our wholly-owned insurance subsidiary, Astro Ltd., participates in a reinsurance pool for workers' compensation. The member agreements and practices of the reinsurance pool minimize any participating members' individual risk. Reinsurance revenues were $139, $122 and $83 during 2010, 2009 and 2008, respectively. Reinsurance costs related to premiums and claims paid to the reinsurance pool were $123, $118 and $86 during 2010, 2009 and 2008, respectively. Revenues and costs are presented net in Cost of services in the Consolidated Statements of Operations.
Fleet Support
We provide assistance and services to facilitate efficient and safe aircraft operation to the operators of all our commercial airplane models. Collectively known as fleet support services, these activities and services include flight and maintenance training, field service support, engineering services, and technical data and documents. Fleet support activity begins prior to aircraft delivery as the customer receives training, manuals, and technical consulting support. This activity continues throughout the aircraft's operational life. Services provided after delivery include field service support, consulting on maintenance, repair, and operational issues brought forth by the customer or regulators, updating manuals and engineering data, and the issuance of service bulletins that impact the entire model's fleet. Field service support involves our personnel located at customer facilities providing and coordinating fleet support activities and requests. The costs for fleet support are expensed as incurred as Cost of services.
Research and Development
Research and development includes costs incurred for experimentation, design, testing, and bid and proposal efforts related to government products and services which are expensed as incurred unless the costs are related to certain contractual arrangements with customers. Costs that are incurred pursuant to such contractual arrangements are recorded over the period that revenue is recognized, consistent with our contract accounting policy. We have certain research and development arrangements that meet the requirement for best efforts research and development accounting. Accordingly, the amounts funded by the customer are recognized as an offset to our research and development expense rather than as contract revenues.
We have established cost sharing arrangements with some suppliers for the 787 program. Our cost sharing arrangements state that the supplier contributions are for reimbursements of costs we incur for experimentation, basic design, and testing activities during the 787 development. In each arrangement, we retain substantial rights to the 787 part or component covered by the arrangement. The amounts received from these cost sharing arrangements are recorded as a reduction to research and development expenses since we have no obligation to refund any amounts received per the arrangements regardless of the outcome of the development efforts. Specifically, under the terms of each agreement, payments received from suppliers for their share of the costs are typically based on
58
milestones and are recognized as earned when we achieve the milestone events and no ongoing obligation on our part exists. In the event we receive a milestone payment prior to the completion of the milestone, the amount is classified in Other accrued liabilities until earned.
Share-Based Compensation
We provide various forms of share-based compensation to our employees. For awards settled in shares, we measure compensation expense based on the grant-date fair value net of estimated forfeitures. For awards settled in cash, or that may be settled in cash, we measure compensation expense based on the fair value at each reporting date net of estimated forfeitures. The expense is recognized over the requisite service period, which is generally the vesting period of the award.
Income Taxes
Provisions for federal, state, and non-U.S. income taxes are calculated on reported Earnings before income taxes based on current tax law and also include, in the current period, the cumulative effect of any changes in tax rates from those used previously in determining deferred tax assets and liabilities. Such provisions differ from the amounts currently receivable or payable because certain items of income and expense are recognized in different time periods for financial reporting purposes than for income tax purposes. Significant judgment is required in determining income tax provisions and evaluating tax positions.
The accounting for uncertainty in income taxes requires a more-likely-than-not threshold for financial statement recognition and measurement of tax positions taken or expected to be taken in a tax return. We record a liability for the difference between the benefit recognized and measured for financial statement purposes and the tax position taken or expected to be taken on our tax return. To the extent that our assessment of such tax positions changes, the change in estimate is recorded in the period in which the determination is made. Tax-related interest and penalties are classified as a component of Income tax expense.
Postretirement Plans
Almost all of our employees are covered by defined benefit pension plans with the exception of all nonunion and some union employees hired after December 31, 2008. We also provide postretirement benefit plans other than pensions, consisting principally of health care coverage to eligible retirees and qualifying dependents. Benefits under the pension and other postretirement benefit plans are generally based on age at retirement and years of service and, for some pension plans, benefits are also based on the employee's annual earnings. The net periodic cost of our pension and other postretirement plans is determined using the projected unit credit method and several actuarial assumptions, the most significant of which are the discount rate, the long-term rate of asset return, and medical trend (rate of growth for medical costs). A portion of net periodic pension and other postretirement income or expense is not recognized in net earnings in the year incurred because it is allocated to production as product costs, and reflected in inventory at the end of a reporting period. If gains and losses, which occur when actual experience differs from actuarial assumptions, exceed ten percent of the greater of plan assets or plan liabilities we amortize them over the average future service period of employees. The funded status of our pension and postretirement plans is reflected on the Consolidated Statements of Financial Position. Effective December 31, 2008, accounting standards required us to measure our plan assets and benefit obligations at December 31, the date of our year end. We previously performed this measurement at September 30 of each year.
59
Postemployment Plans
We record a liability for postemployment benefits, such as severance or job training, when payment is probable, the amount is reasonably estimable, and the obligation relates to rights that have vested or accumulated.
Environmental Remediation
We are subject to federal and state requirements for protection of the environment, including those for discharge of hazardous materials and remediation of contaminated sites. We routinely assess, based on in-depth studies, expert analyses and legal reviews, our contingencies, obligations, and commitments for remediation of contaminated sites, including assessments of ranges and probabilities of recoveries from other responsible parties and/or insurance carriers. Our policy is to accrue and charge to current expense identified exposures related to environmental remediation sites based on our best estimate or the low end of a range of reasonably possible exposure for investigation, cleanup, and monitoring costs to be incurred. Estimated remediation costs are not discounted to present value as the timing of payments cannot be reasonably estimated. We may be able to recover a portion of the remediation costs from insurers or other third parties. Such recoveries are recorded when realization of the claim for recovery is deemed probable.
Cash and Cash Equivalents
Cash and cash equivalents consist of highly liquid instruments, such as commercial paper, time deposits, and other money market instruments, which have original maturities of three months or less. We aggregate our cash balances by bank, and reclassify any negative balances, consisting mainly of uncleared checks, to Accounts payable. Negative balances reclassified to Accounts payable were $209 and $211 at December 31, 2010 and 2009.
Inventories
Inventoried costs on commercial aircraft programs and long-term contracts include direct engineering, production and tooling costs, and applicable overhead, which includes fringe benefits, production related indirect and plant management salaries and plant services, not in excess of estimated net realizable value. To the extent a material amount of such costs are related to an abnormal event or are fixed costs not appropriately attributable to our programs or contracts, they are expensed in the current period rather than inventoried. Inventoried costs include amounts relating to programs and contracts with long-term production cycles, a portion of which is not expected to be realized within one year. Included in inventory for federal government contracts is an allocation of allowable costs related to manufacturing process reengineering.
Because of the higher unit production costs experienced at the beginning of a new or derivative commercial airplane program, the actual costs incurred for production of the early units in the program may exceed the amount reported as cost of sales for those units. In addition, the application of a total program gross profit rate to delivered units may result in costs assigned to delivered units in a reporting period being less than the actual cost of those units. The excess actual costs incurred over the amount reported as cost of sales is disclosed as deferred production costs, which are included in inventory along with unamortized tooling costs.
The determination of net realizable value of long-term contract costs is based upon quarterly reviews that estimate costs to be incurred to complete all contract requirements. When actual contract costs and the estimate to complete exceed total estimated contract revenues, a loss provision is recorded. The determination of net realizable value of commercial aircraft program costs is based upon quarterly program reviews that estimate revenue and cost to be incurred to complete the program accounting
60
quantity. When estimated costs to complete exceed estimated program revenues to go, a program loss provision is recorded in the current period for the estimated loss on all undelivered units in the accounting quantity.
Used aircraft purchased by the Commercial Airplanes segment and general stock materials are stated at cost not in excess of net realizable value. See ‘Aircraft Valuation' within this Note for a discussion of our valuation of used aircraft. Spare parts inventory is stated at lower of average unit cost or market. We review our commercial spare parts and general stock materials quarterly to identify impaired inventory, including excess or obsolete inventory, based on historical sales trends, expected production usage, and the size and age of the aircraft fleet using the part. Impaired inventories are charged to Cost of products in the period the impairment occurs.
Included in inventory for commercial aircraft programs are amounts paid or credited in cash, or other consideration to certain airline customers, that are referred to as early issue sales consideration. Early issue sales consideration is recognized as a reduction to revenue when the delivery of the aircraft under contract occurs. If an airline customer does not perform and take delivery of the contracted aircraft, we believe that we would have the ability to recover amounts paid. However, to the extent early issue sales consideration exceeds advances and is not considered to be otherwise recoverable, it would be written off in the current period.
We net advances and progress billings on long-term contracts against inventory in the Consolidated Statements of Financial Position. Advances and progress billings in excess of related inventory are reported in Advances and billings in excess of related costs.
Precontract Costs
We may, from time to time, incur costs to begin fulfilling the statement of work under a specific anticipated contract that we are still negotiating with a customer. If we determine it is probable that we will be awarded the specific anticipated contract, then we capitalize the precontract costs we incur, excluding start-up costs which are expensed as incurred. Capitalized precontract costs of $527 and $183 at December 31, 2010 and 2009, are included in Inventories, net of advances and progress billings, in the accompanying Consolidated Statements of Financial Position.
Property, Plant and Equipment
Property, plant and equipment are recorded at cost, including applicable construction-period interest, less accumulated depreciation and are depreciated principally over the following estimated useful lives: new buildings and land improvements, from 10 to 40 years; and new machinery and equipment, from 3 to 20 years. The principal methods of depreciation are as follows: buildings and land improvements, 150% declining balance; and machinery and equipment, sum-of-the-years' digits. Capitalized internal use software is included in Other assets and amortized using the straight line method over five years. We periodically evaluate the appropriateness of remaining depreciable lives assigned to long-lived assets, including assets that may be subject to a management plan for disposition.
Long-lived assets held for sale are stated at the lower of cost or fair value less cost to sell. Long-lived assets held for use are subject to an impairment assessment whenever events or changes in circumstances indicate that the carrying amount may not be recoverable. If the carrying value is no longer recoverable based upon the undiscounted future cash flows of the asset, the amount of the impairment is the difference between the carrying amount and the fair value of the asset.
61
Asset Retirement Obligations
We record all known asset retirement obligations for which the liability's fair value can be reasonably estimated, including certain asbestos removal, asset decommissioning and contractual lease restoration obligations. Recorded amounts are not material.
We also have known conditional asset retirement obligations, such as certain asbestos remediation and asset decommissioning activities to be performed in the future, that are not reasonably estimable due to insufficient information about the timing and method of settlement of the obligation. Accordingly, these obligations have not been recorded in the Consolidated Financial Statements. A liability for these obligations will be recorded in the period when sufficient information regarding timing and method of settlement becomes available to make a reasonable estimate of the liability's fair value. In addition, there may be conditional asset retirement obligations that we have not yet discovered (e.g. asbestos may exist in certain buildings but we have not become aware of it through the normal course of business), and therefore, these obligations also have not been included in the Consolidated Financial Statements.
Goodwill and Other Acquired Intangibles
Goodwill and other acquired intangible assets with indefinite lives are not amortized, but are tested for impairment annually and when an event occurs or circumstances change such that it is more likely than not that an impairment may exist. Our annual testing date is April 1.
We test goodwill for impairment by first comparing the carrying value of net assets to the fair value of the related operations. If the fair value is determined to be less than carrying value, a second step is performed to compute the amount of the impairment. In this process, a fair value for goodwill is estimated, based in part on the fair value of the operations, and is compared to its carrying value. The shortfall of the fair value below carrying value represents the amount of goodwill impairment.
Indefinite-lived intangibles consist of brand and trade names acquired in business combinations. We test these intangibles for impairment by comparing their carrying value to current projections of discounted cash flows attributable to the brand and trade names. Any excess carrying value over the amount of discounted cash flows represents the amount of the impairment.
Our finite-lived acquired intangible assets are amortized on a straight-line basis over their estimated useful lives as follows: developed technology, from 3 to 14 years; product know-how, from 3 to 30 years; customer base, from 3 to 19 years; distribution rights, from 9 to 30 years; and other, from 2 to 32 years. We evaluate the potential impairment of finite-lived acquired intangible assets whenever events or changes in circumstances indicate that the carrying amount may not be recoverable. If the carrying value is no longer recoverable based upon the undiscounted future cash flows of the asset, the amount of the impairment is the difference between the carrying amount and the fair value of the asset.
Investments
We classify investment securities as either held-to-maturity or available-for-sale. Held-to-maturity securities include time deposits and are carried at cost.
Available-for-sale securities include marketable debt and equity securities and Enhanced Equipment Trust Certificates and are recorded at their fair values, with unrealized gains and losses reported as part of Accumulated other comprehensive loss on the Consolidated Statements of Financial Position. Realized gains and losses on marketable securities are recognized based on the cost of securities
62
using the first-in, first-out method. Realized gains and losses on all other available-for-sale securities are recognized based on specific identification. Available-for-sale securities are assessed for impairment quarterly.
The equity method of accounting is used to account for investments for which we have the ability to exercise significant influence, but not control, over an investee. Significant influence is generally deemed to exist if we have an ownership interest in the voting stock of an investee of between 20% and 50%.
We classify investment income and loss on our Consolidated Statements of Operations based on whether the investment is operating or non-operating in nature. Operating investments align strategically and are integrated with our operations. Earnings from operating investments, including our share of income or loss from equity method investments, dividend income from certain cost method investments, and any impairments or gain/loss on the disposition of these investments, are recorded in Income from operating investments, net. Non-operating investments are those we hold for non-strategic purposes. Earnings from non-operating investments, including interest and dividends on marketable securities, and any impairments or gain/loss on the disposition of these investments are recorded in Other income/(expense), net.
Derivatives
All derivative instruments are recognized in the financial statements and measured at fair value regardless of the purpose or intent of holding them. We use derivative instruments to principally manage a variety of market risks. For derivatives designated as hedges of the exposure to changes in fair value of the recognized asset or liability or a firm commitment (referred to as fair value hedges), the gain or loss is recognized in earnings in the period of change together with the offsetting loss or gain on the hedged item attributable to the risk being hedged. The effect of that accounting is to include in earnings the extent to which the hedge is not effective in achieving offsetting changes in fair value. For our cash flow hedges, the effective portion of the derivative's gain or loss is initially reported in Shareholders' equity (as a component of Accumulated other comprehensive loss) and is subsequently reclassified into earnings in the same period or periods during which the hedged forecasted transaction affects earnings. The ineffective portion of the gain or loss of a cash flow hedge is reported in earnings immediately. We also hold certain instruments for economic purposes that are not designated for hedge accounting treatment. For these derivative instruments, the changes in their fair value are also recorded in earnings immediately.
Aircraft Valuation
Used aircraft under trade-in commitments and aircraft under repurchase commitments In conjunction with signing a definitive agreement for the sale of new aircraft (Sale Aircraft), we have entered into specified-price trade-in commitments with certain customers that give them the right to trade in used aircraft upon the purchase of Sale Aircraft. Additionally, we have entered into contingent repurchase commitments with certain customers wherein we agree to repurchase the Sale Aircraft at a specified price, generally 10 to 15 years after delivery of the Sale Aircraft. Our repurchase of the Sale Aircraft is contingent upon a future, mutually acceptable agreement for the sale of additional new aircraft. If we execute an agreement for the sale of additional new aircraft, and if the customer exercises its right to sell the Sale Aircraft to us, a contingent repurchase commitment would become a trade-in commitment. Our historical experience is that no contingent repurchase agreements have become trade-in commitments.
63
All trade-in commitments at December 31, 2010 and 2009 were solely attributable to Sale Aircraft and did not originate from contingent repurchase agreements. Exposure related to trade-in commitments may take the form of:
| (1) | adjustments to revenue for the difference between the contractual trade-in price in the definitive agreement and our best estimate of the fair value of the trade-in aircraft as of the date of such agreement, which would be recorded in Inventory and recognized upon delivery of the Sale Aircraft, and/or |
| (2) | charges to cost of products for adverse changes in the fair value of trade-in aircraft that occur subsequent to signing of a definitive agreement for Sale Aircraft but prior to the purchase of the used trade-in aircraft. Estimates based on current aircraft values would be included in Other accrued liabilities. |
The fair value of trade-in aircraft is determined using aircraft-specific data such as model, age and condition, market conditions for specific aircraft and similar models, and multiple valuation sources. This process uses our assessment of the market for each trade-in aircraft, which in most instances begins years before the return of the aircraft. There are several possible markets in which we continually pursue opportunities to place used aircraft. These markets include, but are not limited to, the resale market, which could potentially include the cost of long-term storage; the leasing market, with the potential for refurbishment costs to meet the leasing customer's requirements; or the scrap market. Trade-in aircraft valuation varies significantly depending on which market we determine is most likely for each aircraft. On a quarterly basis, we update our valuation analysis based on the actual activities associated with placing each aircraft into a market. This quarterly valuation process yields results that are typically lower than residual value estimates by independent sources and tends to more accurately reflect results upon the actual placement of the aircraft.
Used aircraft acquired by the Commercial Airplanes segment are included in Inventories at the lower of cost or market as it is our intent to sell these assets. To mitigate costs and enhance marketability, aircraft may be placed on operating lease. While on operating lease, the assets are included in Customer financing.
Assets under operating lease, assets held for sale or re-lease and collateral underlying receivables Customer financing includes operating lease equipment, notes receivables, and sales-type/financing leases. Sales-type/financing leases are treated as receivables, and allowances for losses are established as necessary.
We assess the fair value of the assets we own, including equipment under operating leases, assets held for sale or re-lease, and collateral underlying receivables, to determine if their fair values are less than the related assets' carrying values. Differences between carrying values and fair values of finance leases and notes and other receivables, as determined by collateral value, are considered in determining the allowance for losses on receivables.
We use a median calculated from published collateral values from multiple third-party aircraft value publications based on the type and age of the aircraft to determine the fair value of aircraft. Under certain circumstances, we apply judgment based on the attributes of the specific aircraft or equipment, usually when the features or use of the aircraft vary significantly from the more generic aircraft attributes covered by outside publications.
Impairment review for assets under operating leases and held for sale or re-lease We evaluate for impairment assets under operating lease or assets held for sale or re-lease when events or changes in circumstances indicate that the expected undiscounted cash flow from the asset may be less than the carrying value. We use various assumptions when determining the expected
64
undiscounted cash flow, including our intentions for how long we will hold an asset subject to operating lease before it is sold, the expected future lease rates, lease terms, residual value of the asset, periods in which the asset may be held in preparation for a follow-on lease, maintenance costs, remarketing costs and the remaining economic life of the asset. We state assets held for sale at the lower of carrying value or fair value less costs to sell.
When we determine that impairment is indicated for an asset, the amount of impairment expense recorded is the excess of the carrying value over the fair value of the asset.
Allowance for losses on customer financing receivables We record the potential impairment of customer financing receivables in our portfolio in a valuation account, the balance of which is an accounting estimate of probable but unconfirmed losses in the receivables portfolio. The allowance for losses on receivables relates to two components of receivables: (a) specifically identified receivables that are evaluated individually for impairment and (b) all other receivables.
We determine a receivable is impaired when, based on current information and events, it is probable that we will be unable to collect amounts due according to the original contractual terms of the receivable agreement, without regard to any subsequent restructurings. Factors considered in assessing collectibility include, but are not limited to, a customer's extended delinquency, requests for restructuring and filings for bankruptcy. We determine a specific impairment allowance based on the difference between the carrying value of the receivable and the estimated fair value of the related collateral.
We review the adequacy of the allowance attributable to the remaining receivables (after excluding receivables subject to a specific impairment allowance) by assessing both the collateral exposure and the applicable cumulative default rate. Collateral exposure for a particular receivable is the excess of the carrying value of the receivable over the fair value of the related collateral. A receivable with an estimated fair value in excess of the carrying value is considered to have no collateral exposure. The applicable cumulative default rate is determined using two components: customer credit ratings and weighted average remaining contract term. Internally assigned credit ratings, our credit quality indicator, are determined for each customer in the portfolio. Those ratings are updated based upon public information and information obtained directly from our customers.
We have entered into agreements with certain customers that would entitle us to look beyond the specific collateral underlying the receivable for purposes of determining the collateral exposure as described above. Should the proceeds from the sale of the underlying collateral asset resulting from a default condition be insufficient to cover the carrying value of our receivable (creating a shortfall condition), these agreements would, for example, permit us to take the actions necessary to sell or retain certain other assets in which the customer has an equity interest and use the proceeds to cover the shortfall.
Each quarter we review customer credit ratings, published historical credit default rates for different rating categories, and multiple third-party aircraft value publications as a basis to validate the reasonableness of the allowance for losses on receivables. There can be no assurance that actual results will not differ from estimates or that the consideration of these factors in the future will not result in an increase or decrease to the allowance for losses on receivables.
Warranties
In conjunction with certain product sales, we provide warranties that cover factors such as non-conformance to specifications and defects in material and design. The majority of our warranties are issued by our Commercial Airplanes segment. Generally, aircraft sales are accompanied by a three
65
to four-year standard warranty for systems, accessories, equipment, parts, and software manufactured by us or manufactured to certain standards under our authorization. These warranties are included in the programs' estimate at completion. On occasion we have made commitments beyond the standard warranty obligation to correct fleet-wide major issues of a particular model, resulting in additional accrued warranty expense. Warranties issued by our BDS segments principally relate to sales of military aircraft and weapons hardware and are included in the contract cost estimates. These sales are generally accompanied by a six to twelve-month warranty period and cover systems, accessories, equipment, parts, and software manufactured by us to certain contractual specifications. Estimated costs related to standard warranties are recorded in the period in which the related product sales occur. The warranty liability recorded at each balance sheet date reflects the estimated number of months of warranty coverage outstanding for products delivered times the average of historical monthly warranty payments, as well as additional amounts for certain major warranty issues that exceed a normal claims level. Estimated costs of these additional warranty issues are considered changes to the initial liability estimate.
Supplier Penalties
We record an accrual for supplier penalties when an event occurs that makes it probable that a supplier penalty will be incurred and the amount is reasonably estimable. Until an event occurs, we fully anticipate accepting all products procured under production-related contracts.
Guarantees
We record a liability in Other accrued liabilities for the fair value of guarantees that are issued or modified after December 31, 2002. For a residual value guarantee where we received a cash premium, the liability is equal to the cash premium received at the guarantee's inception. For credit and performance guarantees, the liability is equal to the present value of the expected loss. We determine the expected loss by multiplying the creditor's default rate by the guarantee amount reduced by the expected recovery, if applicable, for each future period the credit or performance guarantee will be outstanding. If at inception of a guarantee, we determine there is a probable related contingent loss, we will recognize a liability for the greater of (a) the fair value of the guarantee as described above or (b) the probable contingent loss amount.
Note 2 – Acquisitions
Argon ST, Inc.
On August 5, 2010, we acquired Argon ST, Inc. (Argon) for $782, net of cash acquired. Argon develops command, control, communications, computers, intelligence, surveillance, and reconnaissance (C4ISR) and, combat systems. The acquisition is part of our strategy to expand our capabilities to address the C4ISR, cyber and intelligence markets. Argon's results of operations from the acquisition date are included in the Network & Space Systems (N&SS) segment. We also expect to generate synergies associated with the acquisition in other Boeing Defense, Space & Security business units. Goodwill has been recorded in N&SS, Global Services & Support (GS&S) and Boeing Military Aircraft (BMA) segments.
66
The final allocation of the purchase price is as follows:
Accounts receivable | $ | 66 | ||
Inventory | 47 | |||
Property, plant and equipment | 32 | |||
Goodwill | 549 | |||
Finite-lived intangible assets (1) | 216 | |||
Other assets | 1 | |||
Accounts payable | (14 | ) | ||
Other accrued liabilities | (69 | ) | ||
Advances and billings in excess of related costs | (8 | ) | ||
Deferred income taxes | (38 | ) | ||
Total net assets acquired | $ | 782 | ||
| (1) | Finite-lived intangible assets have a weighted average amortization period of 13 years and include $133 of Developed technology and $69 of Customer base. |
Vought Aircraft Industries Inc.
On July 30, 2009, we acquired the business, assets and operations of Vought Aircraft Industries, Inc.'s (Vought) 787 business conducted at North Charleston, South Carolina. In connection with the acquisition, we paid cash consideration of $590 and released Vought from its obligation to repay amounts of $416 previously advanced by us. Vought's 787 business produces aft fuselage sections, including the fabrication, assembly and systems installation, for the 787 program. The acquisition of Vought is intended to strengthen our 787 program and bolster our capability to develop and produce large composite structures. The results of operations from the acquisition date are included in our Commercial Airplanes' segment.
The final allocation of the purchase price is as follows:
Inventory | $ | 241 | ||
Property, plant and equipment | 170 | |||
Goodwill | 606 | |||
Finite-lived intangible assets (1) | 49 | |||
Accounts payable | (24 | ) | ||
Other accrued liabilities | (31 | ) | ||
Other long-term liabilities | (5 | ) | ||
Total net assets acquired | $ | 1,006 | ||
| (1) | The weighted average amortization period for finite-lived intangible assets is 17 years. |
67
Note 3 – Goodwill and Acquired Intangibles
Changes in the carrying amount of goodwill by reportable segment for the years ended December 31, 2010, 2009 and 2008 were as follows:
| Commercial Airplanes | Boeing Military Aircraft | Network & Space Systems | Global Services & Support | Total | ||||||||||||||||
Balance at January 1, 2008 | $1,400 | $ | 593 | $ | 883 | $205 | $3,081 | |||||||||||||
Acquisitions (1)(2) | 84 | 255 | 201 | 61 | 601 | |||||||||||||||
Goodwill adjustments | (35 | ) | (35) | |||||||||||||||||
Balance at December 31, 2008 (1) | $ | 1,449 | $ | 848 | $ | 1,084 | $ | 266 | $ | 3,647 | ||||||||||
Vought acquisition | 606 | 606 | ||||||||||||||||||
Goodwill adjustments | 28 | 18 | 20 | 66 | ||||||||||||||||
Balance at December 31, 2009 (1) | $ | 2,083 | $ | 848 | $ | 1,102 | $ | 286 | $ | 4,319 | ||||||||||
Argon acquisition | 193 | 345 | 11 | 549 | ||||||||||||||||
Other acquisitions | 18 | 14 | 4 | 36 | ||||||||||||||||
Goodwill adjustments | 9 | 24 | 33 | |||||||||||||||||
Balance at December 31, 2010 | $ | 2,110 | $ | 1,041 | $ | 1,461 | $ | 325 | $ | 4,937 | ||||||||||
| (1) | Effective January 1, 2010, certain programs were realigned among BDS segments. Prior year amounts have been recast for segment realignments. |
| (2) | During 2008, we completed nine acquisitions. |
As of December 31, 2010 and 2009, we had indefinite-lived intangible assets with carrying amounts of $499 relating to tradenames.
The gross carrying amounts and accumulated amortization of our acquired finite-lived intangible assets were as follows at December 31:
| 2010 | 2009 | |||||||||||||||
| Gross Carrying Amount | Accumulated Amortization | Gross Carrying Amount | Accumulated Amortization | |||||||||||||
Distribution rights | $ | 1,661 | $ | 211 | $ | 1,596 | $ | 140 | ||||||||
Product know-how | 499 | 116 | 333 | 98 | ||||||||||||
Customer base | 603 | 208 | 517 | 165 | ||||||||||||
Developed technology | 834 | 653 | 831 | 581 | ||||||||||||
Other | 193 | 122 | 198 | 113 | ||||||||||||
Total | $ | 3,790 | $ | 1,310 | $ | 3,475 | $ | 1,097 | ||||||||
Amortization expense for acquired finite-lived intangible assets for the years ended December 31, 2010 and 2009 was $217 and $207. Estimated amortization expense for the five succeeding years is as follows: 2011 – $192; 2012 – $190; 2013 – $170; 2014 – $156 and 2015 – $149.
Non-cash investing and financing transactions related to acquired finite-lived intangibles during 2010 and 2009 were $62 and $329. Total acquired finite-lived intangibles of $529 and $604 remain unpaid as of December 31, 2010 and 2009.
68
Note 4 – Earnings Per Share
The weighted-average number of shares outstanding used to compute earnings per share are as follows:
(Shares in millions) Years ended December 31, | 2010 | 2009 | 2008 | |||||||||
Weighted average shares outstanding | 735.0 | 705.9 | 719.9 | |||||||||
Participating securities | 3.1 | 3.7 | 2.9 | |||||||||
Basic weighted average shares outstanding | 738.1 | 709.6 | 722.8 | |||||||||
Dilutive potential common shares | 6.2 | 3.8 | 6.2 | |||||||||
Diluted weighted average shares outstanding | 744.3 | 713.4 | 729.0 | |||||||||
Basic earnings per share is calculated by the sum of (1) net earnings less declared dividends and dividend equivalents related to share-based compensation divided by the basic weighted average shares outstanding and (2) declared dividends and dividend equivalents related to share-based compensation divided by the weighted average shares outstanding.
The weighted average number of shares outstanding, included in the table below, were excluded from the computation of diluted earnings per share because the average market price did not exceed the exercise/threshold price. However, these shares may be dilutive potential common shares in the future.
(Shares in millions) Years ended December 31, | 2010 | 2009 | 2008 | |||||||||
Stock options | 14.9 | 16.8 | 14.9 | |||||||||
Performance Awards | 3.8 | 2.0 | 2.0 | |||||||||
ShareValue Trust | 13.2 | 12.7 | ||||||||||
Performance Shares | 0.8 | 0.7 | ||||||||||
Stock units | 0.2 | 0.3 | ||||||||||
Note 5 – Income Taxes
The components of earnings before income taxes were:
| Years ended December 31, | 2010 | 2009 | 2008 | |||||||||
U.S. | $ | 4,310 | $ | 1,638 | $ | 3,794 | ||||||
Non-U.S. | 197 | 93 | 201 | |||||||||
Total | $ | 4,507 | $ | 1,731 | $ | 3,995 | ||||||
Income tax expense/(benefit) consisted of the following:
| Years ended December 31, | 2010 | 2009 | 2008 | |||||||||
Current tax expense | ||||||||||||
U.S. federal | $ | 13 | $ | (132 | ) | $ | 44 | |||||
Non-U.S. | 80 | 69 | 29 | |||||||||
U.S. state | (137 | ) | 145 | 20 | ||||||||
Total current | (44 | ) | 82 | 93 | ||||||||
Deferred tax expense | ||||||||||||
U.S. federal | 969 | 457 | 1,151 | |||||||||
Non-U.S. | (13 | ) | (55 | ) | 26 | |||||||
U.S. state | 284 | (88 | ) | 71 | ||||||||
Total deferred | 1,240 | 314 | 1,248 | |||||||||
Total income tax expense | $ | 1,196 | $ | 396 | $ | 1,341 | ||||||
69
Net income tax payments/(refunds) were $360, ($198) and $599 in 2010, 2009 and 2008, respectively.
Our effective income tax rate was 26.5%, 22.9% and 33.6% for the years ended December 31, 2010, 2009 and 2008, respectively. Our effective tax rate was higher in 2010, than 2009, primarily because pre-tax book income in 2010 was higher than in 2009 and because of an income tax charge of $150 recorded during the first quarter of 2010 as a result of the Patient Protection and Affordable Care Act, as modified by the Health Care and Education Reconciliation Act of 2010. This was partially offset by a tax benefit of $371 recorded during the fourth quarter of 2010 as a result of settling the 1998-2003 federal audit. Our effective tax rate was lower in 2009, than 2008, primarily because tax credits such as research and development credits represented a higher proportion of earnings before taxes due to the year-over-year reduction in earnings. The following is a reconciliation of the U.S. federal statutory tax rate of 35% to our effective income tax rate:
| Years ended December 31, | 2010 | 2009 | 2008 | |||||||||
U.S. federal statutory tax | 35.0 | % | 35.0 | % | 35.0 | % | ||||||
Research and development credits | (3.5 | ) | (10.1 | ) | (4.3 | ) | ||||||
Tax on international activities | (1.2 | ) | (2.4 | ) | (0.7 | ) | ||||||
Tax deductible dividends | (0.9 | ) | (2.2 | ) | (0.8 | ) | ||||||
State income tax provision, net of effect on U.S. federal tax | 1.8 | 2.2 | 1.7 | |||||||||
Medicare Part D law change | 3.3 | |||||||||||
Federal audit settlement | (8.2 | ) | ||||||||||
Other provision adjustments | 0.2 | 0.4 | 2.7 | |||||||||
Effective income tax rate | 26.5 | % | 22.9 | % | 33.6 | % | ||||||
Significant components of our deferred tax assets, net of deferred tax liabilities, at December 31 were as follows:
| 2010 | 2009 | |||||||
Retiree health care accruals | $ | 3,061 | $ | 2,930 | ||||
Inventory and long-term contract methods of income recognition, fixed assets and other (net of valuation allowance of $27 and $23) | (2,644 | ) | (994 | ) | ||||
Partnerships and joint ventures | (263 | ) | (528 | ) | ||||
Other employee benefits accruals | 1,272 | 1,411 | ||||||
In-process research and development related to acquisitions | 65 | 79 | ||||||
Net operating loss, credit and capital loss carryovers (net of valuation allowance of $78 and $36) | 300 | 477 | ||||||
Pension asset | 3,443 | 2,345 | ||||||
Customer and commercial financing | (1,645 | ) | (1,703 | ) | ||||
Unremitted earnings of non-U.S. subsidiaries | (60 | ) | (55 | ) | ||||
Other net unrealized losses | 13 | 66 | ||||||
Net deferred tax assets (1) | $ | 3,542 | $ | 4,028 | ||||
| (1) | Of the deferred tax asset for net operating loss and credit carryovers, $158 expires in years ending from December 31, 2011 through December 31, 2030 and $142 may be carried over indefinitely. |
70
Net deferred tax assets at December 31 were as follows:
| 2010 | 2009 | |||||||
Deferred tax assets | $ | 14,383 | $ | 13,739 | ||||
Deferred tax liabilities | (10,736 | ) | (9,652 | ) | ||||
Valuation allowance | (105 | ) | (59 | ) | ||||
Net deferred tax assets | $ | 3,542 | $ | 4,028 | ||||
The measurement of deferred tax assets is reduced by a valuation allowance if, based upon available evidence, it is more likely than not that some or all of the deferred tax assets will not be realized. Included in the net deferred tax assets at December 31, 2010 and 2009 are deferred tax assets in the amounts of $8,186 and $7,226 related to other comprehensive loss.
We have provided for U.S. deferred income taxes and foreign withholding tax in the amount of $60 on undistributed earnings not considered permanently reinvested in our non-U.S. subsidiaries. We have not provided for U.S. deferred income taxes or foreign withholding tax on the remainder of undistributed earnings from our non-U.S. subsidiaries because such earnings are considered to be permanently reinvested and it is not practicable to estimate the amount of tax that may be payable upon distribution.
As of December 31, 2010 and 2009, the amount accrued for the payment of income tax-related interest and penalties included in the Consolidated Statements of Financial Position was as follows: interest of $170 and $271 and penalties of $12 and $14. The amount of interest (benefit)/expense was ($105), $45 and $43 for the years ended December 31, 2010, 2009 and 2008, respectively. The interest benefit recorded during 2010 was primarily related to the 1998-2003 federal audit settlement.
The years 2007-2008 are currently being examined by the Internal Revenue Service (IRS), and we have filed appeals with the IRS for 2004-2006. We are also subject to examination in major state and international jurisdictions for the 2001-2010 tax years. We believe appropriate provisions for all outstanding issues have been made for all jurisdictions and all open years.
A reconciliation of the beginning and ending amount of unrecognized tax benefits is as follows:
| 2010 | 2009 | 2008 | ||||||||||
Unrecognized tax benefits – January 1 | $ | 1,787 | $ | 1,453 | $ | 1,272 | ||||||
Gross increases – tax positions in prior periods | 95 | 219 | 88 | |||||||||
Gross decreases – tax positions in prior periods | (465 | ) | (31 | ) | (28 | ) | ||||||
Gross increases – current-period tax positions | 76 | 148 | 132 | |||||||||
Gross decreases – current-period tax positions | (40 | ) | ||||||||||
Settlements | (254 | ) | (10 | ) | ||||||||
Lapse of statute of limitations | (1 | ) | (2 | ) | (1 | ) | ||||||
Unrecognized tax benefits – December 31 | $ | 1,198 | $ | 1,787 | $ | 1,453 | ||||||
As of December 31, 2010, 2009 and 2008, the total amount of unrecognized tax benefits was $1,198, $1,787 and $1,453 of which $1,074, $1,452 and $1,171 would affect the effective tax rate, if recognized. These amounts are primarily associated with U.S. federal tax issues such as the tax benefits from the Foreign Sales Corporation/Extraterritorial Income tax rules, the amount of research and development tax credits claimed, U.S. taxation of foreign earnings, and valuation issues regarding charitable contributions claimed. Also included in these amounts are accruals for domestic state tax issues such as the allocation of income among various state tax jurisdictions and the amount of state tax credits claimed.
71
Audit outcomes and the timing of audit settlements are subject to significant uncertainty. It is reasonably possible that within the next 12 months we will resolve some or all of the matters presently under consideration for 2004-2006 with the IRS. Depending on the timing and outcome of the audit settlement, unrecognized tax benefits that affect the effective tax rate could increase earnings by up to $300 based on current estimates.
The research and development credit expired on December 31, 2009. On December 17, 2010, President Obama signed into law, the Tax Relief, Unemployment Insurance Reauthorization, and Job Creation Act of 2010 that retroactively renews the research and development tax credit for 2010 and extends the credit through December 31, 2011.
Note 6 – Accounts Receivable
Accounts receivable at December 31 consisted of the following:
| 2010 | 2009 | |||||||
U.S. government contracts | $ | 2,969 | $ | 3,090 | ||||
Commercial customers | 1,241 | 1,206 | ||||||
Reinsurance receivables | 487 | 494 | ||||||
Non-U.S. military contracts | 514 | 436 | ||||||
Sea Launch receivables, net of reserves (1) | 438 | |||||||
Other | 253 | 162 | ||||||
Less valuation allowance | (42 | ) | (41 | ) | ||||
Total | $ | 5,422 | $ | 5,785 | ||||
| (1) | During 2010, the Sea Launch receivables were reclassified from Accounts receivable to Other assets. See discussion below. |
The following table summarizes our accounts receivable under long-term contracts that were not billable or related to outstanding claims as of December 31:
| Unbillable | Claims | |||||||||||||||
| 2010 | 2009 | 2010 | 2009 | |||||||||||||
Current | $ | 994 | $ | 1,273 | $ | 30 | $ | 33 | ||||||||
Expected to be collected after one year | 507 | 450 | 194 | 151 | ||||||||||||
Total | $ | 1,501 | $ | 1,723 | $ | 224 | $ | 184 | ||||||||
Under contract accounting unbillable receivables on long-term contracts arise when the sales or revenues based on performance attainment, though appropriately recognized, cannot be billed yet under terms of the contract as of the balance sheet date. Any adjustment for the credit quality of unbillable receivables, if required, would be recorded as a direct reduction of revenue. Factors considered in assessing the collectibility of unbillable receivables include, but are not limited to, a customer's extended delinquency, requests for restructuring and filings for bankruptcy. Unbillable receivables related to commercial customers expected to be collected after one year were $213 and $158 at December 31, 2010 and 2009. Accounts receivable related to claims are items that we believe are earned, but are subject to uncertainty concerning their determination or ultimate realization. Accounts receivable, other than those described above, expected to be collected after one year are not material.
72
Sea Launch
At December 31, 2010, Other assets included $356 of receivables, previously recorded as Accounts receivable, related to our former investment in the Sea Launch venture which became payable by certain Sea Launch partners following Sea Launch's bankruptcy filing in June 2009. The $356 includes $147 related to a payment made by us under a bank guarantee on behalf of Sea Launch and $209 related to loans we made to Sea Launch. The net amounts owed to Boeing by each of the partners are as follows; S.P. Koroley Rocket and Space Corporation Energia of Russia – $223, PO Yuzhnoye Mashinostroitelny Zavod of Ukraine – $89 and KB Yuzhnoye of Ukraine – $44.
Although each partner is contractually obligated to reimburse us for its share of the bank guarantee, the Russian and Ukrainian partners have raised defenses to enforcement and contested our claims. On October 19, 2009, we filed a Notice of Arbitration with the Stockholm Chamber of Commerce seeking reimbursement from the other Sea Launch partners of the $147 bank guarantee payment. On October 7, 2010, the arbitrator ruled that the Stockholm Chamber of Commerce lacked jurisdiction to hear the matter but did not resolve the merits of our claim. We filed a notice appealing the arbitrator's ruling on January 11, 2011. We believe the partners have the financial wherewithal to pay and intend to pursue vigorously all of our rights and remedies. In the event we are unable to secure reimbursement of $147 related to our payment under the bank guarantee and $209 related to loans made to Sea Launch, we could incur additional pre-tax charges of up to $356.
Note 7 – Inventories
Inventories at December 31 consisted of the following:
| 2010 | 2009 | |||||||
Long-term contracts in progress | $ | 14,400 | $ | 14,673 | ||||
Commercial aircraft programs | 26,550 | 18,568 | ||||||
Commercial spare parts, used aircraft, general stock materials and other | 5,788 | 5,004 | ||||||
Inventory before advances and progress billings | 46,738 | 38,245 | ||||||
Less advances and progress billings | (22,421 | ) | (21,312 | ) | ||||
Total | $ | 24,317 | $ | 16,933 | ||||
Long-Term Contracts in Progress
Long-term contracts in progress included Delta launch program inventory that will be sold at cost to United Launch Alliance (ULA) under an inventory supply agreement that terminates on March 31, 2021. At December 31, 2010 and 2009, the inventory balance was $1,385 and $1,685. As of December 31, 2010, $1,070 of this inventory relates to yet unsold launches. ULA is continuing to assess the future of the Delta II program. In the event ULA is unable to sell additional Delta II inventory, our earnings could be reduced by up to $70. See Note 12.
Inventory balances included $236 and $235 subject to claims or other uncertainties relating to the A-12 program as of December 31, 2010 and 2009. See Note 20.
Commercial Aircraft Programs
As of December 31, 2010 and 2009 commercial aircraft programs inventory included the following amounts related to the 787 program: $9,461 and $3,885 of work in process (including deferred production costs), $1,956 and $2,187 of supplier advances, and $1,447 and $1,231 of tooling and other non-recurring costs.
73
Commercial aircraft programs inventory included $319 and $510 of deferred production cost, and $170 and $211 of unamortized tooling for the 777 program, at December 31, 2010 and 2009.
Commercial aircraft program inventory included amounts credited in cash or other consideration (early issue sales consideration), to airline customers totaling $1,970 and $1,577 at December 31, 2010 and 2009.
As a normal course of our Commercial Airplanes segment production process, our inventory may include a small quantity of airplanes that are completed but unsold. As of December 31, 2010 and 2009, the value of completed but unsold aircraft in inventory was insignificant.
Note 8 – Customer Financing
Customer financing at December 31 consisted of the following:
| 2010 | 2009 | |||||||
Financing receivables | ||||||||
Investment in sales-type/finance leases | $ | 2,272 | $ | 2,391 | ||||
Notes | 480 | 1,008 | ||||||
Operating lease equipment, at cost, less accumulated depreciation of $847 and $784 | 2,281 | 2,737 | ||||||
Gross customer financing | $ | 5,033 | $ | 6,136 | ||||
Less allowance for losses on receivables | (353 | ) | (302 | ) | ||||
Total | $ | 4,680 | $ | 5,834 | ||||
The components of investment in sales-type/finance leases at December 31 were as follows:
| 2010 | 2009 | |||||||
Minimum lease payments receivable | $ | 2,879 | $ | 3,147 | ||||
Estimated residual value of leased assets | 619 | 677 | ||||||
Unearned income | (1,226 | ) | (1,433 | ) | ||||
Total | $ | 2,272 | $ | 2,391 | ||||
Operating lease equipment primarily includes jet and commuter aircraft. At December 31, 2010 and 2009, operating lease equipment included $583 and $385 of equipment available for sale or re-lease. At December 31, 2010 and 2009, we had firm lease commitments for $28 and $345 of this equipment.
When our Commercial Airplanes segment is unable to immediately sell used aircraft, it may place the aircraft under an operating lease. It may also provide customer financing with a note receivable. The carrying amount of the Commercial Airplanes segment used aircraft under operating leases and notes receivable included as a component of customer financing totaled $167 and $203 as of December 31, 2010 and 2009.
Financing receivable balances evaluated for impairment are as follows:
| 2010 | 2009 | |||||||
Individually evaluated for impairment | $ | 99 | $ | 270 | ||||
Collectively evaluated for impairment | 2,653 | 3,129 | ||||||
Total financing receivables | $ | 2,752 | $ | 3,399 | ||||
74
At December 31, 2010, we had no impaired financing receivables. Impaired financing receivables, unpaid principal balances, and the allowance for losses on those receivables consisted of the following at December 31, 2009:
No specific impairment allowance | $ | 1 | ||||||
Specific impairment allowance | 144 | |||||||
Carrying value of impaired receivables | $ | 145 | ||||||
Unpaid principal balance | $ | 145 | ||||||
Allowance for losses on impaired receivables | 2 | |||||||
The average recorded investment in impaired financing receivables as of December 31, 2010, 2009 and 2008, was $88, $162 and $197, respectively. Income recognition is generally suspended for financing receivables at the date full recovery of income and principal becomes not probable. Income is recognized when financing receivables become contractually current and performance is demonstrated by the customer. Interest income recognized on such receivables was $9, $9 and $14 for the years ended December 31, 2010, 2009 and 2008, respectively.
The change in the allowance for losses on financing receivables for the years ended December 31, 2010, 2009 and 2008, consisted of the following:
| 2010 | 2009 | 2008 | ||||||||||
Beginning balance – January 1 | $ | (302 | ) | $ | (269 | ) | $ | (195 | ) | |||
Customer financing valuation benefit/(provision) | (51 | ) | (45 | ) | (84 | ) | ||||||
Reduction in customer financing assets | 12 | 10 | ||||||||||
Ending balance – December 31 | $ | (353 | ) | $ | (302 | ) | $ | (269 | ) | |||
Specifically evaluated for impairment | $ | (2 | ) | $ | (8 | ) | ||||||
Collectively evaluated for impairment | $ | (353 | ) | (300 | ) | (261 | ) | |||||
We assign internal credit ratings for all customers and determine the creditworthiness of each customer based upon public information and information obtained directly from our customers. We utilize these credit ratings as one of the factors in assessing the adequacy of our allowance for losses on receivables. Our rating categories are comparable to those used by the major credit rating agencies. Credit risk profile by internally assigned ratings, consisted of the following at December 31:
| Rating categories | 2010 | 2009 | ||||||
B | $ | 207 | $ | 510 | ||||
CCC | 2,432 | 2,746 | ||||||
Other | 113 | 143 | ||||||
Total carrying value of financing receivables | $ | 2,752 | $ | 3,399 | ||||
At December 31, 2010 and 2009, all of our receivables were related to customers we believe have less than investment-grade credit. For the year ended December 31, 2010, we applied default rates, on average, of 11% and 51% for customers with internally assigned B and CCC ratings.
Declines in collateral values are a significant driver of our allowance for losses. Generally, out-of-production aircraft have had greater percentages of collateral value declines than in-production aircraft. Our portfolio is primarily comprised of financing receivables for out-of-production aircraft.
As of December 31, 2010, we had no past due receivables. As of December 31, 2009, total financing receivables past due thirty days or more was $1.
75
Customer Financing Exposure
Customer financing is collateralized by security in the related asset. The value of the collateral is closely tied to commercial airline performance and may be subject to reduced valuation with market decline. Our Customer financing portfolio has a concentration of various model aircraft. Customer financing carrying values related to major aircraft concentrations at December 31 were as follows:
| 2010 | 2009 | |||||||
717 Aircraft ($561 and $662 accounted for as operating leases) (1) | $ | 2,070 | $ | 2,262 | ||||
757 Aircraft ($629 and $708 accounted for as operating leases) (1) | 720 | 902 | ||||||
737 Aircraft ($317 and $400 accounted for as operating leases) | 366 | 553 | ||||||
767 Aircraft ($115 and $154 accounted for as operating leases) | 372 | 465 | ||||||
MD-11 Aircraft ($327 and $384 accounted for as operating leases) (1) | 327 | 384 | ||||||
| (1) | Out of production aircraft |
Charges related to customer financing asset impairment for the years ended December 31 were as follows:
| 2010 | 2009 | 2008 | ||||||||||
Boeing Capital Corporation | $ | 85 | $ | 91 | $ | 35 | ||||||
Other Boeing | 85 | 8 | ||||||||||
Total | $ | 170 | $ | 99 | $ | 35 | ||||||
Scheduled receipts on customer financing are as follows:
| Year | 2011 | 2012 | 2013 | 2014 | 2015 | Beyond 2015 | ||||||||||||||||||
Principal payments on notes receivable | $ | 170 | $ | 98 | $ | 138 | $ | 23 | $ | 25 | $ | 26 | ||||||||||||
Sales-type/finance lease payments receivable | 319 | 317 | 274 | 274 | 273 | 1,422 | ||||||||||||||||||
Operating lease equipment payments receivable | 292 | 231 | 184 | 141 | 120 | 200 | ||||||||||||||||||
Customer financing assets leased under capital leases and subleased to others were not significant in 2010 and 2009.
Note 9 – Property, Plant and Equipment
Property, plant and equipment at December 31 consisted of the following:
| 2010 | 2009 | |||||||
Land | $ | 542 | $ | 539 | ||||
Buildings and land improvements | 9,695 | 9,548 | ||||||
Machinery and equipment | 11,002 | 10,383 | ||||||
Construction in progress | 1,014 | 1,109 | ||||||
Gross property, plant and equipment | 22,253 | 21,579 | ||||||
Less accumulated depreciation | (13,322 | ) | (12,795 | ) | ||||
Total | $ | 8,931 | $ | 8,784 | ||||
Depreciation expense was $1,096, $1,066 and $1,013 for the years ended December 31, 2010, 2009 and 2008, respectively. Interest capitalized during the years ended December 31, 2010, 2009 and 2008 totaled $48, $90 and $99, respectively.
76
Rental expense for leased properties was $269, $273 and $426, for the years ended December 31, 2010, 2009 and 2008, respectively. For the same periods, these expenses, substantially all minimum rentals, were net of sublease income of $6, $9 and $14, respectively. At December 31, 2010, minimum rental payments under capital leases aggregated $143. Minimum rental payments under operating leases with initial or remaining terms of one year or more aggregated $1,159, net of sublease payments of $4, at December 31, 2010. Non-cancellable future rentals due from customers for equipment on operating leases aggregated $121 at December 31, 2010. Payments due under operating and capital leases net of sublease amounts, and non-cancellable future rentals during the next five years are as follows:
| 2011 | 2012 | 2013 | 2014 | 2015 | ||||||||||||||||
Minimum operating lease payments, net of sublease amounts | $ | 217 | $ | 158 | $ | 122 | $ | 102 | $ | 62 | ||||||||||
Future rentals due from customers for equipment on operating leases | 17 | 16 | 15 | 14 | 14 | |||||||||||||||
Minimum capital lease payments, net of sublease amounts | 54 | 48 | 30 | 8 | 1 | |||||||||||||||
We had accounts payable related to purchases of property, plant and equipment of $265 and $131 for the years ended December 31, 2010 and 2009.
Note 10 – Investments
Our investments, which are recorded in Short-term and other investments or Investments, consisted of the following at December 31:
| 2010 | 2009 | |||||||
Time deposits | $ | 5,100 | $ | 1,900 | ||||
Pledged money market funds (1) | 57 | |||||||
Available-for-sale investments | 15 | 139 | ||||||
Equity method investments | 1,072 | 974 | ||||||
Other investments | 25 | 25 | ||||||
Total | $ | 6,269 | $ | 3,038 | ||||
| (1) | These money market funds have been pledged in lieu of letters of credit as collateral in support of our workers' compensation programs. These funds can become available within 30 days notice upon issuance of replacement letters of credit. |
Available-For-Sale Investments
Our investments in available-for-sale debt and equity securities consisted of the following at December 31:
| December 31, 2010 | December 31, 2009 | |||||||||||||||||||||||||||||||
| Cost or Amortized Cost | Gross Unrealized Gain | Gross Unrealized Loss | Fair Value | Cost or Amortized Cost | Gross Unrealized Gain | Gross Unrealized Loss | Fair Value | |||||||||||||||||||||||||
Debt | $ | 5 | $ | 5 | $ | 113 | $ | (1 | ) | $ | 112 | |||||||||||||||||||||
Equity | 11 | $ | (1 | ) | 10 | 40 | $ | 1 | (14 | ) | 27 | |||||||||||||||||||||
Total | $ | 16 | $ | (1 | ) | $ | 15 | $ | 153 | $ | 1 | $ | (15 | ) | $ | 139 | ||||||||||||||||
77
The contractual maturities of the available-for-sale debt securities extend through April 2017. Gross realized gains and losses on available-for-sale investment securities were as follows:
| Years ended December 31, | 2010 | 2009 | 2008 | |||||||||
Gains | $ | 10 | $ | 4 | $ | 46 | ||||||
Losses, including other-than-temporary-impairments | (1 | ) | (48 | ) | (107 | ) | ||||||
Net | $ | 9 | $ | (44 | ) | $ | (61 | ) | ||||
Equity Method Investments
Our effective ownership percentages and balances of equity method investments consisted of the following as of December 31:
| Segment | Ownership Percentages | Investment Balance | ||||||||||||
| 2010 | 2009 | |||||||||||||
United Launch Alliance | Network & Space Systems | 50 | % | $ | 950 | $ | 962 | |||||||
United Space Alliance | Network & Space Systems | 50 | % | (40 | ) (1) | (150 | ) (1) | |||||||
Other | Primarily Commercial Airplanes and Global Services & Support | 162 | 162 | |||||||||||
Total Equity method investments | $ | 1,072 | $ | 974 | ||||||||||
| (1) | Credit balances are a result of our proportionate share of the joint venture's pension and postretirement related adjustments which reduce the carrying value of the investment. |
Note 11 – Liabilities, Commitments and Contingencies
Other Accrued Liabilities
Other accrued liabilities at December 31 consisted of the following:
| 2010 | 2009 | |||||||
Accrued compensation and employee benefit costs | $ | 5,193 | $ | 4,662 | ||||
Environmental | 721 | 706 | ||||||
Product warranties | 1,076 | 999 | ||||||
Forward loss recognition (1) | 2,743 | 2,738 | ||||||
Other | 4,069 | 3,717 | ||||||
Total | $ | 13,802 | $ | 12,822 | ||||
| (1) | Forward loss recognition relates primarily to the 747 Program and Airborne Early Warning and Control (AEW&C). |
Environmental
The following table summarizes environmental remediation during the years ended December 31, 2010 and 2009.
| 2010 | 2009 | |||||||
Beginning balance – January 1 | $ | 706 | $ | 731 | ||||
Reductions for payments made | (93 | ) | (89 | ) | ||||
Changes in estimates | 108 | 64 | ||||||
Ending balance – December 31 | $ | 721 | $ | 706 | ||||
78
The liabilities recorded represent our best estimate or the low end of a range of reasonably possible costs expected to be incurred to remediate sites, including operation and maintenance over periods of up to 30 years. It is reasonably possible that we may incur charges that exceed these recorded amounts because of regulatory agency orders and directives, changes in laws and/or regulations, higher than expected costs and the discovery of additional contamination. As part of our estimating process, we develop a range of reasonably possible alternate scenarios which include highest cost estimates for all remediation sites based on our experience and existing laws and regulations. At December 31, 2010 and 2009, our reasonably possible highest cost estimate for all remediation sites exceeded our recorded liabilities by $957 and $948.
Product Warranties
The following table summarizes product warranty activity recorded for the years ended December 31, 2010 and 2009.
| 2010 | 2009 | |||||||
Beginning balance – January 1 | $ | 999 | $ | 959 | ||||
Additions for current year deliveries | 141 | 167 | ||||||
Reductions for payments made | (234 | ) | (237 | ) | ||||
Changes in estimates | 170 | 110 | ||||||
Ending balance – December 31 | $ | 1,076 | $ | 999 | ||||
Discontinued Operations
As part of the 2004 purchase and sale agreement with General Electric Capital Corporation related to the sale of Boeing Capital Corporation's (BCC) Commercial Financial Services business, BCC is involved in a loss sharing arrangement for losses on transferred portfolio assets, such as asset sales, provisions for loss or asset impairment charges offset by gains from asset sales. At December 31, 2010 and 2009, our maximum future cash exposure to losses associated with the loss sharing arrangement was $232 and $234 and our accrued liability under the loss sharing arrangement was $82 and $77.
Commercial Aircraft Commitments
In conjunction with signing definitive agreements for the sale of new aircraft (Sale Aircraft), we have entered into specified-price trade-in commitments with certain customers that give them the right to trade in used aircraft upon the purchase of Sale Aircraft. The total contractual trade-in value was $295 and $427 as of December 31, 2010 and 2009. We anticipate that a significant portion of these commitments will not be exercised by customers.
The probability that trade-in commitments will be exercised is determined by using both quantitative information from valuation sources and qualitative information from other sources. The probability of exercise is continually assessed, taking into consideration the current economic environment. Trade-in commitments, which can be terminated by mutual consent with the customer, may be exercised only during the period specified in the agreement, and require advance notice by the customer. The estimated fair value of trade-in aircraft related to probable contractual trade-in commitments was $30 and $34 as of December 31, 2010 and 2009. Trade-in commitment agreements have expiration dates from 2011 through 2023.
79
Future Lease Commitments
As of December 31, 2010 and 2009, future lease commitments on aircraft and other commitments not recorded on the Consolidated Statements of Financial Position totaled $17 and $159. These lease commitments extend through 2015, and our intent is to recover these lease commitments through sublease arrangements. As of December 31, 2010, the future lease commitments on aircraft for each of the next five years were as follows: $3 in 2011, $3 in 2012, $3 in 2013, $3 in 2014, and $3 in 2015. As of December 31, 2010 and 2009, Other accrued liabilities included $12 and $14 attributable to adverse commitments under these lease arrangements.
Financing Commitments
Financing commitments totaled $9,865 and $10,409 as of December 31, 2010 and 2009. We anticipate that a significant portion of these commitments will not be exercised by the customers as we continue to work with third party financiers to provide alternative financing to customers. However, there can be no assurances that we will not be required to fund greater amounts than historically required.
We have entered into standby letters of credit agreements and surety bonds with financial institutions primarily relating to the guarantee of future performance on certain contracts. Contingent liabilities on outstanding letters of credit agreements and surety bonds aggregated approximately $7,599 and $7,052 as of December 31, 2010 and 2009.
In connection with the formation of ULA, we and Lockheed Martin Corporation (Lockheed) each committed to provide up to $200 to support its working capital requirements through December 1, 2011. ULA did not request any funds under the commitment as of December 31, 2010. We and Lockheed have also each committed to provide ULA with up to $232 of additional capital contributions in the event ULA does not have sufficient funds to make a required payment to us under an inventory supply agreement. See Note 7.
C-17
At December 31, 2010, our backlog included 6 C-17 aircraft currently under contract with the U.S. Air Force (USAF) as well as international orders for 6 C-17 aircraft. At December 31, 2010, we have approximately $620 of inventory expenditures and potential termination liabilities to suppliers associated primarily with 10 aircraft funded in the Fiscal Year 2010 (FY10) Defense Appropriations Act which are not currently under contract. The President's Fiscal Year 2011 budget announced during the first quarter of 2010 did not include any additional C-17 aircraft. During the first quarter of 2010 we announced plans to reduce the production rate from 15 per year to 10 per year and expect the transition to be complete by mid-2011. The lower production rate is intended to bridge the gap between existing orders and potential future orders. Should additional orders not materialize, it is reasonably possible that we will decide in 2011 to end production of the C-17 at a future date. We are still evaluating the full financial impact of a potential production shut-down, including any recovery that would be available from the U.S. government. Such recovery from the U.S. government would not include the costs incurred by us resulting from our direction to suppliers to begin working on aircraft beyond those currently under contract with the USAF.
Company Owned Life Insurance
McDonnell Douglas Corporation insured its executives with Company Owned Life Insurance (COLI), which are life insurance policies with a cash surrender value. Although we do not use COLI currently, these obligations from the merger with McDonnell Douglas are still a commitment at this time. We have loans in place to cover costs paid or incurred to carry the underlying life insurance policies. As of
80
December 31, 2010 and 2009, the cash surrender value was $381 and $360 and the total loans were $363 and $337. As we have the right to offset the loans against the cash surrender value of the policies, we present the net asset in Other assets on the Consolidated Statements of Financial Position as of December 31, 2010 and 2009.
Note 12 – Arrangements with Off-Balance Sheet Risk
We enter into arrangements with off-balance sheet risk in the normal course of business, primarily in the form of guarantees.
Third-Party Guarantees
The following tables provide quantitative data regarding our third-party guarantees. The maximum potential payments represent a "worst-case scenario," and do not necessarily reflect amounts that we expect to pay. Estimated proceeds from collateral and recourse represent the anticipated values of assets we could liquidate or receive from other parties to offset our payments under guarantees.
| Maximum Potential Payments | Estimated Proceeds from Collateral/ Recourse | Carrying Amount of Liabilities (1) | ||||||||||||||||||||||
| December 31, | 2010 | 2009 | 2010 | 2009 | 2010 | 2009 | ||||||||||||||||||
Contingent repurchase commitments | $ | 3,782 | $ | 3,958 | $ | 3,759 | $ | 3,940 | $ | 7 | $ | 7 | ||||||||||||
Indemnifications to ULA: | ||||||||||||||||||||||||
Contributed Delta program launch inventory | 187 | 277 | ||||||||||||||||||||||
Contract pricing | 261 | 348 | 7 | 7 | ||||||||||||||||||||
Other Delta contracts | 83 | 57 | 16 | 16 | ||||||||||||||||||||
Other credit guarantees | 71 | 119 | 63 | 109 | 6 | 2 | ||||||||||||||||||
Residual value guarantees | 29 | 51 | 21 | 44 | 6 | 10 | ||||||||||||||||||
| (1) | Amounts included in Other accrued liabilities. |
Contingent Repurchase Commitments We have entered into contingent repurchase commitments with certain customers in conjunction with signing definitive agreements for the sale of new aircraft. Under these commitments, we agreed to repurchase the Sale Aircraft at a specified price, generally 10 to 15 years after delivery of the Sale Aircraft. Our repurchase of the Sale Aircraft is contingent upon a future, mutually acceptable agreement for the sale of additional new aircraft, and the subsequent exercise by the customer of its right to sell the Sale Aircraft to us. The repurchase price specified in contingent repurchase commitments is generally lower than the expected fair value at the specified repurchase date. Estimated Proceeds from Collateral/Recourse in the tables above represent the lower of the contracted repurchase price or the expected fair value of each aircraft at the specified repurchase date.
Indemnifications to ULA We agreed to indemnify ULA through December 31, 2020 against potential non-recoverability and non-allowability of $1,360 of Boeing Delta launch program inventory included in contributed assets plus $1,860 of inventory subject to an inventory supply agreement which ends on March 31, 2021. Since inception, ULA has consumed $1,201 of inventory that was contributed by us. ULA has made advance payments of $420 to us and we have recorded revenues and cost of sales of $166 under the inventory supply agreement through December 31, 2010. ULA is continuing to assess the future of the Delta II program beyond what is currently on contract. In the event ULA is unable to sell additional Delta II inventory, our earnings could be reduced by up to $70.
81
We agreed to indemnify ULA against potential losses that ULA may incur in the event ULA is unable to obtain certain additional contract pricing from the USAF for four satellite missions. We believe ULA is entitled to additional contract pricing. In December 2008, ULA submitted a claim to the USAF to re-price the contract value for two satellite missions. In March 2009, the USAF issued a denial of that claim and in June 2009, ULA filed an appeal. During 2009, the USAF exercised its option for a third satellite mission. During the third quarter of 2010, ULA submitted a claim to the USAF to re-price the contract value of the third mission. The USAF did not exercise an option for a fourth mission prior to expiration. If ULA is unsuccessful in obtaining additional pricing, we may be responsible for a portion of the shortfall and may record up to $283 in pre-tax losses associated with the three missions, representing up to $261 for the indemnification payment and up to $22 for our portion of additional contract losses incurred by ULA.
Other Credit Guarantees We have issued credit guarantees, principally to facilitate the sale and/or financing of commercial aircraft. Under these arrangements, we are obligated to make payments to a guaranteed party in the event that lease or loan payments are not made by the original lessee or debtor or certain specified services are not performed. A substantial portion of these guarantees has been extended on behalf of original lessees or debtors with less than investment-grade credit. Our commercial aircraft credit guarantees are collateralized by the underlying commercial aircraft and certain other assets. Current outstanding credit guarantees expire within the next ten years.
Residual Value Guarantees We have issued various residual value guarantees principally to facilitate the sale and financing of certain commercial aircraft. Under these guarantees, we are obligated to make payments to the guaranteed party if the related aircraft or equipment fair values fall below a specified amount at a future time. These obligations are collateralized principally by the underlying commercial aircraft and expire within the next eight years.
Other Indemnifications
In conjunction with our sales of the Electron Dynamic Devices, Inc. and Rocketdyne Propulsion and Power businesses and the sale of our Commercial Airplanes facilities in Wichita, Kansas and Tulsa and McAlester, Oklahoma in 2005, we agreed to indemnify, for an indefinite period, the buyers for costs relating to pre-closing environmental contamination and certain other items. As it is impossible to assess whether there will be damages in the future or the amounts thereof (if any), we cannot estimate the maximum potential amount of future payments under these indemnities. Therefore, no liability has been recorded. There have been no claims submitted to date.
Industrial Revenue Bonds
Industrial Revenue Bonds (IRBs) issued by the City of Wichita are used to finance the purchase and/or construction of real and personal property at our Wichita site. Tax benefits associated with IRBs include a ten-year property tax abatement and a sales tax exemption from the Kansas Department of Revenue. We record the property on our Consolidated Statements of Financial Position, along with a capital lease obligation to repay the proceeds of the IRB. We have also purchased the IRBs and therefore are the bondholders as well as the borrower/lessee of the property purchased with the IRB proceeds.
The capital lease obligation and IRB asset are recorded net in the Consolidated Statements of Financial Position. As of December 31, 2010 and 2009, the net assets associated with the City of Wichita IRBs were $822 and $856.
82
Note 13 – Debt
Total debt interest incurred, including amounts capitalized, was $729, $610 and $520 for the years ended December 31, 2010, 2009 and 2008, respectively. Interest expense recorded by BCC is reflected as a separate line item on our Consolidated Statements of Operations, and is included in earnings from operations. Total Company interest payments were $670, $502 and $493 for the years ended December 31, 2010, 2009 and 2008, respectively.
We have $4,376 currently available under credit line agreements, of which $2,000 is a five-year credit facility expiring in November 2012 and $ 2,376 is a 364-day revolving credit facility expiring in November 2011. Both the five-year and 364-day credit facilities have a one-year term out option which allows us to extend the maturity of any borrowings one year beyond the aforementioned expiration dates. We have given BCC exclusive access to $1,500 under these arrangements. We continue to be in full compliance with all covenants contained in our debt or credit facility agreements, including those at BCC.
Short-term debt and current portion of long-term debt at December 31 consisted of the following:
| 2010 | 2009 | |||||||||||||||
Consolidated Total | BCC Only | Consolidated Total | BCC Only | |||||||||||||
Unsecured debt securities | $ | 785 | $ | 785 | $ | 644 | $ | 644 | ||||||||
Non-recourse debt and notes | 79 | 6 | 24 | 6 | ||||||||||||
Capital lease obligations | 62 | 10 | 14 | 9 | ||||||||||||
Other notes | 22 | 25 | ||||||||||||||
Total | $ | 948 | $ | 801 | $ | 707 | $ | 659 | ||||||||
Debt at December 31 consisted of the following:
| 2010 | 2009 | |||||||
Boeing Capital Corporation debt: | ||||||||
Unsecured debt securities | ||||||||
1.53% – 7.58% due through 2023 | $ | 3,339 | $ | 3,952 | ||||
Non-recourse debt and notes | ||||||||
1.37% – 5.79% notes due through 2013 | 55 | 61 | ||||||
Capital lease obligations | ||||||||
0.92% due through 2015 | 52 | 62 | ||||||
Boeing Capital Corporation debt subtotal | $ | 3,446 | $ | 4,075 | ||||
Other Boeing debt: | ||||||||
Unsecured debentures and notes | ||||||||
1.88% – 5.00% due through 2020 | $ | 3,376 | $ | 3,372 | ||||
5.88% – 6.88% due through 2043 | 2,988 | 2,987 | ||||||
7.25% – 9.75% due through 2043 | 1,991 | 1,990 | ||||||
Non-recourse debt and notes | ||||||||
Enhanced equipment trust | 342 | 360 | ||||||
Capital lease obligations due through 2017 | 135 | 14 | ||||||
Other notes | 143 | 126 | ||||||
Other Boeing debt subtotal | $ | 8,975 | $ | 8,849 | ||||
Total debt | $ | 12,421 | $ | 12,924 | ||||
83
Other Boeing debt includes $300 bearing an interest rate of 7.95% due August 15, 2024 that may be redeemed at the holder's option on August 15, 2012.
At December 31, 2010, $107 of BCC debt was collateralized by portfolio assets and underlying equipment totaling $186. The debt consists of the 0.92% to 5.79% notes due through 2015.
Scheduled principal payments for debt and capital lease obligations for the next five years are as follows:
| 2011 | 2012 | 2013 | 2014 | 2015 | ||||||||||||||||
Boeing Capital Corporation | $ | 798 | $ | 878 | $ | 652 | $ | 526 | $ | 16 | ||||||||||
Other Boeing | 141 | 1,420 | 657 | 770 | 821 | |||||||||||||||
Total | $ | 939 | $ | 2,298 | $ | 1,309 | $ | 1,296 | $ | 837 | ||||||||||
Note 14 – Postretirement Plans
Almost all of our employees are covered by defined benefit pension plans, with the exception of all nonunion and some union employees hired after December 31, 2008. We fund our major pension plans through trusts. Pension assets are placed in trust solely for the benefit of the plans' participants, and are structured to maintain liquidity that is sufficient to pay benefit obligations as well as to keep pace over the long term with the growth of obligations for future benefit payments.
We also have other postretirement benefits (OPB) other than pensions which consist principally of health care coverage for eligible retirees and qualifying dependents, and to a lesser extent, life insurance to certain groups of retirees. Retiree health care is provided principally until age 65 for approximately half those retirees who are eligible for health care coverage. Certain employee groups, including employees covered by most United Auto Workers bargaining agreements, are provided lifetime health care coverage.
The funded status of the plans is measured as the difference between the plan assets at fair value and the projected benefit obligation (PBO). We have recognized the aggregate of all overfunded plans in Pension plan assets, net, and the aggregate of all underfunded plans in either Accrued retiree health care or Accrued pension plan liability, net. The portion of the amount by which the actuarial present value of benefits included in the PBO exceeds the fair value of plan assets, payable in the next 12 months, is reflected in Other accrued liabilities.
The components of net periodic benefit cost are as follows:
| Pension | Other Postretirement Benefits | |||||||||||||||||||||||
| Years ended December 31, | 2010 | 2009 | 2008 | 2010 | 2009 | 2008 | ||||||||||||||||||
Service cost | $ | 1,176 | $ | 1,090 | $ | 952 | $ | 121 | $ | 132 | $ | 126 | ||||||||||||
Interest cost | 3,002 | 2,964 | 2,823 | 404 | 466 | 459 | ||||||||||||||||||
Expected return on plan assets | (3,850 | ) | (3,738 | ) | (3,811 | ) | (6 | ) | (5 | ) | (8 | ) | ||||||||||||
Amortization of prior service costs | 248 | 242 | 206 | (78 | ) | (90 | ) | (93 | ) | |||||||||||||||
Recognized net actuarial loss | 777 | 650 | 392 | 56 | 92 | 86 | ||||||||||||||||||
Settlement/curtailment/transfer loss | 14 | 13 | ||||||||||||||||||||||
Net periodic benefit cost | $ | 1,367 | $ | 1,221 | $ | 562 | $ | 497 | $ | 595 | $ | 570 | ||||||||||||
Net periodic benefit cost included in Earnings from operations | $ | 1,101 | $ | 879 | $ | 696 | $ | 480 | $ | 615 | $ | 507 | ||||||||||||
84
A portion of net periodic benefit cost is allocated to production as product costs and may remain in inventory at the end of each reporting period.
The following tables show changes in the benefit obligation, plan assets and funded status of both pensions and OPB for the years ended December 31, 2010 and 2009. Benefit obligation balances presented below reflect the PBO for our pension plans, and accumulated postretirement benefit obligations (APBO) for our OPB plans.
| Pension | Other Postretirement Benefits | |||||||||||||||
| 2010 | 2009 | 2010 | 2009 | |||||||||||||
Change in benefit obligation | ||||||||||||||||
Beginning balance | $ | 52,166 | $ | 49,017 | $ | 7,576 | $ | 7,859 | ||||||||
Service cost | 1,176 | 1,090 | 121 | 132 | ||||||||||||
Interest cost | 3,002 | 2,964 | 404 | 466 | ||||||||||||
Plan participants' contributions | 9 | 9 | ||||||||||||||
Amendments | 142 | 143 | (130 | ) | (18 | ) | ||||||||||
Actuarial (gain)/loss | 5,243 | 1,445 | 1,061 | (374 | ) | |||||||||||
Settlement/curtailment/acquisitions/ dispositions, net | (93 | ) | (68 | ) | 32 | |||||||||||
Gross benefits paid | (2,567 | ) | (2,515 | ) | (555 | ) | (541 | ) | ||||||||
Medicare Part D subsidy | 31 | 30 | ||||||||||||||
Exchange rate adjustment | 28 | 81 | 6 | 22 | ||||||||||||
Ending balance | $ | 59,106 | $ | 52,166 | $ | 8,546 | $ | 7,576 | ||||||||
Change in plan assets | ||||||||||||||||
Beginning balance at fair value | $ | 45,810 | $ | 40,597 | $ | 89 | $ | 79 | ||||||||
Actual return on plan assets | 5,979 | 6,074 | 11 | 13 | ||||||||||||
Company contribution | 35 | 1,582 | 15 | 24 | ||||||||||||
Plan participants' contributions | 9 | 9 | 2 | 2 | ||||||||||||
Settlement/curtailment/acquisitions/ dispositions, net | (98 | ) | (67 | ) | (1 | ) | ||||||||||
Benefits paid | (2,507 | ) | (2,459 | ) | (19 | ) | (28 | ) | ||||||||
Exchange rate adjustment | 24 | 74 | ||||||||||||||
Ending balance at fair value | $ | 49,252 | $ | 45,810 | $ | 98 | $ | 89 | ||||||||
Amounts recognized in statement of financial position at December 31 consist of: | ||||||||||||||||
Pension plan assets, net | $ | 6 | $ | 16 | ||||||||||||
Other accrued liabilities | (60 | ) | (57 | ) | $ | (423 | ) | $ | (438 | ) | ||||||
Accrued retiree health care | (8,025 | ) | (7,049 | ) | ||||||||||||
Accrued pension plan liability, net | (9,800 | ) | (6,315 | ) | ||||||||||||
Net amount recognized | $ | (9,854 | ) | $ | (6,356 | ) | $ | (8,448 | ) | $ | (7,487 | ) | ||||
Amounts recognized in Accumulated other comprehensive loss at December 31 are as follows:
| Pensions | Other Postretirement Benefits | |||||||||||||||
| 2010 | 2009 | 2010 | 2009 | |||||||||||||
Net actuarial loss | $ | 19,343 | $ | 17,012 | $ | 2,148 | $ | 1,197 | ||||||||
Prior service cost/(credit) | 1,225 | 1,331 | (384 | ) | (332 | ) | ||||||||||
Total recognized in Accumulated other comprehensive loss | $ | 20,568 | $ | 18,343 | $ | 1,764 | $ | 865 | ||||||||
85
The estimated amount that will be amortized from Accumulated other comprehensive loss into net periodic benefit cost during the year ended December 31, 2011 is as follows:
| Pensions | Other Postretirement Benefits | |||||||
Recognized net actuarial loss | $ | 1,252 | $ | 132 | ||||
Amortization of prior service costs | 250 | (96 | ) | |||||
Total | $ | 1,502 | $ | 36 | ||||
The accumulated benefit obligation (ABO) for all pension plans was $53,513 and $47,549 at December 31, 2010 and 2009. Key information for our plans with ABO in excess of plan assets as of December 31 is as follows:
| 2010 | 2009 | |||||||
Projected benefit obligation | $ | 58,772 | $ | 26,141 | ||||
Accumulated benefit obligation | 53,202 | 24,227 | ||||||
Fair value of plan assets | 48,926 | 22,205 | ||||||
The Medicare Prescription Drug, Improvement and Modernization Act of 2003 reduced our APBO by $60 and $497 at December 31, 2010 and 2009. These reductions/actuarial gains are amortized over the expected average future service of current employees.
Patient Protection and Affordable Care Act, as modified by the Health Care and Education Reconciliation Act of 2010 increased our APBO by $300 at December 31, 2010. This includes the impact of the excise tax on high cost health plans scheduled to become payable beginning in 2018. This increase is recognized as an actuarial loss and is amortized over the expected future service of current employees.
Assumptions
The following assumptions, which are the weighted average for all plans, are used to calculate the benefit obligation at December 31 of each year and the net periodic benefit cost for the subsequent year.
| December 31, | 2010 | 2009 | 2008 | |||||||||
Discount rate: | ||||||||||||
Pension | 5.30 | % | 5.80 | % | 6.10 | % | ||||||
Other postretirement benefits | 4.90 | % | 5.40 | % | 6.00 | % | ||||||
Expected return on plan assets | 7.75 | % | 8.00 | % | 8.00 | % | ||||||
Rate of compensation increase | 5.20 | % | 5.50 | % | 5.50 | % | ||||||
The discount rate for each plan is determined based on the plans' expected future benefit payments using a yield curve developed from high quality bonds that are rated as Aa or better by Moody's as of the measurement date. The yield curve is fitted to yields developed from bonds at various maturity points. Bonds with the ten percent highest and the ten percent lowest yields are omitted. A portfolio of about 400 bonds is used to construct the yield curve. Since corporate bond yields are generally not available at maturities beyond 30 years, it is assumed that spot rates will remain level beyond that 30-year point. The present value of each plan's benefits is calculated by applying the spot/discount rates to projected benefit cash flows. All bonds are U.S. issues, with a minimum outstanding of $50.
86
The pension fund's expected return on plan assets assumption is derived from a review of actual historical returns achieved by the pension trust and anticipated future long-term performance of individual asset classes. While consideration is given to recent trust performance and historical returns, the assumption represents a long-term, prospective return. The expected return on plan assets component of the net periodic benefit cost for the upcoming plan year is determined based on the expected return on plan assets assumption and the market-related value of plan assets (MRVA). Since our adoption of the accounting standard for pensions in 1987, we have determined the MRVA based on a five-year moving average of plan assets. As of December 31, 2010, the MRVA is approximately $450 greater than the fair market value of assets.
Assumed health care cost trend rates were as follows:
| December 31, | 2010 | 2009 | 2008 | |||||||||
Health care cost trend rate assumed next year | 7.50 | % | 7.00 | % | 7.50 | % | ||||||
Ultimate trend rate | 5.00 | % | 5.00 | % | 5.00 | % | ||||||
Year that trend reached ultimate rate | 2018 | 2014 | 2014 | |||||||||
Assumed health care cost trend rates have a significant effect on the amounts reported for the health care plans. To determine the health care cost trend rates we look at a combination of information including ongoing claims cost monitoring, annual statistical analyses of claims data, reconciliation of forecast claims against actual claims, review of trend assumptions of other plan sponsors and national health trends, and adjustments for plan design changes, workforce changes, and changes in plan participant behavior. A one-percentage-point change in assumed health care cost trend rates would have the following effect:
| Increase | Decrease | |||||||
Effect on total of service and interest cost | $ | 51 | $ | (44 | ) | |||
Effect on postretirement benefit obligation | 742 | (654 | ) | |||||
Plan Assets
Investment Strategy The overall objective of our pension assets is to earn a rate of return over time to satisfy the benefit obligations of the pension plans and to maintain sufficient liquidity to pay benefits and address other cash requirements of the pension fund. Specific investment objectives for our long-term investment strategy include reducing the volatility of pension assets relative to pension liabilities, achieving a competitive, total investment return, achieving diversification between and within asset classes and managing other risks. Investment objectives for each asset class are determined based on specific risks and investment opportunities identified.
We update our long-term, strategic asset allocations every three-to-five years. We use various analytics to determine the optimal asset mix and consider plan liability characteristics, liquidity characteristics, funding requirements, expected rates of return and the distribution of returns. We identify investment benchmarks for the asset classes in the strategic asset allocation that are market-based and investable where possible.
Actual allocations to each asset class vary from target allocations due to periodic investment strategy changes, market value fluctuations, the length of time it takes to fully implement investment allocation positions (such as private equity and real estate), and the timing of benefit payments and contributions. Short term investments and exchange-traded derivatives are used to rebalance the actual asset allocation to the target asset allocation. The asset allocation is monitored and rebalanced on a monthly basis.
87
The actual allocations for the pension assets at December 31 and target allocations by asset class, are as follows:
| Percentage of Plan Assets | Target Allocations | |||||||||||||||
| Asset Class | 2010 | 2009 | 2010 | 2009 | ||||||||||||
Fixed income | 49 | % | 50 | % | 45 | % | 45 | % | ||||||||
Global equity | 33 | 34 | 28 | 28 | ||||||||||||
Private equity | 5 | 5 | 6 | 6 | ||||||||||||
Real estate and real assets | 5 | 4 | 10 | 10 | ||||||||||||
Global strategies | 4 | 4 | 5 | 5 | ||||||||||||
Hedge funds | 4 | 3 | 6 | 6 | ||||||||||||
Total | 100 | % | 100 | % | 100 | % | 100 | % | ||||||||
Fixed income securities are invested broadly and primarily in long duration instruments. Global equity securities are invested broadly in U.S. and non-U.S. companies which are in various industries and countries and through a range of market capitalizations.
Real estate and real assets include global private investments and publicly traded investments (such as REITs in the case of real estate). Real estate includes but is not limited to investments in office, retail, apartment and industrial properties. Real assets include but are not limited to investments in natural resources (such as energy, farmland and timber) and infrastructure. Private equity investment vehicles are primarily limited partnerships (LPs) and fund-of-funds that mainly invest in U.S. and non-U.S. leveraged buyout, venture capital and special situation strategies.
Global strategies seek to capitalize on inefficiencies identified across different asset classes or markets, primarily using long-short positions in derivatives and physical securities. Hedge fund strategy types include, but are not limited to event driven, relative value, long-short and market neutral. A well-diversified number of hedge funds are held.
Investment managers are retained for explicit investment roles specified by contractual investment guidelines. Certain investment managers are authorized to invest in derivatives, such as equity or bond futures, swaps, options and currency futures or forwards. Derivatives are used to achieve the desired market exposure of a security or an index, transfer value-added performance between asset classes, achieve the desired currency exposure, adjust portfolio duration or rebalance the total portfolio to the target asset allocation.
As a percentage of total plan assets, derivative net notional amounts were 9.8% and 6.0% for fixed income, including to-be-announced mortgage-backed securities and treasury forwards, and negative 0.2% and 0.0% for global equity and currency overlay at December 31, 2010 and 2009.
In November 2009, the Company elected to contribute $1,500 of our common stock to the pension fund. An independent fiduciary was retained to manage and liquidate the stock over time at its discretion. Plan assets included $1,498 and $1,581 of our common stock as of December 31, 2010 and 2009.
Risk Management In managing the plan assets, we review and manage risk associated with funded status risk, interest rate risk, market risk, counterparty risk, liquidity risk and operational risk. Liability management and asset class diversification are central to our risk management approach and are integral to the overall investment strategy. Further, asset classes are constructed to achieve diversification by investment strategy, by investment manager, by industry or sector and by holding. Investment manager guidelines for publicly traded assets are specified and are monitored regularly through the custodian. Credit parameters for counterparties have been established for managers permitted to trade over-the-counter derivatives.
88
Fair Value Measurements The following table presents our plan assets using the fair value hierarchy as of December 31, 2010 and 2009. The fair value hierarchy has three levels based on the reliability of the inputs used to determine fair value. Level 1 refers to fair values determined based on quoted prices in active markets for identical assets. Level 2 refers to fair values estimated using significant other observable inputs, and Level 3 includes fair values estimated using significant non-observable inputs.
| December 31, 2010 | December 31, 2009 | |||||||||||||||||||||||||||||||
| Total | Level 1 | Level 2 | Level 3 | Total | Level 1 | Level 2 | Level 3 | |||||||||||||||||||||||||
Fixed income securities: | ||||||||||||||||||||||||||||||||
Corporate | $ | 13,038 | $ | 13,034 | $ | 4 | $ | 13,259 | $ | 13,254 | $ | 5 | ||||||||||||||||||||
U.S. government and agencies | 3,734 | 3,734 | 3,886 | 3,886 | ||||||||||||||||||||||||||||
Mortgage backed and asset backed | 880 | 847 | 33 | 916 | 893 | 23 | ||||||||||||||||||||||||||
Other | 3,469 | $ | 19 | 3,450 | 2,628 | $ | 19 | 2,609 | ||||||||||||||||||||||||
Derivatives: | ||||||||||||||||||||||||||||||||
Assets | 18 | 18 | 33 | 33 | ||||||||||||||||||||||||||||
Liabilities | (20 | ) | (20 | ) | (93 | ) | (93 | ) | ||||||||||||||||||||||||
Cash equivalents and other short-term investments | 2,781 | 2,342 | 439 | 2,068 | 1,679 | 389 | ||||||||||||||||||||||||||
Currency overlay derivatives: | ||||||||||||||||||||||||||||||||
Assets | 106 | 106 | 107 | 107 | ||||||||||||||||||||||||||||
Liabilities | (121 | ) | (121 | ) | (94 | ) | (94 | ) | ||||||||||||||||||||||||
Equity securities: | ||||||||||||||||||||||||||||||||
U.S. common and preferred stock | 4,925 | 4,925 | 4,691 | 4,691 | ||||||||||||||||||||||||||||
Non-U.S. common and preferred stock | 6,414 | 6,367 | 47 | 6,703 | 6,634 | 69 | ||||||||||||||||||||||||||
Boeing company stock | 1,498 | 1,498 | 1,581 | 1,581 | ||||||||||||||||||||||||||||
Common/collective/pooled funds | 3,097 | 105 | 2,992 | 2,574 | 89 | 2,485 | ||||||||||||||||||||||||||
Derivatives: | ||||||||||||||||||||||||||||||||
Assets | 21 | 21 | 9 | 9 | ||||||||||||||||||||||||||||
Liabilities | (11 | ) | (11 | ) | (10 | ) | (10 | ) | ||||||||||||||||||||||||
Private equity | 2,636 | 10 | 2,626 | 2,300 | 9 | 2,291 | ||||||||||||||||||||||||||
Real estate and real assets | 2,488 | 665 | 5 | 1,818 | 1,784 | 442 | 5 | 1,337 | ||||||||||||||||||||||||
Global strategies | 2,015 | 443 | 1,503 | 69 | 1,676 | 484 | 1,192 | |||||||||||||||||||||||||
Hedge funds | 1,918 | 1,918 | 1,347 | 336 | 1,011 | |||||||||||||||||||||||||||
Total | $ | 48,886 | $ | 16,374 | $ | 26,044 | $ | 6,468 | $ | 45,365 | $ | 15,628 | $ | 25,070 | $ | 4,667 | ||||||||||||||||
Cash | $ | 79 | $ | 125 | ||||||||||||||||||||||||||||
Receivables | 393 | 641 | ||||||||||||||||||||||||||||||
Payables | (106 | ) | (321 | ) | ||||||||||||||||||||||||||||
Total | $ | 49,252 | $ | 45,810 | ||||||||||||||||||||||||||||
Fixed income securities are primarily valued using a market approach with inputs that include broker quotes, benchmark yields, base spreads and reported trades.
Cash equivalents and other short-term investments, which are used to pay benefits, are primarily held in registered money market funds which are valued using a market approach based on the quoted market prices of identical instruments. Other cash equivalent and short-term investments are valued daily by the fund using a market approach with inputs that include quoted market prices for similar instruments.
89
Common and preferred stock equity securities are primarily valued using a market approach based on the quoted market prices of identical instruments. Common/collective/pooled funds are typically common or collective trusts valued at their net asset values (NAVs) that are calculated by the investment manager or sponsor of the fund and have daily or monthly liquidity. Active currency managers, through an overlay program, invest in a broad set of currency derivatives. Derivatives leveled in the table above are over-the-counter and are primarily valued using an income approach with inputs that include benchmark yields, swap curves, cash flow analysis, rating agency data and interdealer broker rates. Exchange-traded derivative positions are reported in accordance with changes in daily variation margin which is settled daily and therefore reflected in the payables and receivables portion of the table.
Private equity LP valuations are reported by the fund manager and are based on the valuation of the underlying investments, which include inputs such as cost, operating results, discounted future cash flows and market based comparable data.
Real estate and real asset fund values are primarily reported by the fund manager and are based on valuation of the underlying investments, which include inputs such as cost, discounted future cash flows, independent appraisals and market based comparable data. Publically traded REITs are valued using a market approach based on quoted market prices of identical instruments.
Global strategies are primarily limited liability company (LLC) or mutual fund structures. The LLCs are primarily valued using a market approach based on NAVs calculated by the fund and have monthly liquidity. Global strategies mutual funds are valued using a market approach based on the quoted market prices of identical instruments.
Hedge funds consist of fund-of-fund LLC or commingled fund structures and direct hedge funds. The LLCs are primarily valued using a market approach based on NAVs calculated by the fund and are not publicly available. Liquidity for the LLCs is monthly and is subject to liquidity of the underlying hedge funds. The commingled fund NAV is calculated by the manager on a daily basis and has monthly liquidity. Direct hedge funds are primarily valued by each fund's third party administrator based on valuation of the underlying securities and instruments and primarily applying a market or income valuation methodology depending on the specific type of security or instrument, equity, fixed income, currency or derivative, held; inputs for each of these investment types are discussed earlier. Direct hedge fund NAVs based on valuation of the underlying holdings are not publicly available and have monthly liquidity.
Some of our assets, primarily our private equity, real estate and real assets, hedge funds and global strategies, do not have readily determinable market values given the specific investment structures involved and the nature of the underlying investments. For the December 31, 2010 and 2009 plan asset reporting, publicly traded asset pricing was used where possible. For assets without readily determinable values, estimates were derived from investment manager discussions focusing on underlying fundamentals and significant events. For those investments reported on a one-quarter lagged basis (primarily LPs) we use net asset values, adjusted for subsequent cash flows and significant events.
90
The following tables present a reconciliation of Level 3 assets held during the year ended December 31, 2010 and 2009. Beginning for the year ended December 31, 2010, transfers into and out of Level 3 are treated as beginning of year values.
| January 1, 2010 Balance | Net Realized and Unrealized Gains/(Losses) | Net Purchases, Issuances and Settlements | Net Transfers Into/(Out of) Level 3 | December 31, 2010 Balance | ||||||||||||||||
Fixed income securities: | ||||||||||||||||||||
Corporate | $ | 5 | $ | (1 | ) | $ | 4 | |||||||||||||
Mortgage backed and asset backed | 23 | $ | (1 | ) | 15 | $ | (4 | ) | 33 | |||||||||||
Private equity | 2,291 | 379 | (44 | ) | 2,626 | |||||||||||||||
Real estate and real assets | 1,337 | 157 | 324 | 1,818 | ||||||||||||||||
Global strategies | (1 | ) | $ | 70 | 69 | |||||||||||||||
Hedge funds | 1,011 | 92 | $ | 815 | 1,918 | |||||||||||||||
Total | $ | 4,667 | $ | 626 | $ | 1,179 | $ | (4 | ) | $ | 6,468 | |||||||||
For the year ended December 31, 2010, the change in unrealized gain/(loss) for Level 3 assets still held at December 31, 2010 were $1 for Mortgage backed and asset backed securities, $397 for Private equity, $136 for Real estate and real assets, $(1) for Global Strategies and $92 for Hedge funds.
| January 1, 2009 Balance | Net Realized and Unrealized Gains/(Losses) | Net Purchases, Issuances and Settlements | Net Transfers Into/(Out of) Level 3 | December 31, 2009 Balance | ||||||||||||||||
Fixed income securities: | ||||||||||||||||||||
Corporate | $ | 9 | $ | (4 | ) | $ | 5 | |||||||||||||
Mortgage backed and asset backed | 49 | $ | 1 | (32 | ) | $ | 5 | 23 | ||||||||||||
Private equity | 2,020 | 142 | 129 | 2,291 | ||||||||||||||||
Real estate and real assets | 1,629 | (505 | ) | 213 | 1,337 | |||||||||||||||
Hedge funds | 885 | 126 | 1,011 | |||||||||||||||||
Total | $ | 4,592 | $ | (236 | ) | $ | 306 | $ | 5 | $ | 4,667 | |||||||||
OPB Plan Assets The majority of OPB plan assets are invested in a balanced index fund which is comprised of approximately 60% equities and 40% debt securities. The index fund is valued using a market approach based on the quoted market price of an identical instrument (Level 1). The expected rate of return on these assets does not have a material effect on the net periodic benefit cost.
Cash Flows
Contributions Required pension contributions under the Employee Retirement Income Security Act (ERISA) as well as rules governing funding of our non-U.S. pension plans, are not expected to be material in 2011. In 2011 we expect to make discretionary contributions to our plans of approximately $500. We expect that if interest rates remain at their current levels, discount rates for ERISA determinations will likely decline in future years because of retrospective averaging, and as a result, contributions in future years are expected to increase. We expect to contribute approximately $15 to our OPB plans in 2011.
91
Estimated Future Benefit Payments The table below reflects the total pension benefits expected to be paid from the plans or from our assets, including both our share of the benefit cost and the participants' share of the cost, which is funded by participant contributions. OPB payments reflect our portion only.
| Year(s) | 2011 | 2012 | 2013 | 2014 | 2015 | 2016–2020 | ||||||||||||||||||
Pensions | $ | 2,731 | $ | 2,848 | $ | 2,992 | $ | 3,145 | $ | 3,279 | $ | 18,712 | ||||||||||||
Other postretirement benefits: | ||||||||||||||||||||||||
Gross benefits paid | 553 | 568 | 592 | 620 | 645 | 3,659 | ||||||||||||||||||
Medicare Part D subsidy | (31 | ) | (32 | ) | (33 | ) | (34 | ) | (35 | ) | (177 | ) | ||||||||||||
Net other postretirement benefits | $ | 522 | $ | 536 | $ | 559 | $ | 586 | $ | 610 | $ | 3,482 | ||||||||||||
Termination Provisions
Certain of the pension plans provide that, in the event there is a change in control of the Company which is not approved by the Board of Directors and the plans are terminated within five years thereafter, the assets in the plan first will be used to provide the level of retirement benefits required by ERISA, and then any surplus will be used to fund a trust to continue present and future payments under the postretirement medical and life insurance benefits in our group insurance benefit programs.
We have an agreement with the U.S. government with respect to certain pension plans. Under the agreement, should we terminate any of the plans under conditions in which the plan's assets exceed that plan's obligations, the U.S. government will be entitled to a fair allocation of any of the plan's assets based on plan contributions that were reimbursed under U.S. government contracts.
401(k) Plans
We provide certain defined contribution plans to all eligible employees. The principal plans are the Company-sponsored 401(k) plans. The expense for these defined contribution plans was $614, $591 and $571 in 2010, 2009 and 2008, respectively.
Note 15 – Share-Based Compensation and Other Compensation Arrangements
Share-Based Compensation
Our 2003 Incentive Stock Plan, as amended on April 27, 2009, permits awards of incentive stock options, nonqualified stock options, restricted stock, stock units, Performance Shares, performance units and other incentives to our employees, officers, consultants and independent contractors. The aggregate number of shares of our stock available for issuance under the amended plan will not exceed 80,000,000 and no more than an aggregate of 16,000,000 shares are available for issuance as restricted stock awards.
Shares issued as a result of stock option exercises or conversion of stock unit awards will be funded out of treasury shares, except to the extent there are insufficient treasury shares, in which case new shares will be issued. We believe we currently have adequate treasury shares to meet any requirements to issue shares during 2011.
92
Share-based plans expense is primarily included in general and administrative expense since it is incentive compensation issued primarily to our executives. The share-based plans expense and related income tax benefit follow:
| Years ended December 31, | 2010 | 2009 | 2008 | |||||||||
Stock options | $ | 96 | $ | 111 | $ | 119 | ||||||
Restricted stock units and other awards | 83 | 56 | 29 | |||||||||
ShareValue Trust | 36 | 71 | 61 | |||||||||
Share-based plans expense | $ | 215 | $ | 238 | $ | 209 | ||||||
Income tax benefit | $ | 83 | $ | 89 | $ | 79 | ||||||
Stock Options
On February 22, 2010, February 23, 2009 and February 25, 2008, we granted to our executives 5,932,806, 7,423,242 and 6,411,300 options, respectively. The options have been granted with an exercise price equal to the fair market value of our stock on the date of grant and expire ten years after the date of grant. The stock options granted after 2005 vest over a period of three years, with 34% vesting after the first year, 33% vesting after the second year and the remaining 33% vesting after the third year. If an executive terminates employment for any reason, the non-vested portion of the stock option will not vest and all rights to the non-vested portion will terminate completely.
Stock option activity for the year ended December 31, 2010 is as follows:
| Shares | Weighted Average Exercise Price Per Share | Weighted Average Remaining Contractual Life (years) | Aggregate Intrinsic Value | |||||||||||||
Number of shares under option: | ||||||||||||||||
Outstanding at beginning of year | 26,336,436 | $ | 63.93 | |||||||||||||
Granted | 6,079,675 | 63.95 | ||||||||||||||
Exercised | (2,123,236 | ) | 40.96 | |||||||||||||
Forfeited | (1,159,701 | ) | 55.84 | |||||||||||||
Expired | (157,732 | ) | 59.35 | |||||||||||||
Outstanding at end of year | 28,975,442 | $65.96 | 6.9 | $ | 238 | |||||||||||
Exercisable at end of year | 17,262,715 | $ | 72.28 | 5.7 | $ | 105 | ||||||||||
The total intrinsic value of options exercised was $59, $2 and $22 during the years ended December 31, 2010, 2009 and 2008, respectively. Cash received from options exercised for the years ended December 31, 2010, 2009 and 2008 was $87, $10 and $44 with a related tax benefit of $20, $1 and $6, respectively, derived from the compensation deductions resulting from these option exercises. At December 31, 2010, there was $85 of total unrecognized compensation cost related to the Stock Option plan which is expected to be recognized over a weighted average period of 1.7 years. The total fair value of stock options vested during the years ended December 31, 2010, 2009 and 2008 was $103, $114 and $82, respectively.
93
The fair values of options were estimated using the Black-Scholes option-pricing model with the following assumptions:
Grant Year | Grant Date | Expected Life | Expected Volatility | Dividend Yield | Risk Free Interest Rate | Weighted-Average Grant Date Fair Value Per Share | ||||||||||||||||||
2010 | 2/22/10 | 6 years | 31.5 | % | 3.0 | % | 2.9 | % | $ | 15.70 | ||||||||||||||
2009 | 2/23/09 | 6 years | 39.0 | % | 2.4 | % | 2.0 | % | 11.12 | |||||||||||||||
2008 | 2/25/08 | 6 years | 28.8 | % | 1.7 | % | 3.2 | % | 23.47 | |||||||||||||||
The expected volatility of the stock options is based on a combination of our historical stock volatility and the volatility levels implied on the grant date by actively traded option contracts on our common stock. We determined the expected term of the stock option grants to be six years, calculated using the "simplified" method in accordance with the SEC Staff Accounting Bulletin 110. We use the "simplified" method since we changed the vesting terms, tax treatment and the recipients of our stock options beginning in 2006 such that we believe our historical data no longer provides a reasonable basis upon which to estimate expected term.
Restricted Stock Units
On February 22, 2010, we granted to our executives 1,459,256 restricted stock units (RSUs) as part of our long-term incentive program with a grant date fair value of $63.83 per share. On February 23, 2009, we granted to our executives 2,144,501 RSUs, with a fair value of $35.57 per share. The RSUs vest on the third anniversary of the grant date. If an executive terminates employment because of retirement, involuntary layoff, disability, or death, the employee (or beneficiary) will immediately vest on a proration of stock units based on active employment during the three-year performance period. In all other cases, the RSUs will not vest and all rights to the stock units will terminate completely.
In addition to RSUs awarded under our long-term incentive program, we grant RSUs to certain executives and employees to encourage retention or to reward various achievements. These RSUs are labeled other restricted stock units in the table below. The fair values of all RSUs are estimated using the average stock price on the date of grant. Stock units settle in common stock on a one-for-one basis and are not contingent upon stock price.
Stock unit activity for the year ended December 31, 2010 is as follows:
| Incentive Program Restricted Stock Units | Other Restricted Stock Units | |||||||
Number of units: | ||||||||
Outstanding at beginning of year | 2,111,392 | 1,849,278 | ||||||
Granted | 1,496,629 | 336,574 | ||||||
Dividends | 80,631 | 45,753 | ||||||
Forfeited | (187,135 | ) | (36,773 | ) | ||||
Distributed | (75,717 | ) | (492,881 | ) | ||||
Outstanding at end of year | 3,425,800 | 1,701,951 | ||||||
Unrecognized compensation cost at December 31, 2010 | $ | 78 | $ | 36 | ||||
Weighted average remaining contractual life (years) | 1.9 | 2.1 | ||||||
94
ShareValue Trust
The ShareValue Trust, established July 1, 1996, was a 14-year irrevocable trust that held shares of our common stock, received dividends, and distributed to employees the appreciation in value above a 3% per annum threshold rate of return at the end of each period. At June 30, 2010, the appreciation in stock price did not exceed the threshold, and no distribution was triggered for the final period of the trust. This was the final investment period of the trust, and no potential distributions remain. The trust was terminated effective July 1, 2010 with the 29,948,920 undistributed shares returned to the Company. Deferred tax assets of $229 related to the undistributed shares were written off at June 30, 2010, offset against previous excess tax benefits recorded in Additional paid-in capital.
Other Compensation Arrangements
Performance Awards
Performance Awards are cash units that pay out based on the achievement of long-term financial goals at the end of a three-year period. Each unit has an initial value of $100 dollars per unit. The amount payable at the end of the three-year performance period may be anywhere from $0 to $200 dollars per unit, depending on the Company's performance against plan for a three-year period. The Compensation Committee has the discretion to pay these awards in cash, stock, or a combination of both after the three-year performance period. Compensation expense, based on the estimated performance payout, is recognized ratably over the performance period.
During 2010, 2009 and 2008, we granted Performance Awards to our executives with the payout based on the achievement of financial goals for each three-year period following the grant date. The minimum payout amount is $0 and the maximum amount we could be required to pay out for the 2010 and 2009 Performance Awards is $250 and $290. There will be no payout of the 2008 Performance Awards.
Deferred Compensation
The Company has a deferred compensation plan which permits executives to defer receipt of a portion of their salary, bonus, and certain other incentive awards. Prior to May 1, 2006, employees who participated in the deferred compensation plan could choose to defer in either an interest earning account or a Boeing stock unit account. Effective May 1, 2006, participants can diversify deferred compensation among 19 investment funds including the interest earning account and the Boeing stock unit account.
Total expense/(income) related to deferred compensation was $112, $158 and ($223) in 2010, 2009 and 2008, respectively. Additionally, for employees who elected to defer their compensation in stock units prior to January 1, 2006, the Company matched 25% of the deferral with additional stock units. Effective January 1, 2006, all matching contributions are settled in stock upon retirement. As of December 31, 2010 and 2009, the deferred compensation liability which is being marked to market was $1,149 and $1,143.
Note 16 – Shareholders' Equity
On October 29, 2007, the Board approved the repurchase of up to $7,000 of common stock (the Program). Unless terminated earlier by a Board resolution, the Program will expire when we have used all authorized funds for repurchase. At December 31, 2010, $3,610 in shares may still be purchased under the Program.
As of December 31, 2010 and 2009, there were 1,200,000,000 shares of common stock and 20,000,000 shares of preferred stock authorized. No preferred stock has been issued.
95
Changes in Share Balances
The following table shows changes in each class of shares:
| Common Stock | Treasury Stock | ShareValue Trust | ||||||||||
Balance January 1, 2008 | 1,012,261,159 | 244,217,170 | 31,362,850 | |||||||||
Issued | (629,111 | ) | ||||||||||
Acquired | 42,073,885 | 658,582 | ||||||||||
Payout | (3,560,663 | ) | ||||||||||
Balance December 31, 2008 | 1,012,261,159 | 285,661,944 | 28,460,769 | |||||||||
Issued | (30,428,387 | ) | ||||||||||
Acquired | 1,173,152 | 1,102,555 | ||||||||||
Balance December 31, 2009 | 1,012,261,159 | 256,406,709 | 29,563,324 | |||||||||
Issued | (9,353,570 | ) | ||||||||||
Acquired | 385,596 | |||||||||||
ShareValue Trust termination | 29,948,920 | (29,948,920 | ) | |||||||||
Balance December 31, 2010 | 1,012,261,159 | 277,002,059 | ||||||||||
Accumulated Other Comprehensive Loss
The components of Accumulated other comprehensive loss at December 31 were as follows:
| 2010 | 2009 | |||||||
Pension and postretirement adjustments | $ | (14,079 | ) | $ | (12,154 | ) | ||
Unrealized gains on derivative instruments, net of reclassification adjustments | 95 | 67 | ||||||
Unrealized losses on certain investments, net of reclassification adjustments | (6 | ) | (6 | ) | ||||
Foreign currency translation adjustments | 232 | 216 | ||||||
Accumulated other comprehensive loss | $ | (13,758 | ) | $ | (11,877 | ) | ||
Note 17 – Derivative Financial Instruments
Cash Flow Hedges
Our cash flow hedges include foreign currency forward contracts, foreign currency option contracts, commodity swaps, and commodity purchase contracts. We use foreign currency forward and option contracts to manage currency risk associated with certain transactions, specifically forecasted sales and purchases made in foreign currencies. Our foreign currency contracts hedge forecasted transactions principally occurring within five years in the future, with certain contracts hedging transactions up to 2021. We use commodity derivatives, such as swaps and fixed-price purchase commitments, to hedge against potentially unfavorable price changes for items used in production. These include commitments to purchase electricity at fixed prices through 2016.
Fair Value Hedges
Interest rate swaps under which we agree to pay variable rates of interest are designated as fair value hedges of fixed-rate debt. The net change in fair value of the derivatives and the hedged items is reported in Boeing Capital Corporation interest expense.
96
Derivative Instruments Not Receiving Hedge Accounting Treatment
We also hold certain derivative instruments, primarily foreign currency forward contracts, for risk management purposes but without electing any form of hedge accounting.
Notional Amounts and Fair Values
The notional amounts and fair values of derivative instruments in the Consolidated Statements of Financial Position as of December 31 were as follows:
Notional amounts (1) | Other assets | Other accrued liabilities | ||||||||||||||||||||||
| 2010 | 2009 | 2010 | 2009 | 2010 | 2009 | |||||||||||||||||||
Derivatives designated as hedging instruments: | ||||||||||||||||||||||||
Foreign exchange contracts | $ | 2,001 | $ | 2,353 | $ | 266 | $ | 233 | $ | (15 | ) | $ | (22 | ) | ||||||||||
Interest rate contracts | 875 | 1,475 | 24 | 32 | (18 | ) | ||||||||||||||||||
Commodity contracts | 144 | 189 | (113 | ) | (88 | ) | ||||||||||||||||||
Derivatives not receiving hedge accounting treatment: | ||||||||||||||||||||||||
Foreign exchange contracts | 646 | 693 | 8 | 32 | (58 | ) | (99 | ) | ||||||||||||||||
Total derivatives | 3,666 | 4,710 | 298 | 297 | (186 | ) | (227 | ) | ||||||||||||||||
Netting arrangements | (71 | ) | (119 | ) | 71 | 119 | ||||||||||||||||||
Net recorded balance | $ | 227 | $ | 178 | $ | (115 | ) | $ | (108 | ) | ||||||||||||||
| (1) | Notional amounts represent the gross contract/notional amount of the derivatives outstanding. |
Gains/(losses) associated with our cash flow and undesignated hedging transactions and their effect on other comprehensive loss and Net earnings were as follows:
| Years ended December 31, | 2010 | 2009 | ||||||
Effective portion recognized in other comprehensive loss, net of taxes: | ||||||||
Foreign exchange contracts | $ | 67 | $ | 180 | ||||
Commodity contracts | (30 | ) | (24 | ) | ||||
Undesignated derivatives recognized in Other income/(expense), net: | ||||||||
Foreign exchange contracts | (33 | ) | (9 | ) | ||||
For the year ended December 31, 2010, we reclassified a net gain of $14 (pre-tax) from Accumulated other comprehensive loss to earnings. Based on our portfolio of cash flow hedges, we expect to reclassify gains of $22 (pre-tax) during the next 12 months. Ineffectiveness related to our hedges was insignificant for the years ended December 31, 2010 and 2009.
We have derivative instruments with credit-risk-related contingent features. For foreign exchange contracts with original maturities of at least five years, our derivative counterparties could require settlement if we default on our five-year credit facility, expiring November 2012. For commodity contracts, our counterparties could require collateral posted in an amount determined by our credit ratings. The fair value of foreign exchange and commodity contracts that have credit-risk-related contingent features that are in a net liability position at December 31, 2010 was $78. At December 31, 2010, there was no collateral posted related to our derivatives.
97
Note 18 – Significant Group Concentrations of Risk
Credit Risk
Financial instruments involving potential credit risk are predominantly with commercial aircraft customers and the U.S. government. Of the $10,496 in gross accounts receivable and gross customer financing included in the Consolidated Statements of Financial Position as of December 31, 2010, $4,996 related to commercial aircraft customers ($570 of accounts receivable and $4,426 of customer financing) and $2,969 related to the U.S. government. Of the $5,033 in gross customer financing, $4,310 related to customers we believe have less than investment-grade credit. AirTran Airways, American Airlines, Continental Airlines and Hawaiian Airlines were associated with 27%, 16%, 9% and 8%, respectively, of our financing portfolio. Financing for aircraft is collateralized by security in the related asset. As of December 31, 2010, there was $9,865 of financing commitments related to aircraft on order including options and proposed as part of sales campaigns described in Note 11, of which $8,490 related to customers we believe have less than investment-grade credit.
BDS Fixed-Price Development Contracts
Fixed-price development work is inherently uncertain and subject to significant variability in estimates of the cost and time required to complete the work. Significant BDS fixed-price development contracts include AEW&C, P-8I, KC-767 International Tanker and commercial and military satellites. The operational and technical complexities of these contracts create financial risk, which could trigger termination provisions, order cancellations or other financially significant exposure. Changes to cost and revenue estimates could also result in lower margins or a material charge for reach-forward losses in 2011.
Commercial Airplane Development Programs
Significant risks are inherent throughout the development of new commercial airplanes and new commercial airplane derivatives. Currently both the 787-8 and 747-8 freighter are in the demanding flight test and certification stages of program development. The 787-9 and 747-8 Intercontinental airplanes are also in development. These programs require substantial investments and research and development as well as investments in working capital and infrastructure. They also entail significant commitments to customers and suppliers and require substantial internal resources. Performance issues on these programs could have a material adverse impact on our consolidated results and financial position in 2011.
Other Risk
As of December 31, 2010, approximately 36% of our total workforce was represented by collective bargaining agreements and approximately 1% of our total workforce was represented by agreements expiring during 2011.
98
Note 19 – Fair Value Measurements
The following tables present our assets and liabilities that are measured at fair value on a recurring basis and are categorized using the fair value hierarchy. The fair value hierarchy has three levels based on the reliability of the inputs used to determine fair value. Level 1 refers to fair values determined based on quoted prices in active markets for identical assets. Level 2 refers to fair values estimated using significant other observable inputs and Level 3 includes fair values estimated using significant non-observable inputs.
| December 31, 2010 | December 31, 2009 | |||||||||||||||||||||||||||||||
| Total | Level 1 | Level 2 | Level 3 | Total | Level 1 | Level 2 | Level 3 | |||||||||||||||||||||||||
Assets | ||||||||||||||||||||||||||||||||
Money market funds | $ | 3,337 | $ | 3,337 | $ | 3,575 | $ | 3,575 | ||||||||||||||||||||||||
Available-for-sale investments: | ||||||||||||||||||||||||||||||||
Debt | $ | 5 | $ | 5 | 112 | $ | 107 | $ | 5 | |||||||||||||||||||||||
Equity | 10 | 10 | 27 | 27 | ||||||||||||||||||||||||||||
Derivatives | 227 | $ | 227 | 178 | 178 | |||||||||||||||||||||||||||
Total assets | $ | 3,579 | $ | 3,347 | $ | 227 | $ | 5 | $ | 3,892 | $ | 3,602 | $ | 285 | $ | 5 | ||||||||||||||||
Liabilities | ||||||||||||||||||||||||||||||||
Derivatives | $ | (115 | ) | $ | (115 | ) | $ | (108 | ) | $ | (108 | ) | ||||||||||||||||||||
Total liabilities | $ | (115 | ) | $ | (115 | ) | $ | (108 | ) | $ | (108 | ) | ||||||||||||||||||||
Money market funds and equity securities are valued using a market approach based on the quoted market prices of identical instruments. Available-for-sale debt investments are primarily valued using a market approach based on benchmark yields, reported trades and broker/dealer quotes.
Derivatives include foreign currency, commodity and interest rate contracts. Our foreign currency forward contracts are valued using an income approach based on the present value of the forward rate less the contract rate multiplied by the notional amount. Commodity derivatives are valued using an income approach based on the present value of the commodity index prices less the contract rate multiplied by the notional amount. The fair value of our interest rate swaps is derived from a discounted cash flow analysis based on the terms of the contract and the interest rate curve.
Certain assets have been measured at fair value on a nonrecurring basis using significant unobservable inputs (Level 3). The table below presents the nonrecurring losses recognized for the years ended December 31, and the carrying value and asset classification of the related assets still held as of December 31:
| 2010 | 2009 | |||||||||||||||
| Carrying Value | Total Losses | Carrying Value | Total Losses | |||||||||||||
Operating lease equipment | $ | 247 | $ | (143 | ) | $ | 199 | $ | (75 | ) | ||||||
Property, plant and equipment | (4 | ) | 13 | (13 | ) | |||||||||||
Receivables | 1 | (6) | ||||||||||||||
Total | $ | 247 | $ | (147 | ) | $ | 213 | $ | (94 | ) | ||||||
The operating lease equipment was valued using a market approach based on the fair value for the related aircraft. The property, plant and equipment was valued using an income approach based on the discounted cash flows associated with the underlying equipment.
99
Fair Value Disclosures
The following table presents our financial assets and liabilities that are not measured at fair value on a recurring basis. The carrying amounts and estimated fair values were as follows at December 31:
| 2010 | 2009 | |||||||||||||||
| Carrying Amount | Fair Value | Carrying Amount | Fair Value | |||||||||||||
Assets | ||||||||||||||||
Accounts receivable, net | $ | 5,422 | $ | 5,283 | $ | 5,785 | $ | 5,658 | ||||||||
Notes receivable | 480 | 501 | 1,045 | 1,072 | ||||||||||||
Liabilities | ||||||||||||||||
Debt, excluding capital lease obligations | (12,234 | ) | (13,525 | ) | (12,848 | ) | (13,809 | ) | ||||||||
Accounts payable | (7,715 | ) | (7,704 | ) | (7,096 | ) | (7,063 | ) | ||||||||
Residual value, credit and other guarantees | (35 | ) | (15 | ) | (35 | ) | (20 | ) | ||||||||
Contingent repurchase commitments | (7 | ) | (84 | ) | (7 | ) | (63 | ) | ||||||||
The fair values of the Accounts receivable and Accounts payable are based on current market rates for loans of the same risk and maturities. The fair values of our variable rate notes receivable that reprice frequently approximate their carrying amounts. The fair values of fixed rate notes receivable are estimated using discounted cash flow analysis using interest rates currently offered on loans with similar terms to borrowers of similar credit quality. The fair value of our debt is based on current market yields for our debt traded in the secondary market. The fair values of the residual value guarantees and contingent repurchase commitments are determined using a Black Futures Options formula and include such assumptions as the expected value of the aircraft on the settlement date, volatility of aircraft prices, time until settlement and the risk free discount rate. The fair value of the credit guarantees is estimated based on the expected cash flows of those commitments, given the creditor's probability of default, and discounted using the risk free rate. With regard to financial instruments with off-balance sheet risk, it is not practicable to estimate the fair value of future financing commitments because the amount and timing of funding those commitments are uncertain.
Note 20 – Legal Proceedings
Various legal proceedings, claims and investigations related to products, contracts and other matters are pending against us. Potentially material contingencies are discussed below.
We are subject to various U.S. government investigations, from which civil, criminal or administrative proceedings could result or have resulted. Such proceedings involve or could involve claims by the government for fines, penalties, compensatory and treble damages, restitution and/or forfeitures. Under government regulations, a company, or one or more of its operating divisions or subdivisions, can also be suspended or debarred from government contracts, or lose its export privileges, based on the results of investigations. We believe, based upon current information, that the outcome of any such government disputes and investigations will not have a material adverse effect on our financial position, results of operations, or cash flows, except as set forth below. Unless otherwise indicated below, a range of loss associated with any individual legal proceeding set forth below cannot be estimated.
A-12 Litigation
In 1991, the Department of the Navy (the Navy) notified McDonnell Douglas Corporation (now merged into The Boeing Company) and General Dynamics Corporation (together, the Team) that it was terminating for default the Team's contract for development and initial production of the A-12 aircraft.
100
The Team had full responsibility for performance of the contract and both contractors are jointly and severally liable for any potential liabilities resulting from the termination. The Team filed a legal action to contest the Navy's default termination, to assert its rights to convert the termination to one for "the convenience of the government," and to obtain payment for work done and costs incurred on the A-12 contract but not paid to date. As of December 31, 2010, inventories included approximately $586 of recorded costs on the A-12 contract, against which we have established a loss provision of $350. The amount of the provision, which was established in 1990, was based on McDonnell Douglas Corporation's belief, supported by an opinion of outside counsel, that the termination for default would be converted to a termination for convenience, and that the best estimate of possible loss on termination for convenience was $350.
On August 31, 2001, the U.S. Court of Federal Claims issued a decision after trial upholding the government's default termination of the A-12 contract. In 2003, the Court of Appeals for the Federal Circuit, finding that the trial court had applied the wrong legal standard, vacated the trial court's 2001 decision and ordered the case sent back to the trial court for further proceedings. On May 3, 2007, the U.S. Court of Federal Claims issued a decision upholding the government's default termination of the A-12 contract. We filed a Notice of Appeal on May 4, 2007 with the Court of Appeals for the Federal Circuit. On June 2, 2009, the Court of Appeals rendered an opinion affirming the trial court's 2007 decision sustaining the government's default termination. On August 14, 2009, we filed a Combined Petition for Panel Rehearing and for Rehearing En Banc in the Court of Appeals for the Federal Circuit. On November 24, 2009, the Court denied our Combined Petition. On September 28, 2010, the U.S. Supreme Court granted our request to review the decision of the Court of Appeals. Oral argument was held before the Supreme Court on January 18, 2011. We expect the U.S. Supreme Court to render a decision in the case in 2011. On December 29, 2009, the Navy sent letters to the Team requesting payment of $1,352 in unliquidated progress payments, plus applicable interest. On February 19, 2010, the Navy sent a letter confirming that it would not pursue payment from the Team pending the U.S. Supreme Court's review of this matter.
We believe that the termination for default is contrary to law and fact and that the loss provision established by McDonnell Douglas Corporation in 1990, which was supported by an opinion from outside counsel, continues to provide adequately for the reasonably possible reduction in value of A-12 net contracts in process as of December 31, 2010. Final resolution of the A-12 litigation will depend on the outcome of further proceedings or possible negotiations with the U.S. government. If after reviewing the Court of Appeals' decision, the U.S. Supreme Court determines, contrary to our belief, that a termination for default was appropriate, we could incur an additional loss of up to $275, consisting principally of $236 of remaining inventory costs. If the courts further hold that a money judgment should be entered against the Team, we could be required to pay the U.S. government up to one-half of the unliquidated progress payments of $1,350 plus statutory interest from February 1991 (currently totaling up to $1,530). In that event, our loss would total approximately $1,711 in pre-tax charges. Should, however, the March 31, 1998 judgment of the U.S. Court of Federal Claims in favor of the Team be reinstated, we could be entitled to receive payment of approximately $1,163, including interest from June 26, 1991.
Employment and Benefits Litigation
We have been named as a defendant in two pending class action lawsuits filed in the U.S. District Court for the District of Kansas, each related to the 2005 sale of our former Wichita facility to Spirit AeroSystems, Inc. (Spirit). The first action involves allegations that Spirit's hiring decisions following the sale were tainted by age discrimination, violated the Employee Retirement Income Security Act (ERISA), violated our collective bargaining agreements, and constituted retaliation. The case was brought in 2006 as a class action on behalf of individuals not hired by Spirit. During the second quarter of 2010, the court granted summary judgment in favor of Boeing and Spirit on all class action claims.
101
During the third quarter of 2010, plaintiffs filed a motion seeking reconsideration of the summary judgment decision.
The second action, initiated in 2007, alleges collective bargaining agreement breaches and ERISA violations in connection with alleged failures to provide benefits to certain former employees of the Wichita facility. Discovery in the case is ongoing. Spirit has agreed to indemnify Boeing for any and all losses in the first action, with the exception of claims arising from employment actions prior to January 1, 2005. While Spirit has acknowledged a limited indemnification obligation in the second action, we believe that Spirit is obligated to indemnify Boeing for any and all losses in the second action.
On October 13, 2006, we were named as a defendant in a lawsuit filed in the U.S. District Court for the Southern District of Illinois. Plaintiffs, seeking to represent a class of similarly situated participants and beneficiaries in the Boeing Company Voluntary Investment Plan (the VIP), alleged that fees and expenses incurred by the VIP were and are unreasonable and excessive, not incurred solely for the benefit of the VIP and its participants, and were undisclosed to participants. The plaintiffs further alleged that defendants breached their fiduciary duties in violation of §502(a)(2) of ERISA, and sought injunctive and equitable relief pursuant to §502(a)(3) of ERISA. During the first quarter of 2010, the Seventh Circuit Court of Appeals granted a stay of trial proceedings in the district court pending resolution of an appeal made by Boeing in 2008 to the case's class certification order. On January 21, 2011, the Seventh Circuit reversed the district court's class certification order and decertified the class. The Seventh Circuit remanded the case to the district court for further proceedings.
BSSI/ICO Litigation
On August 16, 2004, our wholly-owned subsidiary, Boeing Satellite Systems International, Inc. (BSSI) filed a complaint for declaratory relief against ICO Global Communications (Operations), Ltd. (ICO) in Los Angeles County Superior Court seeking a declaration that ICO's prior termination of two contracts for convenience extinguished all claims between the parties. On September 16, 2004, ICO filed a cross-complaint alleging breach of contract, economic duress, fraud, unfair competition, and other claims. ICO added The Boeing Company as a defendant in October 2005 to some of these claims and for interference with contract and misappropriation of trade secrets. On January 13, 2006, BSSI filed a cross-complaint against ICO, ICO Global Communications (Holdings) Limited (ICO Holdings), ICO's parent, and Eagle River Investments, LLC, parent of both ICO and ICO Holdings, alleging fraud and other claims. The trial commenced on June 19, 2008, with ICO seeking to recover approximately $2,000 in damages, including all monies paid to BSSI and Boeing Launch Services, plus punitive damages and other unspecified damages and relief.
On October 21, 2008, the jury returned a verdict awarding ICO compensatory damages of $371 plus interest, based upon findings of contract breach, fraud and interference with contract. On October 31, 2008, the jury awarded ICO punitive damages of $236. On January 2, 2009, the court entered judgment for ICO in the amount of $631 which included $24 in prejudgment interest.
On February 26, 2009 the trial court granted in part and denied in part post-trial motions we filed seeking to set aside the verdict. As a result, on March 3, 2009, the court entered an amended judgment for ICO in the amount of $604, which included $371 in compensatory damages, $207 in punitive damages and $26 in prejudgment interest. Post-judgment interest will accrue on the judgment at the rate of 10% per year (simple interest) from January 2, 2009. As of December 31, 2010, the amount of post-judgment interest totaled $121.
We filed a notice of appeal and ICO filed a notice of cross-appeal in March 2009. As of November 1, 2010, the appeals were fully briefed. No date has been set by the court for argument. We believe that we have substantial arguments on appeal, which we intend to pursue vigorously.
102
BSSI/Telesat Canada
On November 9, 2006, Telesat Canada (Telesat) and a group of its insurers served BSSI with an arbitration demand alleging breach of contract, gross negligence and willful misconduct in connection with the constructive total loss of Anik F1, a model 702 satellite manufactured by BSSI. Telesat and its insurers initially sought over $385 in damages and $10 in lost profits, but revised their demand to $263. BSSI has asserted a counterclaim against Telesat for $6 in unpaid performance incentive payments and also a $180 contingent counterclaim on the theory that any ultimate award to reimburse the insurers for their payments to Telesat could only result from Telesat's breach of its contractual obligation to obtain a full waiver of subrogation rights barring recourse against BSSI. We believe that the claims asserted by Telesat and its insurers lack merit, but we have notified our insurance carriers of the demand. The arbitration was stayed pending an application by Telesat to the Ontario Superior Court on a preliminary issue. On July 16, 2010, the court denied Telesat's request to exclude certain evidence, but granted its alternative request to remove the Chairperson from the arbitration panel. A new Chairperson was appointed on August 19, 2010, and the stay has been lifted. The arbitration hearing has been rescheduled for April 16, 2012.
On April 26, 2007, a group of our insurers filed a declaratory judgment action in the Circuit Court of Cook County, Illinois asserting certain defenses to coverage and requesting a declaration of their obligation under our insurance and reinsurance policies relating to the Telesat Anik F1 arbitration. On June 12, 2008, the court granted the insurers' motion for summary judgment, concluding that our insurance policy excluded the kinds of losses alleged by Telesat. On January 16, 2009, the court granted Boeing's motion for reconsideration, ruling in favor of Boeing to require the insurers to provide insurance coverage to defend the claim. The case has been stayed pending completion of the underlying arbitration.
Civil Securities Litigation
On November 13, 2009, plaintiff shareholders filed a putative securities fraud class action against The Boeing Company and two of our senior executives in federal district court in Chicago. This lawsuit arises from our June 2009 announcement that the first flight of the 787 Dreamliner would be postponed due to a need to reinforce an area within the side-of-body section of the aircraft. Plaintiffs contend that we were aware before June 2009 that the first flight could not take place as scheduled due to issues with the side-of-body section of the aircraft, and that our determination not to announce this delay earlier resulted in an artificial inflation of our stock price for a multi-week period in May and June 2009. In March 2010, we filed a motion to dismiss the complaint for failure to state a cognizable claim, and, on May 26, 2010, the Court granted the motion and dismissed the complaint in its entirety. On June 22, 2010, the Court accepted the plaintiff's amended complaint, which we moved to dismiss. On August 10, 2010, the Court denied the motion and on August 30, 2010, we answered the amended complaint. On September 24, 2010, we moved to strike the portions of the amended complaint attributed to a confidential source and to dismiss the complaint with prejudice. On October 14, 2010, the Court denied our motions. On December 10, 2010, we moved for reconsideration of the Court's order denying our motion to dismiss. Discovery has commenced.
In addition, plaintiff shareholders have filed three similar shareholder derivative lawsuits concerning the flight schedule for the 787 Dreamliner that closely track the allegations in the putative class action lawsuit. Two of the suits were filed in Illinois state court and have been consolidated. The remaining derivative suit was filed in federal district court in Chicago. No briefing or discovery has yet taken place in any of these lawsuits. We believe the allegations in all of these cases are without merit, and we intend to contest the cases vigorously.
103
Note 21 – Segment Information
We operate in five principal segments: Commercial Airplanes; Boeing Military Aircraft, Network & Space Systems, and Global Services & Support, collectively Boeing Defense, Space & Security; and Boeing Capital Corporation. All other activities fall within the Other segment or Unallocated items and eliminations. See page 55 for the Summary of Business Segment Data, which is an integral part of this note.
The Commercial Airplanes segment develops, produces and markets commercial jet aircraft and provides related support services, principally to the commercial airline industry worldwide.
Our BDS operations principally involve research, development, production, modification and support of the following products and related systems: global strike systems, including fighters, bombers, combat rotorcraft systems, weapons and unmanned systems; global mobility systems, including transport and tanker aircraft, rotorcraft transport and tilt-rotor systems; airborne surveillance and reconnaissance aircraft, including command and control, battle management, and airborne anti-submarine aircraft; network and tactical systems, including information and battle management systems, intelligence and security systems, missile defense systems, space and intelligence systems, including satellites and commercial satellite launching vehicles, and space exploration. BDS support and services deliver a full continuum of innovative products and services that help customers use the systems needed to execute their missions while reducing life-cycle costs. Although some BDS products are contracted in the commercial environment, the primary customer is the U.S. government.
Our BMA segment programs include A160 Hummingbird, AH-64 Apache, Airborne Early Warning and Control, CH-47 Chinook, C-17 Globemaster, EA-18G Growler Airborne Attack Electronic Aircraft, F/A-18E/F Super Hornet, F-15 Strike Eagle, F-22 Raptor, Harpoon, KC-767 International Tanker, Joint Direct Attack Munition, P-8A Poseidon, P-8I, ScanEagle, Small Diameter Bomb and V-22 Osprey.
Our N&SS segment programs include Airborne Laser, Family of Advanced Beyond Line-of-Sight Terminals, Brigade Combat Team Modernization, Future Rapid Effects System, Global Positioning System, Ground-based Midcourse Defense (GMD), International Space Station, Joint Tactical Radio System, Satellite Systems, Cyber and Security Programs, Space Payloads and Space Shuttle.
Our GS&S segment programs include Integrated Logistics on platforms including AH-64, AV-8B, C-17, CH-47, F-15, F/A-18, F-22, GMD, KC-767 International Tanker and V-22; Maintenance, Modifications and Upgrades on platforms including A-10, B-1, B-52, C-32, C-40, C-130, E-4B, E-6, KC-10, KC-135, T-38 and VC-25; Training Systems and Services on platforms including AH-64, C-17, F-15, F-16, F/A-18 and T-45; and Defense and Government Services including the UK Future Logistics Information Services program.
Our BCC segment facilitates, arranges, structures and provides selective financing solutions for our Commercial Airplanes customers. In the space and defense markets, BCC primarily arranges and structures financing solutions for our BDS government customers.
Our Other segment includes the unallocated activities of Engineering, Operations & Technology (EO&T) and Shared Services Group (SSG), as well as intercompany guarantees provided to BCC. EO&T provides Boeing with technical and functional capabilities, including information technology, research and development, test and evaluation, technology strategy development, environmental remediation management and intellectual property management.
Effective January 1, 2010, 2009 and 2008 certain programs were realigned among BDS segments. Business segment data for all periods presented have been adjusted to reflect the realignment.
104
While our principal operations are in the United States, Canada and Australia, some key suppliers and subcontractors are located in Europe and Japan. Revenues by geographic area consisted of the following:
| Years ended December 31, | 2010 | 2009 | 2008 | |||||||||
Asia, other than China | $ | 7,288 | $ | 7,536 | $ | 7,913 | ||||||
China | 3,109 | 4,888 | 2,404 | |||||||||
Europe | 7,872 | 7,516 | 5,992 | |||||||||
Middle East | 3,685 | 5,338 | 2,568 | |||||||||
Oceania | 1,707 | 1,447 | 989 | |||||||||
Africa | 956 | 602 | 406 | |||||||||
Canada | 612 | 493 | 1,849 | |||||||||
Latin America, Caribbean and other | 930 | 963 | 1,656 | |||||||||
Total non-U.S. revenues | 26,159 | 28,783 | 23,777 | |||||||||
United States | 38,147 | 39,498 | 37,132 | |||||||||
Total revenues | $ | 64,306 | $ | 68,281 | $ | 60,909 | ||||||
Commercial Airplanes segment revenues were approximately 78%, 86% and 70% of total revenues in Europe and approximately 75%, 70% and 75% of total revenues in Asia, excluding China, for 2010, 2009 and 2008, respectively. BDS revenues were approximately 20%, 12% and 20% of total revenues in Europe and approximately 25%, 29% and 24% of total revenues in Asia, excluding China, for 2010, 2009 and 2008, respectively. BDS revenues from the U.S. government represented 43%, 43% and 46% of consolidated revenues for 2010, 2009 and 2008, respectively. Approximately 5% of operating assets were located outside the United States as of December 31, 2010 and 2009.
The information in the following tables is derived directly from the segments' internal financial reporting used for corporate management purposes.
Research and Development Expense
| Years ended December 31, | 2010 | 2009 | 2008 | |||||||||
Commercial Airplanes | $ | 2,975 | $ | 5,383 | $ | 2,838 | ||||||
Boeing Defense, Space & Security: | ||||||||||||
Boeing Military Aircraft | 589 | 582 | 486 | |||||||||
Network & Space Systems | 417 | 397 | 298 | |||||||||
Global Services & Support | 130 | 122 | 149 | |||||||||
Total Boeing Defense, Space & Security | 1,136 | 1,101 | 933 | |||||||||
Other segment | 10 | 22 | (3 | ) | ||||||||
Total research and development expense, net | $ | 4,121 | $ | 6,506 | $ | 3,768 | ||||||
Research and development expense includes bid and proposal costs of $355, $343 and $330, respectively.
105
Depreciation and Amortization
| Years ended December 31, | 2010 | 2009 | 2008 | |||||||||
Commercial Airplanes | $ | 541 | $ | 495 | $ | 379 | ||||||
Boeing Defense, Space & Security: | ||||||||||||
Boeing Military Aircraft | 143 | 145 | 133 | |||||||||
Network & Space Systems | 161 | 169 | 140 | |||||||||
Global Services & Support | 63 | 69 | 54 | |||||||||
Total Boeing Defense, Space & Security | 367 | 383 | 327 | |||||||||
Boeing Capital Corporation | 204 | 210 | 225 | |||||||||
Other segment | 233 | 201 | 49 | |||||||||
Unallocated items and eliminations | 401 | 389 | 522 | |||||||||
Total | $ | 1,746 | $ | 1,678 | $ | 1,502 | ||||||
Capital Expenditures
| Years ended December 31, | 2010 | 2009 | 2008 | |||||||||
Commercial Airplanes | $ | 341 | $ | 420 | $ | 708 | ||||||
Boeing Defense, Space & Security: | ||||||||||||
Boeing Military Aircraft | 102 | 141 | 140 | |||||||||
Network & Space Systems | 83 | 51 | 87 | |||||||||
Global Services & Support | 51 | 75 | 40 | |||||||||
Total Boeing Defense, Space & Security | 236 | 267 | 267 | |||||||||
Other segment | 136 | 113 | 12 | |||||||||
Unallocated items and eliminations | 412 | 386 | 687 | |||||||||
Total | $ | 1,125 | $ | 1,186 | $ | 1,674 | ||||||
Unallocated capital expenditures relate primarily to assets managed by SSG on behalf of the five principal segments.
We recorded earnings from operations associated with our cost and equity method investments of $67, $74 and $47 in our Commercial Airplanes segment and $201, $175 and $194 primarily in our N&SS segment for the years ended December 31, 2010, 2009 and 2008, respectively.
For segment reporting purposes, we record Commercial Airplanes segment revenues and cost of sales for airplanes transferred to other segments. Such transfers may include airplanes accounted for as operating leases and considered transferred to the BCC segment and airplanes transferred to the BDS segment for further modification prior to delivery to the customer. The revenues and cost of sales for these transfers are eliminated in the Unallocated items and eliminations caption. For segment reporting purposes, we record BDS revenues and cost of sales for the modification performed on airplanes received from Commercial Airplanes when the airplane is delivered to the customer or at the attainment of performance milestones.
Intersegment revenues, eliminated in Unallocated items and eliminations are shown in the following table.
| Years ended December 31, | 2010 | 2009 | 2008 | |||||||||
Commercial Airplanes | $ | 604 | $ | 740 | $ | 1,193 | ||||||
Boeing Capital Corporation | 92 | 80 | 77 | |||||||||
Total | $ | 696 | $ | 820 | $ | 1,270 | ||||||
106
Unallocated Items and Eliminations
Unallocated items and eliminations includes costs not attributable to business segments as well as intercompany profit eliminations. This includes Unallocated pension and other postretirement expense which represents the difference between costs recognized under Generally Accepted Accounting Principles in the United States of America in the consolidated financial statements and federal cost accounting standards required to be utilized by our business segments for U.S. government contracting purposes.
The most significant items not allocated to segments are shown in the following table.
| Years ended December 31, | 2010 | 2009 | 2008 | |||||||||
Share-based plans | $ | (136 | ) | $ | (189 | ) | $ | (149 | ) | |||
Deferred compensation | (112 | ) | (158 | ) | 223 | |||||||
Pension | 54 | 110 | (208 | ) | ||||||||
Postretirement | (59 | ) | (93 | ) | (79 | ) | ||||||
Capitalized interest | (54 | ) | (53 | ) | (44 | ) | ||||||
Other unallocated items and eliminations | (428) | (211) | (66 | ) | ||||||||
Total | $ | (735 | ) | $ | (594 | ) | $ | (323 | ) | |||
Unallocated assets primarily consist of cash and investments, prepaid pension expense, net deferred tax assets, capitalized interest and assets held by SSG as well as intercompany eliminations. Unallocated liabilities include various accrued employee compensation and benefit liabilities, including accrued retiree health care, net deferred tax liabilities and income taxes payable. Debentures and notes payable are not allocated to other business segments except for the portion related to BCC.
Segment assets and liabilities are summarized in the tables below.
Assets
| December 31, | 2010 | 2009 | ||||||
Commercial Airplanes | $ | 28,341 | $ | 20,353 | ||||
Boeing Defense, Space & Security: | ||||||||
Boeing Military Aircraft | 6,731 | 6,075 | ||||||
Network & Space Systems | 7,456 | 7,434 | ||||||
Global Services & Support | 3,685 | 3,716 | ||||||
Total Boeing Defense, Space & Security | 17,872 | 17,225 | ||||||
Boeing Capital Corporation | 5,561 | 6,178 | ||||||
Other segment | 779 | 949 | ||||||
Unallocated items and eliminations | 16,012 | 17,348 | ||||||
Total | $ | 68,565 | $ | 62,053 | ||||
Liabilities
| December 31, | 2010 | 2009 | ||||||
Commercial Airplanes | $ | 19,663 | $ | 18,616 | ||||
Boeing Defense, Space & Security: | ||||||||
Boeing Military Aircraft | 4,025 | 4,041 | ||||||
Network & Space Systems | 953 | 1,023 | ||||||
Global Services & Support | 1,582 | 1,510 | ||||||
Total Boeing Defense, Space & Security | 6,560 | 6,574 | ||||||
Boeing Capital Corporation | 3,861 | 4,538 | ||||||
Other segment | 937 | 872 | ||||||
Unallocated items and eliminations | 34,682 | 29,228 | ||||||
Total | $ | 65,703 | $ | 59,828 | ||||
107
Note 22 – Quarterly Financial Data (Unaudited)
| 2010 | 2009 | |||||||||||||||||||||||||||||||
| 4th | 3rd | 2nd | 1st | 4th | 3rd | 2nd | 1st | |||||||||||||||||||||||||
Total revenues | $ | 16,550 | $ | 16,967 | $ | 15,573 | $ | 15,216 | $ | 17,937 | $ | 16,688 | $ | 17,154 | $ | 16,502 | ||||||||||||||||
Total costs and expenses | (13,413 | ) | (13,746 | ) | (12,540 | ) | (12,144 | ) | (14,508 | ) | (14,480 | ) | (13,807 | ) | (13,745 | ) | ||||||||||||||||
Earnings/(loss) from operations | 1,103 | 1,387 | 1,307 | 1,174 | 1,693 | (2,151 | ) | 1,529 | 1,025 | |||||||||||||||||||||||
Net earnings/(loss) from continuing operations | 1,166 | 837 | 789 | 519 | 1,283 | (1,560 | ) | 997 | 615 | |||||||||||||||||||||||
Net (loss)/gain from discontinued operations | (2 | ) | (2 | ) | (15 | ) | (4 | ) | 1 | (5 | ) | |||||||||||||||||||||
Net earnings/(loss) | 1,164 | 837 | 787 | 519 | 1,268 | (1,564 | ) | 998 | 610 | |||||||||||||||||||||||
Basic earnings/(loss) per share from continuing operations | 1.57 | 1.13 | 1.07 | 0.71 | 1.79 | (2.22 | ) | 1.42 | 0.88 | |||||||||||||||||||||||
Basic earnings/(loss) per share | 1.57 | 1.13 | 1.07 | 0.71 | 1.77 | (2.23 | ) | 1.42 | 0.87 | |||||||||||||||||||||||
Diluted earnings/(loss) per share from continuing operations | 1.56 | 1.12 | 1.06 | 0.70 | 1.77 | (2.22 | ) | 1.41 | 0.87 | |||||||||||||||||||||||
Diluted earnings/(loss) per share | 1.56 | 1.12 | 1.06 | 0.70 | 1.75 | (2.23 | ) | 1.41 | 0.86 | |||||||||||||||||||||||
Cash dividends declared per share | 0.84 | 0.84 | 0.84 | 0.84 | ||||||||||||||||||||||||||||
Common stock sales price per share: | ||||||||||||||||||||||||||||||||
High | 72.49 | 70.00 | 76.00 | 74.53 | 56.56 | 55.48 | 53.39 | 47.00 | ||||||||||||||||||||||||
Low | 61.84 | 59.48 | 59.84 | 54.80 | 47.18 | 38.92 | 34.21 | 29.05 | ||||||||||||||||||||||||
Quarter end | 65.26 | 66.54 | 62.75 | 72.61 | 54.13 | 54.15 | 42.50 | 35.58 | ||||||||||||||||||||||||
Gross profit is calculated as Total revenues minus Total costs and expenses. Cash dividends of $0.42 per share were paid during each quarter of 2010 and 2009.
During the fourth quarter of 2010 and 2009, we recorded pre-tax charges of $136 and $133 on the AEW&C program in our BMA segment.
During the first and third quarters of 2009, we recorded pre-tax charges of $347 and $1,005 on the 747 program in our Commercial Airplanes segment. During the third quarter of 2009, we recorded $2,619 of research and development costs relating to the first three 787 flight test aircraft in our Commercial Airplanes segment.
108
REPORT OF INDEPENDENT REGISTERED PUBLIC ACCOUNTING FIRM
To the Board of Directors and Shareholders of
The Boeing Company
Chicago, Illinois
We have audited the accompanying consolidated statements of financial position of The Boeing Company and subsidiaries (the "Company") as of December 31, 2010 and 2009, and the related consolidated statements of operations, equity, and cash flows for each of the three years in the period ended December 31, 2010. Our audits also included the financial statement schedule listed in the Index at Item 15(a) 2. The financial statements and financial statement schedule are the responsibility of the Company's management. Our responsibility is to express an opinion on the financial statements and financial statement schedule based on our audits.
We conducted our audits in accordance with the standards of the Public Company Accounting Oversight Board (United States). Those standards require that we plan and perform the audit to obtain reasonable assurance about whether the financial statements are free of material misstatement. An audit includes examining, on a test basis, evidence supporting the amounts and disclosures in the financial statements. An audit also includes assessing the accounting principles used and significant estimates made by management, as well as evaluating the overall financial statement presentation. We believe that our audits provide a reasonable basis for our opinion.
In our opinion, such consolidated financial statements present fairly, in all material respects, the financial position of The Boeing Company and subsidiaries as of December 31, 2010 and 2009, and the results of their operations and their cash flows for each of the three years in the period ended December 31, 2010, in conformity with accounting principles generally accepted in the United States of America. Also, in our opinion, such financial statement schedule, when considered in relation to the basic consolidated financial statements taken as a whole, presents fairly, in all material respects, the information set forth therein.
We have also audited, in accordance with the standards of the Public Company Accounting Oversight Board (United States), the Company's internal control over financial reporting as of December 31, 2010, based on the criteria established in Internal Control – Integrated Framework issued by the Committee of Sponsoring Organizations of the Treadway Commission and our report dated February 9, 2011 expressed an unqualified opinion on the Company's internal control over financial reporting.
/ S / D ELOITTE & T OUCHE LLP
Chicago, Illinois
February 9, 2011
109
REPORT OF INDEPENDENT REGISTERED PUBLIC ACCOUNTING FIRM
To the Board of Directors and Shareholders of
The Boeing Company
Chicago, Illinois
We have audited the internal control over financial reporting of The Boeing Company and subsidiaries (the "Company") as of December 31, 2010, based on criteria established in Internal Control – Integrated Framework issued by the Committee of Sponsoring Organizations of the Treadway Commission. The Company's management is responsible for maintaining effective internal control over financial reporting and for its assessment of the effectiveness of internal control over financial reporting, included in the accompanying Management's Report on Internal Control Over Financial Reporting. Our responsibility is to express an opinion on the Company's internal control over financial reporting based on our audit.
We conducted our audit in accordance with the standards of the Public Company Accounting Oversight Board (United States). Those standards require that we plan and perform the audit to obtain reasonable assurance about whether effective internal control over financial reporting was maintained in all material respects. Our audit included obtaining an understanding of internal control over financial reporting, assessing the risk that a material weakness exists, testing and evaluating the design and operating effectiveness of internal control based on the assessed risk, and performing such other procedures as we considered necessary in the circumstances. We believe that our audit provides a reasonable basis for our opinion.
A company's internal control over financial reporting is a process designed by, or under the supervision of, the company's principal executive and principal financial officers, or persons performing similar functions, and effected by the company's board of directors, management, and other personnel to provide reasonable assurance regarding the reliability of financial reporting and the preparation of financial statements for external purposes in accordance with generally accepted accounting principles. A company's internal control over financial reporting includes those policies and procedures that (1) pertain to the maintenance of records that, in reasonable detail, accurately and fairly reflect the transactions and dispositions of the assets of the company; (2) provide reasonable assurance that transactions are recorded as necessary to permit preparation of financial statements in accordance with generally accepted accounting principles, and that receipts and expenditures of the company are being made only in accordance with authorizations of management and directors of the company; and (3) provide reasonable assurance regarding prevention or timely detection of unauthorized acquisition, use, or disposition of the company's assets that could have a material effect on the financial statements.
Because of the inherent limitations of internal control over financial reporting, including the possibility of collusion or improper management override of controls, material misstatements due to error or fraud may not be prevented or detected on a timely basis. Also, projections of any evaluation of the effectiveness of the internal control over financial reporting to future periods are subject to the risk that the controls may become inadequate because of changes in conditions, or that the degree of compliance with the policies or procedures may deteriorate.
In our opinion, the Company maintained, in all material respects, effective internal control over financial reporting as of December 31, 2010, based on the criteria established in Internal Control – Integrated Framework issued by the Committee of Sponsoring Organizations of the Treadway Commission.
We have also audited, in accordance with the standards of the Public Company Accounting Oversight Board (United States), the consolidated financial statements and financial statement schedule as of and for the year ended December 31, 2010 of the Company and our report dated February 9, 2011 expressed an unqualified opinion on those financial statements and financial statement schedule.
/ S / D ELOITTE & T OUCHE LLP
Chicago, Illinois
February 9, 2011
110
Item 9. Changes in and Disagreements with Accountants on Accounting and Financial Disclosure
None.
Item 9A. Controls and Procedures
| (a) | Evaluation of Disclosure Controls and Procedures. |
Our Chief Executive Officer and Chief Financial Officer have evaluated our disclosure controls and procedures as of December 31, 2010 and have concluded that these disclosure controls and procedures are effective to ensure that information required to be disclosed by us in the reports that we file or submit under the Act is recorded, processed, summarized and reported within the time periods specified in the Commission's rules and forms and is accumulated and communicated to our management, including the Chief Executive Officer and Chief Financial Officer, as appropriate to allow timely decisions regarding required disclosure.
| (b) | Management's Report on Internal Control Over Financial Reporting. |
Our management is responsible for establishing and maintaining adequate internal control over financial reporting, as such term is defined in Exchange Act Rules 13a-15(f). Our management conducted an evaluation of the effectiveness of our internal control over financial reporting based on the framework in Internal Control – Integrated Framework issued by the Committee of Sponsoring Organizations of the Treadway Commission. Based on this evaluation under the framework in Internal Control – Integrated Framework, our management concluded that our internal control over financial reporting was effective as of December 31, 2010.
Our internal control over financial reporting as of December 31, 2010, has been audited by Deloitte & Touche LLP, an independent registered public accounting firm, as stated in their report which is included in Item 8 of this report and is incorporated by reference herein.
| (c) | Changes in Internal Controls Over Financial Reporting. |
There were no changes in our internal control over financial reporting that occurred during the fourth quarter of 2010 that have materially affected or are reasonably likely to materially affect our internal control over financial reporting.
Item 9B. Other Information
None
111
PART III
Item 10. Directors, Executive Officers and Corporate Governance
Our executive officers as of February 1, 2011, are as follows:
| Name | Age | Principal Occupation or Employment/Other Business Affiliations | ||
James F. Albaugh | 60 | Executive Vice President since July 2002 and President and Chief Executive Officer of BCA since September 2009. Prior thereto, President and CEO of BDS from July 2002 to August 2009. Prior thereto, Senior Vice President of Boeing and President of Space and Communications Group since September 1998 (named CEO of Space and Communications Group in March 2001). Prior thereto, President, Boeing Space Transportation since April 1998 and President of Rocketdyne Propulsion and Power since March 1997. Mr. Albaugh serves on the board of TRW Automotive Holdings, Inc. | ||
James A. Bell | 62 | Executive Vice President and Chief Financial Officer since January 2004 and Corporate President since June 2008. Prior thereto, Senior Vice President of Finance and Corporate Controller from October 2000 to January 2004. Prior thereto, Vice President of Contracts and Pricing for Boeing Space Communications from January 1997 to October 2000. Mr. Bell serves on the boards of The Dow Chemical Company and Boeing Capital Corporation. | ||
Wanda K. Denson-Low | 54 | Senior Vice President, Office of Internal Governance since May 2007. Prior thereto, Vice President and Assistant General Counsel of BDS from August 2003 to May 2007. Prior thereto, Vice President of Human Resources for BDS from March 2002 to August 2003. Ms. Denson-Low joined Boeing when the Company acquired Hughes Space and Communications in 2000, when she held the position of Vice President, General Counsel. | ||
Thomas J. Downey | 46 | Senior Vice President, Communications since January 2007. Prior thereto, Vice President, Corporate Communications from April to December 2006 and Vice President, BCA Communications from May 2002 to April 2006. Prior positions include Corporate Vice President, Internal and Executive Communications and General Manager of Communications and Community Relations for Military Aircraft and Missile Systems unit. Mr. Downey joined the Company in 1986. | ||
Shephard W. Hill | 58 | President, Boeing International since November 2007 and Senior Vice President, Business Development and Strategy since October 2009. Prior thereto, Senior Vice President, Business Development and Strategy from March 2006 to November 2007. Prior thereto, Vice President, Business Development at BDS from September 2002 to March 2006. Mr. Hill joined Boeing when the Company acquired Rockwell's Aerospace and Defense business in 1996, when he held the position of Vice President, Aerospace Government Affairs and Marketing. | ||
112
| Name | Age | Principal Occupation or Employment/Other Business Affiliations | ||
Timothy J. Keating | 49 | Senior Vice President, Government Operations since June 2008. Prior thereto, Senior Vice President, Global Government Relations, Honeywell International Inc. from October 2002 to May 2008. Prior thereto, Mr. Keating was Chairman of the Board and Managing Partner of Timmons and Company (a Washington, D.C. lobbying firm) from 1998 until 2002. | ||
J. Michael Luttig | 56 | Executive Vice President and General Counsel since April 2009. Prior thereto, Senior Vice President and General Counsel from May 2006 to April 2009. Prior thereto, Mr. Luttig served on the United States Court of Appeals for the Fourth Circuit from October 1991 to May 2006. Prior thereto, Assistant Attorney General of the United States, Counselor to the Attorney General at the Department of Justice and Principal Deputy Assistant Attorney General at the Department of Justice. Mr. Luttig was associated with Davis Polk & Wardwell LLP from September 1985 to March 1989. Mr. Luttig serves on the board of Boeing Capital Corporation and as Director, Franklin Templeton Mutual Funds. | ||
W. James McNerney, Jr. | 61 | Chairman, President and Chief Executive Officer since July 2005. Prior thereto, he served as Chairman and Chief Executive Officer of 3M Company (diversified technology) from January 2001 to June 2005. Beginning in 1982, he served in management positions at General Electric Company, his most recent being President and Chief Executive Officer of GE Aircraft Engines from 1997 to 2000. In addition to The Boeing Company, Mr. McNerney serves on the boards of The Procter & Gamble Company and International Business Machines Corporation. He is Chair of President Obama's Export Council and a member of various business and educational organizations. | ||
Dennis A. Muilenburg | 47 | Executive Vice President, President and Chief Executive Officer of BDS since September 2009. Prior thereto, President of Global Services & Support from February 2008 to August 2009. Prior thereto, Vice President and General Manager of Combat Systems from May 2006 to February 2008. Prior thereto, Vice President and Program Manager for Future Combat Systems from 2003 to May 2006. Mr. Muilenburg joined the Company in 1985. | ||
Richard D. Stephens | 58 | Senior Vice President Human Resources and Administration since September 2005. Prior thereto, Senior Vice President of Internal Services from December 2004 to September 2005. Prior positions include President of Shared Services Group and Vice President and General Manager, Homeland Security and Services. Mr. Stephens joined the Company in 1980. | ||
John J. Tracy | 56 | Chief Technology Officer and Senior Vice President of Engineering, Operations & Technology since October 2006. Prior thereto, Vice President of Engineering and Mission Assurance for BDS, February 2004 to September 2006. Prior positions include Vice President of Structural Technologies, Prototyping, and Quality for Phantom Works and General Manager of Engineering for Military Aircraft and Missiles. Dr. Tracy joined the Company in 1981. | ||
113
Information relating to our directors and nominees will be included under the caption "Election of Directors" in the 2011 Proxy Statement for our Annual Shareholders Meeting scheduled to be held on May 2, 2011 and is incorporated by reference herein. The information required by Items 405, 407(d)(4) and 407(d)(5) of Regulation S-K will be included under the captions "Stock Ownership Information – Section 16(a) Beneficial Ownership Reporting Compliance" and "Board Committees – Audit Committee" in the 2011 Proxy Statement, and that information is incorporated by reference herein.
Codes of Ethics. We have adopted (1) The Boeing Company Code of Ethical Business Conduct for the Board of Directors; (2) The Boeing Company Code of Conduct for Finance Employees which is applicable to our Chief Financial Officer (CFO), Controller and all finance employees; and (3) The Boeing Code of Conduct that applies to all employees, including our Chief Executive Officer (CEO), (collectively, the Codes of Conduct). The Codes of Conduct are posted on our website, www.boeing.com, and printed copies may be obtained, without charge, by contacting the Office of Internal Governance, The Boeing Company, 100 N. Riverside Plaza, Chicago, IL 60606. We intend to disclose promptly on our website any amendments to, or waivers of, the Codes of Conduct covering our CEO, CFO and/or Controller.
No family relationships exist among any of the executive officers, directors or director nominees.
Item 11. Executive Compensation
The information required by Item 402 of Regulation S-K will be included under the captions "Executive Compensation" and "Corporate Governance – Director Compensation" in the 2011 Proxy Statement, and that information is incorporated by reference herein. The information required by Item 407(e)(4) and 407(e)(5) of Regulation S-K will be included under the captions "Compensation Committee Interlocks and Insider Participation" and "Compensation Committee Report" in the 2011 Proxy Statement, and that information is incorporated by reference herein.
114
Item 12. Security Ownership of Certain Beneficial Owners and Management and Related Stockholder Matters
The information required by Item 403 of Regulation S-K will be included under the caption "Stock Ownership Information" in the 2011 Proxy Statement, and that information is incorporated by reference herein.
Equity Compensation Plan Information
We currently maintain two equity compensation plans that provide for the issuance of common stock to officers and other employees, directors and consultants. Each of these compensation plans was approved by our shareholders. The following table sets forth information regarding outstanding options and shares available for future issuance under these plans as of December 31, 2010:
| Plan Category | Number of shares to be issued upon exercise of outstanding options, warrants and rights | Weighted-average exercise price of outstanding options, warrants and rights | Number of securities remaining available for future issuance under equity compensation plans (excluding shares reflected in column (a)) | |||||||||
| (a) | (b) | (c) | ||||||||||
Equity compensation plans approved by shareholders | ||||||||||||
Stock options | 28,975,422 | $ | 65.96 | 42,406,254 | ||||||||
Performance shares | ||||||||||||
Deferred compensation | 3,948,659 | |||||||||||
Other stock units | 5,127,751 | |||||||||||
Equity compensation plans not approved by shareholders | None | None | None | |||||||||
Total (1) | 38,051,832 | $ | 65.96 | 42,406,254 | ||||||||
| (1) | Excludes the potential performance awards which the Compensation Committee has the discretion to pay in cash, stock or a combination of both after the three-year performance periods ending in 2011 and 2012. |
For further information, see Note 15 to our Consolidated Financial Statements.
Item 13. Certain Relationships and Related Transactions, and Director Independence
The information required by Item 404 of Regulation S-K will be included under the caption "Corporate Governance – Related Person Transactions" in the 2011 Proxy Statement, and that information is incorporated by reference herein.
The information required by Item 407(a) of Regulation S-K will be included under the caption "Corporate Governance – Director Independence" in the 2011 Proxy Statement, and that information is incorporated by reference herein.
Item 14. Principal Accounting Fees and Services
The information required by this Item will be included under the caption "Principal Accountant Fees and Services" in the 2011 Proxy Statement, and that information is incorporated by reference herein.
115
PART IV
Item 15. Exhibits, Financial Statement Schedules
| (a) | List of documents filed as part of this report: |
| 1. | Financial Statements |
Our consolidated financial statements are as set forth under Item 8 of this report on Form 10-K.
| 2. | Financial Statement Schedules |
Schedule | Description | Page | ||||
| II | Valuation and Qualifying Accounts | 121 | ||||
The auditors' report with respect to the above-listed financial statement schedule appears on page 109 of this report. All other financial statements and schedules not listed are omitted either because they are not applicable, not required, or the required information is included in the consolidated financial statements.
| 3. | Exhibits |
| (3) | Articles of Incorporation and By-Laws. |
| (i) | Amended and Restated Certificate of Incorporation of The Boeing Company dated May 5, 2006 (Exhibit 3.1 to the Company's Current Report on Form 8-K dated May 1, 2006). |
| (ii) | By-Laws of The Boeing Company, as amended and restated January 10, 2011 (Exhibit 3.2 to the Company's Current Report on Form 8-K dated January 7, 2011). |
| (10) | Material Contracts. |
| · | The Boeing Company Bank Credit Agreements |
| (i) | U.S. $2.376 Billion 364-Day Credit Agreement dated as of November 12, 2010, among The Boeing Company, the Lenders named therein, Citigroup Global Markets Inc. and J.P. Morgan Securities LLC as joint lead arrangers and joint book managers, JPMorgan Chase Bank, N.A. as syndication agent and Citibank, N.A. as administrative agent, and a syndicate of lenders as defined in the Credit Agreement (Exhibit 10.1 to the Company's Current Report on Form 8-K dated November 12, 2010). |
| (ii) | U.S. $2.0 Billion Five-Year Credit Agreement dated as of November 16, 2007, among The Boeing Company, the Lenders named therein, JPMorgan Chase Bank, as syndicated agent, Citigroup Global Markets Inc. and J.P. Morgan Securities, Inc., as joint lead arrangers and joint book managers, and Citibank, N.A. as administrative agent for such Lenders (Exhibit (10)(ii) to the Company's Form 10-K for the year ended December 31, 2007). |
| · | Business Acquisition Agreements |
| (iii) | Joint Venture Master Agreement by and among Lockheed Martin Corporation, The Boeing Company and a Delaware LLC, dated as of May 2, 2005 (Exhibit (10)(i) to the Company's Form 10-Q for the quarter ended June 30, 2005). |
116
| (iv) | Delta Inventory Supply Agreement, dated as of December 1, 2006 by and between United Launch Alliance L.L.C. and The Boeing Company (Exhibit (10)(vi) to the Company's Form 10-K for the year ended December 31, 2006). |
| (v) | Asset Purchase Agreement by and between Vought Aircraft Industries, Inc. and BCACSC, Inc. dated as of July 6, 2009 (Exhibit (10)(i) to the Company's Form 10-Q for the quarter ended September 30, 2009). |
| · | Management Contracts and Compensatory Plans |
| (vi) | 1992 Stock Option Plan for Nonemployee Directors. |
| (a) | Plan (Exhibit (19) to the Company's Form 10-Q for the quarter ended March 31, 1992). |
| (b) | Form of Stock Option Agreement (Exhibit (10)(viii)(b) to the Company's Form 10-K for the year ended December 31, 1992). |
| (vii) | Supplemental Benefit Plan for Employees of The Boeing Company, as amended and restated effective January 1, 2009 (Exhibit 4.1 to the Company's Form S-8 filed on December 22, 2008). |
| (viii) | Supplemental Retirement Plan for Executives of The Boeing Company, as amended on March 22, 2003 (Exhibit (10)(vi) to the Company's Annual Report on Form 10-K for the year ended December 31, 2003). |
| (ix) | Deferred Compensation Plan for Employees of The Boeing Company, as amended and restated on January 1, 2008 (Exhibit 10.1 to the Company's Current Report on Form 8-K dated October 28, 2007). |
| (x) | Deferred Compensation Plan for Directors of The Boeing Company, as amended and restated effective January 1, 2008 (Exhibit 10.2 to the Company's Current Report on Form 8-K dated October 28, 2007). |
| (xi) | Incentive Compensation Plan for Employees of The Boeing Company and Subsidiaries, as amended and restated January 1, 2008 (Exhibit 10.7 to the Company's Current Report on Form 8-K dated October 28, 2007). |
| (xii) | The Boeing Company 1997 Incentive Stock Plan, as amended effective May 1, 2000 and further amended effective January 1, 2008 (Exhibit 10.5 to the Company's Current Report on Form 8-K dated October 28, 2007). |
| (xiii) | Amended and Restated Executive Employment Agreement with W. James McNerney, Jr. dated March 13, 2008 (Exhibit 10.1 to the Company's Current Report on Form 8-K dated March 13, 2008). |
| (xiv) | Summary of Nonemployee Director Compensation (Exhibit (10)(i) to the Company's Form 10-Q for the quarter ended September 30, 2010). |
| (xv) | 2004 Variable Compensation Plan (formerly the 1999 Bonus and Retention Award Plan) as amended and restated effective January 1, 2008 (Exhibit 10.8 to the Company's Current Report on Form 8-K dated October 28, 2007). |
| (xvi) | The Boeing Company Executive Layoff Benefits Plan as amended and restated effective January 1, 2010 (Exhibit (10)(xxix) to the Company's Annual Report on Form 10-K for the year ended December 31, 2009). |
117
| (xvii) | The Boeing Company 2003 Incentive Stock Plan |
| (a) | Plan, as amended and restated effective February 23, 2009 (Appendix A to the Definitive Proxy Statement filed by the Company on March 13, 2009). |
| (b) | Form of Non-Qualified Stock Option Grant Notice of Terms. |
| (c) | Form of Notice of Terms of Restricted Stock Units. |
| (d) | Form of Performance Award Notice. |
| (xviii) | Supplemental Executive Retirement Plan for Employees of The Boeing Company, as amended and restated on January 1, 2008 (Exhibit 10.1 to the Company's Current Report on Form 8-K dated December 10, 2007). |
| (xix) | The Boeing Company Elected Officer Annual Incentive Plan as amended and restated effective January 1, 2008 (Exhibit 10.6 to the Company's Current Report on Form 8-K dated October 28, 2007). |
| (xx) | Supplemental Pension Agreement between The Boeing Company and J. Michael Luttig dated January 25, 2007 as amended on November 14, 2007 (Exhibit (10)(xxx) to the Company's Form 10-K for the year ended December 31, 2007). |
| (xxi) | Notice of Terms of Restricted Stock Units dated February 23, 2009 (Exhibit (10)(ii) to the Company's Form 10-Q for the quarter ended March 31, 2009). |
| (xxii) | Amended Notice of Terms of Restricted Stock Units (Exhibit 10.1 to the Company's Current Report on Form 8-K dated October 25, 2009). |
| (xxiii) | Notice of Terms of Restricted Stock Units dated February 22, 2010 (Exhibit 10.1 to the Company's Current Report on Form 8-K dated February 22, 2010). |
| · | Other |
| (xxiv) | Registration Rights Agreement dated November 9, 2009 by and between The Boeing Company and EvercoreTrust Company, N.A., solely in its capacity as duly appointed and acting investment manager of a segregated account held in The Boeing Company Employee Retirement Plans Master Trust (Exhibit 10.1 to the Company's Registration Statement on Form S-3 filed November 10, 2009). |
| (12) | Computation of Ratio of Earnings to Fixed Charges. |
| (14) | Code of Ethics |
| (i) | The Boeing Company Code of Ethical Business Conduct for Members of the Board of Directors (http://www.boeing.com/corp_gov/conduct_board.html). |
| (ii) | The Boeing Company Code of Conduct for Finance Employees (http://www.boeing.com/corp_gov/conduct_finance.html). |
| (iii) | The Boeing Company Code of Conduct (http://www.boeing.com/corp_gov/conduct_employee.html). |
| (21) | List of Company Subsidiaries. |
| (23) | Consent of Independent Registered Public Accounting Firm in connection with filings on Form S-3 and Form S-8 under the Securities Act of 1933. |
| (31) | Section 302 Certifications. |
| (i) | Certification of Chief Executive Officer pursuant to Section 302 of Sarbanes-Oxley Act of 2002. |
118
| (ii) | Certification of Chief Financial Officer pursuant to Section 302 of Sarbanes-Oxley Act of 2002. |
| (32) | Section 906 Certifications. |
| (i) | Certification of Chief Executive Officer pursuant to Section 906 of Sarbanes-Oxley Act of 2002. |
| (ii) | Certification of Chief Financial Officer pursuant to Section 906 of Sarbanes-Oxley Act of 2002. |
| (99) | Additional Exhibits |
| (i) | Commercial Program Method of Accounting (Exhibit (99)(i) to the 1997 Form 10-K). |
| (101) | Interactive Data Files |
| (101.INS) | XBRL Instance Document |
| (101.SCH) | XBRL Taxonomy Extension Schema Document |
| (101.CAL) | XBRL Taxonomy Extension Calculation Linkbase Document |
| (101.DEF) | XBRL Taxonomy Extension Definition Linkbase Document |
| (101.LAB) | XBRL Taxonomy Extension Label Linkbase Document |
| (101.PRE) | XBRL Taxonomy Extension Presentation Linkbase Document |
In accordance with Item 601(b)(4)(iii)(A) of Regulation S-K, copies of certain instruments defining the rights of holders of long-term debt of the Company or its subsidiaries are not filed herewith. Pursuant to this regulation, we hereby agree to furnish a copy of any such instrument to the SEC upon request.
119
Signatures
Pursuant to the requirements of Section 13 of the Securities Exchange Act of 1934, the registrant has duly caused this report to be signed on its behalf by the undersigned, thereunto duly authorized, on February 9, 2011.
THE BOEING COMPANY
| By: | / S / W. J AMES M C N ERNEY , J R . | By: | / S / J AMES A. B ELL | |||||
| W. James McNerney, Jr. – Chairman, President and Chief Executive Officer | James A. Bell – Executive Vice President, Corporate President and Chief Financial Officer | |||||||
By: | / S / G REGORY D. S MITH | |||||||
| Gregory D. Smith – Vice President of Finance & Corporate Controller | ||||||||
Pursuant to the requirements of the Securities Exchange Act of 1934, this report has been signed below by the following persons on behalf of the registrant and in the capacities indicated on February 9, 2011.
/ S / J OHN H. B IGGS | / S / E DWARD M. L IDDY | |||
| John H. Biggs – Director | Edward M. Liddy – Director | |||
/ S / J OHN E. B RYSON | / S / J OHN F. M C D ONNELL | |||
| John E. Bryson – Director | John F. McDonnell – Director | |||
/ S / D AVID L. C ALHOUN | / S / W. J AMES M C N ERNEY , J R . | |||
| David L. Calhoun – Director | W. James McNerney, Jr. – Director | |||
/ S / A RTHUR D. C OLLINS , J R . | / S / S USAN C. S CHWAB | |||
| Arthur D. Collins, Jr. – Director | Susan C. Schwab – Director | |||
/ S / L INDA Z. C OOK | / S / R ONALD A. W ILLIAMS | |||
| Linda Z. Cook – Director | Ronald A. Williams – Director | |||
/ S / K ENNETH M. D UBERSTEIN | / S / M IKE S. Z AFIROVSKI | |||
Kenneth M. Duberstein – Director | Mike S. Zafirovski – Director | |||
/ S / E DMUND P. G IAMBASTIANI , J R . | ||||
| Edmund P. Giambastiani, Jr. – Director | ||||
120
SCHEDULE II-Valuation and Qualifying Accounts
The Boeing Company and Subsidiaries
Allowance for Customer Financing and Other Assets
(Deducted from assets to which they apply)
(Dollars in millions)
Customer Financing | 2010 | 2009 | 2008 | |||||||||
Balance at January 1 | $ | 302 | $ | 269 | $ | 195 | ||||||
Charged to costs and expenses | 51 | 45 | 84 | |||||||||
Deductions from reserves | (12 | ) | (10 | ) | ||||||||
Balance at December 31 | $ | 353 | $ | 302 | $ | 269 | ||||||
Sea Launch Reserves | 2010 | 2009 | 2008 | |||||||||
Balance at January 1 | $ | 969 | $ | 723 | $ | 660 | ||||||
Additions (1) | 246 | 63 | ||||||||||
Deductions from reserves (2) | (969 | ) | ||||||||||
Balance at December 31 | $ | 969 | $ | 723 | ||||||||
| (1) | Additions in 2009 included $179 transferred in from Other accrued liabilities and $67 in charges to costs and expenses. |
| (2) | During 2010, our claims against Sea Launch were discharged by the bankruptcy court and the related balances and reserves were written off. See Note 6 to our Consolidated Financial Statements for more information regarding amounts receivable from other Sea Launch partners. |
121