Table of Contents
UNITED STATES SECURITIES AND EXCHANGE COMMISSION
Washington, D.C. 20549
Form 10-K
(Mark one)
☑ | ANNUAL REPORT PURSUANT TO SECTION 13 OR 15(d) OF THE SECURITIES EXCHANGE ACT OF 1934 |
For the fiscal year ended October 30, 2016
or
¨ | TRANSITION REPORT PURSUANT TO SECTION 13 OR 15(d) OF THE SECURITIES EXCHANGE ACT OF 1934 |
For the transition period from to
Commission file number 000-06920
Applied Materials, Inc.
(Exact name of registrant as specified in its charter)
Delaware | 94-1655526 |
(State or other jurisdiction of incorporation or organization) | (I.R.S. Employer Identification No.) |
3050 Bowers Avenue, P.O. Box 58039 Santa Clara, California | 95052-8039 (Zip Code) |
(Address of principal executive offices) | |
Registrant's telephone number, including area code:
(408) 727-5555
Securities registered pursuant to Section 12(b) of the Act:
Title of Each Class | Name of Each Exchange on Which Registered |
Common Stock, par value $.01 per share | The NASDAQ Stock Market LLC |
Securities registered pursuant to Section 12(g) of the Act: None
Indicate by check mark if the registrant is a well-known seasoned issuer, as defined in Rule 405 of the Securities Act. Yes ☑ No ¨
Indicate by check mark if the registrant is not required to file reports pursuant to Section 13 or Section 15(d) of the Act. Yes ¨ No ☑
Indicate by check mark whether the registrant (1) has filed all reports required to be filed by Section 13 or 15(d) of the Securities Exchange Act of 1934 during the preceding 12 months (or for such shorter period that the registrant was required to file such reports), and (2) has been subject to such filing requirements for the past 90 days. Yes ☑ No ¨
Indicate by check mark whether the registrant has submitted electronically and posted on its corporate Web site, if any, every Interactive Data File required to be submitted and posted pursuant to Rule 405 of Regulation S-T (§232.405 of this chapter) during the preceding 12 months (or for such shorter period that the registrant was required to submit and post such files). Yes ☑ No ¨
Indicate by check mark if disclosure of delinquent filers pursuant to Item 405 of Regulation S-K (§229.405 of this chapter) is not contained herein, and will not be contained, to the best of registrant's knowledge, in definitive proxy or information statements incorporated by reference in Part III of this Form 10-K or any amendment to this Form 10-K. ☑
Indicate by check mark whether the registrant is a large accelerated filer, an accelerated filer, a non-accelerated filer, or a smaller reporting company. See the definitions of "large accelerated filer," "accelerated filer" and "smaller reporting company" in Rule 12b-2 of the Exchange Act.
Large accelerated filer ☑ |
| Accelerated filer ¨ |
|
| |
Non-accelerated filer ¨ (Do not check if a smaller reporting company) |
| Smaller reporting company ¨ |
Indicate by check mark whether the registrant is a shell company (as defined in Rule 12b-2 of the Act). Yes ¨ No ☑
Aggregate market value of the voting stock held by non-affiliates of the registrant as of May 1, 2016, based upon the closing sale price reported by the NASDAQ Global Select Market on that date: $22,248,434,583
Number of shares outstanding of the registrant's Common Stock, $.01 par value, as of December 8, 2016 : 1,076,570,134
DOCUMENTS INCORPORATED BY REFERENCE:
Portions of Part III will be provided in accordance with Instruction G(3) to Form 10-K no later than February 27, 2017 .
Table of Contents
Caution Regarding Forward-Looking Statements
This Annual Report on Form 10-K of Applied Materials, Inc. and its subsidiaries (Applied or the Company), including "Management's Discussion and Analysis of Financial Condition and Results of Operations" in Item 7, contains forward-looking statements that involve a number of risks and uncertainties.
Examples of forward-looking statements include those regarding Applied's future financial or operating results, cash flows and cash deployment strategies, declaration of dividends, share repurchases, business strategies and priorities, costs and cost controls, products, competitive positions, management's plans and objectives for future operations, research and development, strategic acquisitions and investments, growth opportunities, restructuring activities, backlog, working capital, liquidity, investment portfolio and policies, taxes, supply chain, manufacturing, properties, legal proceedings and claims, customer demand and spending, end-use demand, market and industry trends and outlooks, general economic conditions and other statements that are not historical facts, as well as their underlying assumptions. Forward-looking statements may contain words such as "may," "will," "should," "could," "would," "expect," "plan," "anticipate," "believe," "estimate," "potential" and "continue," the negative of these terms, or other comparable terminology. All forward-looking statements are subject to risks and uncertainties and other important factors, including those discussed in Part I, Item 1A, "Risk Factors," below and elsewhere in this report. These and many other factors could affect Applied's future financial condition and operating results and could cause actual results to differ materially from expectations based on forward-looking statements made in this document or elsewhere by Applied or on its behalf. Forward-looking statements are based on management's estimates, projections and expectations as of the date hereof, and Applied undertakes no obligation to revise or update any such statements.
The following information should be read in conjunction with the Consolidated Financial Statements and the accompanying Notes to Consolidated Financial Statements included in this report.
2
Table of Contents
APPLIED MATERIALS, INC.
FORM 10-K FOR THE FISCAL YEAR ENDED OCTOBER 30, 2016
TABLE OF CONTENTS
|
|
|
|
| Page |
| PART I |
|
Item 1: | Business | 4 |
Item 1A: | Risk Factors | 14 |
Item 1B: | Unresolved Staff Comments | 23 |
Item 2: | Properties | 24 |
Item 3: | Legal Proceedings | 25 |
Item 4: | Mine Safety Disclosures | 25 |
|
|
|
| PART II |
|
Item 5: | Market for Registrant's Common Equity, Related Stockholder Matters and Issuer Purchases of Equity Securities | 25 |
Item 6: | Selected Financial Data | 27 |
Item 7: | Management's Discussion and Analysis of Financial Condition and Results of Operations | 28 |
Item 7A: | Quantitative and Qualitative Disclosures About Market Risk | 50 |
Item 8: | Financial Statements and Supplementary Data | 50 |
Item 9: | Changes in and Disagreements with Accountants on Accounting and Financial Disclosure | 50 |
Item 9A: | Controls and Procedures | 51 |
Item 9B: | Other Information | 51 |
|
|
|
| PART III |
|
Item 10: | Directors, Executive Officers and Corporate Governance | 52 |
Item 11: | Executive Compensation | 52 |
Item 12: | Security Ownership of Certain Beneficial Owners and Management and Related Stockholder Matters | 53 |
Item 13: | Certain Relationships and Related Transactions, and Director Independence | 54 |
Item 14: | Principal Accounting Fees and Services | 54 |
|
|
|
| PART IV |
|
Item 15: | Exhibits, Financial Statement Schedules | 55 |
| Signatures | 104 |
3
Table of Contents
PART I
Item 1: | Business |
Incorporated in 1967, Applied is a Delaware corporation. A global company with a broad set of capabilities in materials engineering, Applied provides manufacturing equipment, services and software to the global semiconductor, display and related industries. With its diverse technology capabilities, Applied delivers products and services that improve device performance, yield and cost. Applied's customers include manufacturers of semiconductor chips, liquid crystal and other displays, and other electronic devices. These customers may use what they manufacture in their own end products or sell the items to other companies for use in advanced electronic components. Applied's fiscal year ends on the last Sunday in October.
As of October 30, 2016 , Applied operates in three reportable segments: Semiconductor Systems (previously Silicon Systems), Applied Global Services, and Display and Adjacent Markets. A summary of financial information for each reportable segment is found in Note 14 of Notes to Consolidated Financial Statements. A discussion of factors that could affect operations is set forth under "Risk Factors" in Item 1A, which is incorporated herein by reference.
Effective in the third quarter of fiscal 2016, Applied began to account for its flexible coating systems (previously included in its Energy and Environmental Solutions segment) and display upgrade equipment (previously included in its Applied Global Services segment) under its Display and Adjacent Markets segment (previously Display). As a result of these changes, Applied's solar business (previously included in the Energy and Environmental Solutions segment) is included in Corporate and Other as it did not meet the threshold for a separate reportable segment. Results from prior periods have been recast to conform to the current presentation.
Net sales by reportable segment for the past three fiscal years were as follows:
| 2016 |
| 2015 |
| 2014 | ||||||||||||
|
|
|
|
|
|
|
|
|
|
|
| ||||||
| (In millions, except percentages) | ||||||||||||||||
Semiconductor Systems | $ | 6,873 | |
| 64% |
| $ | 6,135 | |
| 64% |
| $ | 5,978 | |
| 66% |
Applied Global Services | 2,589 | |
| 24% |
| 2,447 | |
| 25% |
| 2,114 | |
| 24% | |||
Display and Adjacent Markets | 1,206 | |
| 11% |
| 944 | |
| 10% |
| 848 | |
| 9% | |||
Corporate and Other | 157 | |
| 1% |
| 133 | |
| 1% |
| 132 | |
| 1% | |||
Total | $ | 10,825 | |
| 100% |
| $ | 9,659 | |
| 100% |
| $ | 9,072 | |
| 100% |
Semiconductor Systems
Applied's Semiconductor Systems segment develops, manufactures and sells a wide range of manufacturing equipment used to fabricate semiconductor chips, also referred to as integrated circuits (ICs). The Semiconductor Systems segment includes semiconductor capital equipment for deposition, etch, ion implantation, rapid thermal processing, chemical mechanical planarization, metrology and inspection, and wafer packaging. The majority of Applied's new equipment sales are to leading integrated device manufacturers and foundries worldwide.
Transistor and Interconnect
Applied's transistor and interconnect products and technologies have enabled multiple generations of device scaling from planar transistors to today's 3D multi-gate FinFET transistors. Applied offers products and technologies for transistor and interconnect fabrication, including epitaxy, ion implantation, oxidation and nitridation, rapid thermal processing, chemical vapor deposition, physical vapor deposition, chemical mechanical planarization and electrochemical deposition. Many of these process steps are used multiple times throughout the semiconductor chip fabrication process.
4
Table of Contents
Transistor and Interconnect Technologies |
| Product(s) |
Epitaxy Epitaxial silicon (epitaxy or epi) is a layer of pure silicon grown in a uniform crystalline structure on the wafer to form a high quality base for the device circuity. Epi technology is used in an increasing number of IC devices in both the wafer surface and transistor areas of a chip to enhance speed. |
| Centura RP Epi |
Ion Implant Ion implantation is a key technology for forming transistors and is used many times during chip fabrication. During ion implantation, wafers are bombarded by a beam of electrically-charged ions, called dopants, which change the electrical properties of the exposed surface films. |
| VIISta Systems |
Oxidation/Nitridation Applied's systems provide critical oxidation steps - like memory gate oxide, shallow trench isolation and liner oxide - for advanced device scaling. |
| Vantage, Radiance and Centura Systems |
Rapid Thermal Processing (RTP) RTP is used primarily for annealing, which modifies the properties of deposited films. Applied's single-wafer RTP systems are also used for growing high quality oxide and oxynitride films. |
| Vantage Systems |
Physical Vapor Deposition (PVD) PVD is used to deposit high quality metal films with low resistivity for contact and interconnect devices. Applications include metal gate, silicides, contact liner/barrier, interconnect copper barrier seed and metal hard mask. |
| Endura Systems |
Chemical Vapor Deposition (CVD) CVD is used to deposit dielectric and metal films on a wafer. During the CVD process, gases that contain atoms of the material to be deposited react on the wafer surface, forming a thin film of solid material. |
| Endura and Centura Systems |
Chemical Mechanical Planarization (CMP) CMP is used to planarize a wafer surface, a process that allows subsequent photolithography patterning and material deposition steps to occur with greater accuracy, resulting in more highly uniform film layers with minimal thickness variations. |
| Reflexion Systems |
Electrochemical Deposition (ECD) ECD is a process by which metal atoms from a chemical fluid (an electrolyte) are deposited on the surface of an immersed object. |
| Raider Platform |
Patterning and Packaging
Applied offers patterning, selective removal and packaging products and systems that enable the transfer of patterns onto device structures, making it possible to etch masks used for photolithography, and perform deposition, etching, and related processes. These systems and technologies address challenges resulting from shrinking pattern dimensions and the complexity in vertical stacking found in today's most advanced semiconductor devices.
Patterning and Packaging Technologies |
| Product(s) |
Atomic Layer Deposition (ALD) ALD technology enables customers to fabricate thin films of either conducting or insulating material with uniform coverage in nanometer-sized structures. |
| Olympia System |
Chemical Vapor Deposition (CVD) CVD is used to deposit dielectric and metal films on a wafer. During the CVD process, gases that contain atoms of the material to be deposited react on the wafer surface, forming a thin film of solid material. |
| Producer Systems |
Etch Etching is used many times throughout the IC manufacturing process to selectively remove material from the surface of a wafer. Applied offers systems for etching dielectric, metal, and silicon films to meet the requirements of advanced processing. |
| Centris and Producer Systems |
5
Table of Contents
Imaging and Process Control
Applied offers a suite of metrology, inspection and review systems for front- and back-end-of-line applications. These systems' imaging capabilities and algorithms employ optical and e-beam technologies to meet the most advanced technical demands, such as self-aligned double and quad patterning, extreme ultraviolet layers, measurement-intensive optimal proximity correction mask qualification, and emerging 3D architectures. Applied delivers leading-edge capabilities that enable chipmakers to establish accurate statistical process control, ramp up production runs rapidly, and achieve consistently high production yields.
Imaging and Process Control Technologies |
| Product(s) |
Metrology and Inspection Metrology and inspection tools are used to locate, measure, and analyze critical defects and features on the wafer during various stages of the fabrication processes. Applied enables customers to characterize and control critical dimension (CD) and defect issues, especially at advanced generation technology nodes. |
| SEMVision G6 Defect Analysis |
Applied Global Services
The Applied Global Services (AGS) segment provides integrated solutions to optimize equipment and fab performance and productivity, including spares, upgrades, services, remanufactured earlier generation equipment and factory automation software for semiconductor, display and other products. Customer demand for products and services is fulfilled through a global distribution system with trained service engineers located in close proximity to customer sites in more than a dozen countries and 82 locations to support approximately 34,000 installed Applied semiconductor, display and other manufacturing systems worldwide. Applied offers the following general types of services and products under the Applied Global Services segment.
AGS Solutions and Technology |
Certified Services A comprehensive service product portfolio that combines service technology and tool specific performance commitments in order to optimize customer factory productivity. |
Fab Consulting Experts using advanced analytical tools to solve production problems that have the greatest impact on customer fab productivity. |
Parts Programs Spare parts portfolio targets key manufacturing challenges and balances inventory cost and risk to efficiently meet customer fab requirements. |
Subfab Equipment Applied SubFab solutions lower costs, save energy, reduce environmental impact, and meet Environmental Protection Agency reporting regulations for greenhouse gas emissions. |
Legacy Equipment Comprehensive 200mm equipment and upgrades portfolio to address a full spectrum of production needs and extend tool lifetime. Applied legacy equipment supports new technology for a broad variety of devices including analog, power, and MEMS. |
Automation Software Automation software coordinates and streamlines every aspect of a factory-the processes, equipment and people-to provide competitive advantage to customers. |
6
Table of Contents
Display and Adjacent Markets
The Display and Adjacent Markets segment is comprised of products for manufacturing liquid crystal displays (LCDs), organic light-emitting diodes (OLEDs), and other display technologies for TVs, personal computers (PCs), tablets, smart phones, and other consumer-oriented devices as well as equipment for flexible substrates. While similarities exist between the technologies utilized in semiconductor and display fabrication, the most significant differences are in the size and composition of the substrate. Substrates used to manufacture display panels and other devices are typically glass, although newer flexible materials are entering the market. Display and Adjacent Markets industry growth depends primarily on consumer demand for increasingly larger and more advanced TVs and high resolution displays for mobile devices as well as new form factors, including thin, light and curved displays, and new applications such as virtual reality. The Display and Adjacent Markets segment offers a variety of technologies and products, including:
Display and Adjacent Markets Technologies |
| Product(s) |
Array Test LCD display substrates are inspected at many stages of production to maximize yield, minimize scrap, optimize equipment utilization, and monitor manufacturing processes. At the completion of the array stage, the performance of the millions of individual pixels on each display is tested. |
| Electron Beam Array Tester |
Defect Review Defects are identified during inspection steps and reviewed by a scanning electron microscope and other analyses to determine defect root cause and composition. |
| Electron Beam Review (EBR) |
Chemical Vapor Deposition (CVD) During CVD processing, gases containing material atoms or molecules are introduced into the process chamber. The gases form reactive radicals or ions, which undergo chemical reactions to form thin films on the heated substrate. |
| AKT PECVD Systems |
Physical Vapor Deposition (PVD) PVD is used to deposit high quality films of metals, alloys, transparent conductors and semiconductors. In Display, these films are used for contact, interconnect, transparent electrodes and transistor materials in display backplanes, as well as for transparent electrodes in color filters and touch panels. |
| AKT Aristo and PiVot Systems |
Flexible Technologies Flexible coating systems utilize physical vapor deposition, thermal evaporation, chemical vapor deposition, and e-beam technology to deposit thin layers of metal onto flexible substrates. |
| TopBeam, TopMet and SmartWeb Systems |
Backlog
Applied manufactures systems to meet demand represented by order backlog and customer commitments. Backlog consists of: (1) orders for which written authorizations have been accepted and assigned shipment dates are within the next 12 months, or shipment has occurred but revenue has not been recognized; and (2) contractual service revenue and maintenance fees to be earned within the next 12 months.
Backlog by reportable segment as of October 30, 2016 and October 25, 2015 was as follows:
| 2016 |
| 2015 | ||||||||
|
|
|
|
|
|
|
| ||||
| (In millions, except percentages) | ||||||||||
Semiconductor Systems | $ | 2,098 | |
| 45% |
| $ | 1,720 | |
| 55% |
Applied Global Services | 866 | |
| 19% |
| 779 | |
| 25% | ||
Display and Adjacent Markets | 1,539 | |
| 34% |
| 598 | |
| 19% | ||
Corporate and Other | 75 | |
| 2% |
| 45 | |
| 1% | ||
Total | $ | 4,578 | |
| 100% |
| $ | 3,142 | |
| 100% |
Applied's backlog on any particular date is not necessarily indicative of actual sales for any future periods, due to the potential for customer changes in delivery schedules or order cancellations. Customers may delay delivery of products or cancel orders prior to shipment, subject to possible cancellation penalties. Delays in delivery schedules or a reduction of backlog during any particular period could have a material adverse effect on Applied's business and results of operations.
7
Table of Contents
Manufacturing, Raw Materials and Supplies
Applied's manufacturing activities consist primarily of assembly, test and integration of various proprietary and commercial parts, components and subassemblies that are used to manufacture systems. Applied has implemented a distributed manufacturing model under which manufacturing and supply chain activities are conducted in various countries, including Germany, Israel, Italy, Singapore, Taiwan, the United States and other countries in Asia. Applied uses numerous vendors, including contract manufacturers, to supply parts and assembly services for the manufacture and support of its products, including some systems being completed at customer sites.
Although Applied makes reasonable efforts to assure that parts are available from multiple qualified suppliers, this is not always possible. Accordingly, some key parts may be obtained from only a single supplier or a limited group of suppliers. Applied seeks to reduce costs and to lower the risks of manufacturing and service interruptions by selecting and qualifying alternate suppliers for key parts; monitoring the financial condition of key suppliers; maintaining appropriate inventories of key parts; qualifying new parts on a timely basis; and ensuring quality and performance of parts.
Research, Development and Engineering
Applied's long-term growth strategy requires continued development of new materials engineering capabilities, including products and platforms that enable expansion into new and adjacent markets. Applied's significant investments in research, development and engineering (RD&E) must generally enable it to deliver new products and technologies before the emergence of strong demand, thus allowing customers to incorporate these products into their manufacturing plans during early-stage technology selection. Applied works closely with its global customers to design systems and processes that meet their planned technical and production requirements.
Applied's product development and engineering organizations are located primarily in the United States, as well as in Canada, China, Europe, India, Israel, Singapore and Taiwan. In addition, certain outsourced RD&E activities, process support and customer demonstrations are performed in the United States, India, China, Singapore and Taiwan.
Applied's investments in RD&E for product development and engineering programs over the last three fiscal years were as follows: $1.5 billion ( 14 percent of net sales) in fiscal 2016 , $1.5 billion ( 15 percent of net sales) in fiscal 2015 , and $1.4 billion ( 16 percent of net sales) in fiscal 2014 . Applied has spent an average of 15 percent of net sales in RD&E over the last five years. In addition to RD&E for specific product technologies, Applied maintains ongoing programs for automation control systems, materials research, environmental control and product ideation.
8
Table of Contents
Marketing and Sales
Net sales by geographic region for the past three fiscal years, determined by the location of customers' facilities to which products were shipped, were as follows:
|
|
|
|
|
|
|
|
|
|
|
| ||||||
| 2016 |
| 2015 |
| 2014 | ||||||||||||
|
|
|
|
|
|
|
|
|
|
|
| ||||||
| (In millions, except percentages) | ||||||||||||||||
Taiwan | $ | 2,843 | |
| 26% |
| $ | 2,600 | |
| 27% |
| $ | 2,702 | |
| 30% |
China | 2,259 | |
| 21% |
| 1,623 | |
| 17% |
| 1,608 | |
| 18% | |||
Korea | 1,883 | |
| 17% |
| 1,654 | |
| 17% |
| 965 | |
| 10% | |||
Japan | 1,279 | |
| 12% |
| 1,078 | |
| 11% |
| 817 | |
| 9% | |||
Southeast Asia | 803 | |
| 7% |
| 432 | |
| 4% |
| 356 | |
| 4% | |||
Asia Pacific | 9,067 | |
| 83% |
| 7,387 | |
| 76% |
| 6,448 | |
| 71% | |||
United States | 1,143 | |
| 11% |
| 1,630 | |
| 17% |
| 1,966 | |
| 22% | |||
Europe | 615 | |
| 6% |
| 642 | |
| 7% |
| 658 | |
| 7% | |||
Total | $ | 10,825 | |
| 100% |
| $ | 9,659 | |
| 100% |
| $ | 9,072 | |
| 100% |
Because of the highly technical nature of its products, Applied markets and sells products worldwide almost entirely through a direct sales force.
Global and regional economic conditions can impact the company's business and financial results. Applied's business is based on capital equipment investments by major semiconductor, display and other manufacturers, and is subject to significant variability in customer demand for Applied's products. Customers' expenditures depend on many factors, including: general economic conditions; anticipated market demand and pricing for semiconductors, display technologies and other electronic devices; the development of new technologies; customers' factory utilization; capital resources and financing; and government policies and incentives. In addition, a significant driver in the semiconductor and display industries is end-demand for mobile consumer products, which is characterized by seasonality that impacts the timing of customer investments in manufacturing equipment and, in turn, Applied's business.
Information on net sales to unaffiliated customers and long-lived assets attributable to Applied's geographic regions is included in Note 14 of Notes to Consolidated Financial Statements. The following companies accounted for at least 10 percent of Applied's net sales in each fiscal year, which were for products in multiple reportable segments.
| 2016 |
| 2015 |
| 2014 |
Taiwan Semiconductor Manufacturing Company Limited | 16% |
| 15% |
| 21% |
Samsung Electronics Co., Ltd. | 13% |
| 18% |
| 12% |
Micron Technology, Inc. | 11% |
| * |
| * |
Intel Corporation | 11% |
| * |
| * |
9
Table of Contents
Competition
The industries in which Applied operates are highly competitive and characterized by rapid technological change. Applied's ability to compete generally depends on its ability to timely commercialize its technology, continually improve its products, and develop new products that meet constantly evolving customer requirements. Significant competitive factors include technical capability and differentiation, productivity, cost-effectiveness and the ability to support a global customer base. The importance of these factors varies according to customers' needs, including product mix and respective product requirements, applications, and the timing and circumstances of purchasing decisions. Substantial competition exists in all areas of Applied's business. Competitors range from small companies that compete in a single region, which may benefit from policies and regulations that favor domestic companies, to global, diversified companies. Applied's ability to compete requires a high level of investment in RD&E, marketing and sales, and global customer support activities. Management believes that many of Applied's products have strong competitive positions.
The competitive environment for each segment is described below.
The semiconductor industry has been increasingly driven by consumer demand for lower-cost electronic products with increased capability, particularly mobility devices such as smartphones and tablets. The growth of data and new innovations such as augmented and virtual reality and smart vehicles are also creating new opportunities for the industry. As a result, products within the Semiconductor Systems segment are subject to significant changes in customer requirements, including transitions to smaller dimensions, new materials and an increasing number of applications. While certain existing technologies may be adapted to new requirements, some applications create the need for an entirely different technological approach. The rapid pace of technological change can quickly diminish the value of current technologies and products and create opportunities for existing and new competitors. Applied offers a variety of technologically-differentiated products that must continuously evolve to satisfy customers' requirements in order to compete effectively in the marketplace. Applied allocates resources among its numerous product offerings and therefore may decide not to invest in an individual product to the same degree as competitors who specialize in fewer products. There are a number of competitors serving the semiconductor manufacturing equipment industry, which has experienced increasing consolidation. Some of these competitors offer a single product line and others offer multiple product lines, and range from suppliers serving a single region to global, diversified companies. The competitive environment for Semiconductor Systems in fiscal 2016 reflected steady overall demand for semiconductor equipment, with continued investments by memory customers in technology upgrades and additional capacity, reflecting primarily the transition from planar technology to 3D architectures. Demand from foundry customers reflected investments in new technology at advanced nodes, driven by demand for advanced mobile chips.
Products and services within the Applied Global Services segment complement Semiconductor Systems and Display and Adjacent Markets segments' products in markets that are characterized by demanding worldwide service requirements and a diverse group of numerous competitors. To compete effectively, Applied offers products and services to improve tool performance, lower overall cost of ownership, and increase the productivity and energy efficiency of customers' fab operations. Significant competitive factors include productivity, cost-effectiveness, and the level of technical service and support. The importance of these factors varies according to customers' needs and the type of products or services offered. Industry conditions that affected Applied Global Services' sales of spares and services in fiscal 2016 were principally semiconductor manufacturers' wafer starts and factory utilization rates.
Products in the Display and Adjacent Markets segment are generally subject to strong competition from a number of major competitors primarily in Asia. Applied holds established market positions with its technically-differentiated LCD and OLED manufacturing solutions for PECVD, color filter PVD, PVD array, PVD touch panel, and TFT array testing, although its market position could change quickly due to customers' evolving requirements. The Company has also entered a new business in yield control with its new inline e-beam review (EBR) system. The competitive environment for the Display and Adjacent Markets Groups in fiscal 2016 was characterized by increasing demand for manufacturing equipment for high-end mobile devices and continued demand for TV manufacturing equipment, although the TV manufacturing equipment sector remains susceptible to cyclical conditions. Important factors affecting the competitive position of Applied's Display and Adjacent Markets products include: industry trends, Applied's ability to innovate and develop new products, and the extent to which Applied's products are technically-differentiated, as well as which customers within a highly concentrated customer base are making capital equipment investments and Applied's existing position at these customers.
10
Table of Contents
Patents and Licenses
Applied's competitive position significantly depends upon its research, development, engineering, manufacturing and marketing capabilities, as well as its patent position. Protection of Applied's technology assets through enforcement of its intellectual property rights, including patents, is important. Applied's practice is to file patent applications in the United States and other countries for inventions that it considers significant. Applied has approximately 10,200 patents in the United States and other countries, and additional applications are pending for new inventions. Although Applied does not consider its business materially dependent upon any one patent, the rights of Applied and the products made and sold under its patents, taken as a whole, are a significant element of its business. In addition to its patents, Applied possesses other intellectual property, including trademarks, know-how, trade secrets, and copyrights.
Applied enters into patent and technology licensing agreements with other companies when it is determined to be in its best interest. Applied pays royalties under existing patent license agreements for the use, in several of its products, of certain patented technologies. Applied also receives royalties from licenses granted to third parties. Royalties received from or paid to third parties have not been, and are not expected to be, material to Applied's consolidated results of operations.
In the normal course of business, Applied periodically receives and makes inquiries regarding possible patent infringement. In responding to such inquiries, it may become necessary or useful for Applied to obtain or grant licenses or other rights. However, there can be no assurance that such licenses or rights will be available to Applied on commercially reasonable terms, or at all. If Applied is not able to resolve or settle claims, obtain necessary licenses on commercially reasonable terms, or successfully prosecute or defend its position, Applied's business, financial condition and results of operations could be materially and adversely affected.
Environmental Matters
Applied maintains a number of environmental, health, and safety programs that are primarily preventative in nature. As part of these programs, Applied regularly monitors ongoing compliance with applicable laws and regulations. In addition, Applied has trained personnel to conduct investigations of any environmental, health, or safety incidents, including, but not limited to, spills, releases, or possible contamination.
Compliance with federal, state and local environmental, health and safety laws and regulations, including those regulating the discharge of materials into the environment, remedial agreements, and other actions relating to the environment have not had, and are not expected to have, a material effect on Applied's capital expenditures, competitive position, financial condition, or results of operations.
The most recent report on Applied's environmental, health and safety activities can be found in Applied's latest Citizenship Report on its website at http://www.appliedmaterials.com/company/corporate-responsibility/reports. The Citizenship Report is updated periodically. This website address is intended to be an inactive textual reference only. None of the information on, or accessible through, Applied's website is part of this Form 10-K or is incorporated by reference herein.
Employees
At October 30, 2016 , Applied employed approximately 15,600 regular employees and 1,100 temporary employees. In the high-technology industry, competition for highly-skilled employees is intense. Applied believes that its future success is highly dependent upon its continued ability to attract, retain and motivate qualified employees.
11
Table of Contents
Executive Officers of the Registrant
The following table and notes set forth information about Applied's executive officers:
Name of Individual | Position |
Gary E. Dickerson(1) | President, Chief Executive Officer |
Ginetto Addiego(2) | Senior Vice President, Engineering, Operations and Quality |
Robert J. Halliday(3) | Senior Vice President, Chief Financial Officer |
Thomas F. Larkins(4) | Senior Vice President, General Counsel and Corporate Secretary |
Omkaram Nalamasu(5) | Senior Vice President, Chief Technology Officer |
Ali Salehpour(6) | Senior Vice President, General Manager, New Markets and Service Group |
Charles Read(7) | Corporate Vice President, Corporate Controller and Chief Accounting Officer |
(1) | Mr. Dickerson, age 59, was named President of Applied in June 2012 and appointed Chief Executive Officer and a member of the Board of Directors in September 2013. Before joining Applied, he served as Chief Executive Officer and a director of Varian Semiconductor Equipment Associates, Inc. (Varian) from 2004 until its acquisition by Applied in November 2011. Prior to Varian, Mr. Dickerson served 18 years with KLA-Tencor Corporation (KLA-Tencor), a supplier of process control and yield management solutions for the semiconductor and related industries, where he held a variety of operations and product development roles, including President and Chief Operating Officer. Mr. Dickerson started his semiconductor career in manufacturing and engineering management at General Motors' Delco Electronics Division and then AT&T Technologies. |
(2) | Dr. Addiego, age 57, has been Senior Vice President, Engineering, Operations and Quality since June 2015. He served as Senior Vice President, Engineering from March 2014 to June 2015. He previously was with Applied from 1996 to 2005, leading various product groups as well as global organizations, including Global Operations, Foundation Engineering, and Information Technology. From March 2011 to March 2014, Dr. Addiego was President and Chief Operating Officer of Ultra Clean Technology Corp., a supplier of critical subsystems for the semiconductor capital equipment, medical device, energy, research, and flat panel industries. From February 2005 to March 2011, Dr. Addiego worked at Novellus Systems, Inc., a provider of advanced process equipment for the semiconductor industry, where he served as Executive Vice President and Chief Administrative Officer and Executive Vice President of Corporate Global Operations. |
(3) | Mr. Halliday, age 62, has been Senior Vice President, Chief Financial Officer of Applied since February 2013. He previously served as a Group Vice President and General Manager in Applied's Silicon Systems segment following the completion of Applied's acquisition of Varian in November 2011. Mr. Halliday had served as Chief Financial Officer of Varian since 2001 and as an Executive Vice President of Varian since 2004. He was Varian's Treasurer from November 2002 to October 2006 and from February 2009 to February 2010. |
(4) | Mr. Larkins, age 55, has been Senior Vice President, General Counsel and Corporate Secretary of Applied since November 2012. Previously, Mr. Larkins was employed by Honeywell International Inc., a diversified global technology and manufacturing company, where he was Vice President, Corporate Secretary and Deputy General Counsel from 2002 until joining Applied. Mr. Larkins served in various other positions at Honeywell (formerly AlliedSignal) after joining the company in 1997. |
(5) | Dr. Nalamasu, age 58, has been Senior Vice President, Chief Technology Officer since June 2013, and President of Applied Ventures, LLC, Applied's venture capital arm, since November 2013. He had served as Group Vice President, Chief Technology Officer from January 2012 to June 2013, and as Corporate Vice President, Chief Technology Officer from January 2011 to January 2012. Upon joining Applied in June 2006 until January 2011, Dr. Nalamasu was an Appointed Vice President of Research and served as Deputy Chief Technology Officer and General Manager for the Advanced Technologies Group. From 2002 to 2006, Dr. Nalamasu was a NYSTAR distinguished professor of Materials Science and Engineering at Rensselaer Polytechnic Institute, where he also served as Vice President of Research from 2005 to 2006. Prior to Rensselaer, Dr. Nalamasu served in several leadership roles at Bell Laboratories. |
(6) | Mr. Salehpour, age 55, has been Senior Vice President, General Manager, New Markets and Service Group since September 2013. He previously served as Group Vice President, General Manager Energy and Environmental Solutions and Display Business Groups, since joining Applied in November 2012. Prior to Applied, Mr. Salehpour worked at KLA-Tencor for 16 years, where he served as a Senior Vice President and General Manager and worked for 10 years in senior management positions at Schlumberger Test Systems. |
12
Table of Contents
(7) | Mr. Read, age 50, has been Corporate Vice President, Corporate Controller and Chief Accounting Officer of Applied since joining the Company in September 2013. Prior to Applied, Mr. Read worked at Brocade Communications Systems, Inc., a provider of semiconductor and software-based network solutions, since October 2002, where he most recently served as Vice President, Corporate Controller. Prior to Brocade, Mr. Read worked at KPMG LLP, an audit, tax and advisory firm, from 1996 to 2002. |
Available Information
Applied's website is http://www.appliedmaterials.com. Applied makes available free of charge, on or through its website, its annual, quarterly and current reports, and any amendments to those reports, as soon as reasonably practicable after electronically filing such reports with, or furnishing them to, the SEC. The SEC's website, www.sec.gov, contains reports, proxy and information statements, and other information regarding issuers that file electronically with the SEC. These website addresses are intended to be an inactive textual references only. None of the information on, or accessible through, these websites is part of this Form 10-K or is incorporated by reference herein.
13
Table of Contents
Item 1A: | Risk Factors |
The following risk factors could materially and adversely affect Applied's business, financial condition or results of operations and cause reputational harm, and should be carefully considered in evaluating the Company and its business, in addition to other information presented elsewhere in this report.
The industries that Applied serves can be volatile and difficult to predict.
As a supplier to the global semiconductor and display and related industries, Applied is subject to business cycles, the timing, length and volatility of which can be difficult to predict and which vary among its businesses. These industries historically have been cyclical and are subject to volatility and sudden changes in customer requirements for new manufacturing capacity and advanced technology, which depend on several factors, including general economic conditions, end-user demand, customers' capacity utilization, production volumes, access to affordable capital, consumer buying patterns, inventory levels relative to demand, and technology transitions. These changes can affect the timing and amounts of customer investments in technology and manufacturing equipment, and can have a significant impact on Applied's net sales, operating expenses, gross margins and net income. The amount and mix of capital equipment spending between different products and technologies can have a significant impact on the results of operations of Applied's Semiconductor Systems segment, which is the largest contributor to its consolidated net sales.
To meet rapidly changing demand in the industries it serves, Applied must accurately forecast demand and effectively manage its resources and production capacity across its businesses, and may incur unexpected or additional costs to align its business operations. During periods of increasing demand for its products, Applied must have sufficient manufacturing capacity and inventory to meet customer demand; effectively manage its supply chain; attract, retain and motivate a sufficient number of qualified employees; and continue to control costs. During periods of decreasing demand, Applied must reduce costs and align its cost structure with prevailing market conditions; effectively manage its supply chain; and motivate and retain key employees. If Applied does not effectively manage these challenges during periods of changing demand, its business performance and results of operations may be adversely impacted. Even with effective allocation of resources and management of costs, during periods of decreasing demand, Applied's gross margins and earnings may be adversely impacted.
Applied is exposed to risks associated with an uncertain global economy.
Uncertain global economic and business conditions, along with uncertainties in the financial markets, national debt and fiscal concerns in various regions, pose challenges to the industries in which Applied operates. Markets for semiconductors and displays depend largely on business and consumer spending and demand for electronic products. Economic uncertainty and related factors exacerbate negative trends in business and consumer spending and may cause certain Applied customers to push out, cancel, or refrain from purchasing for equipment or services, which may have an adverse impact on Applied's revenues, results of operations and financial condition. Uncertain market conditions, difficulties in obtaining capital, or reduced profitability may also cause some customers to scale back operations, exit businesses, merge with other manufacturers, or file for bankruptcy protection and potentially cease operations, which can also result in lower sales, additional inventory or bad debt expense for Applied. Economic and industry uncertainty may similarly affect suppliers, which could impair their ability to deliver parts and negatively affect Applied's ability to manage operations and deliver its products. These conditions may also lead to consolidation or strategic alliances among other equipment manufacturers, which could adversely affect Applied's ability to compete effectively.
Uncertain economic and industry conditions also make it more challenging for Applied to forecast its operating results, make business decisions, and identify and prioritize the risks that may affect its businesses, sources and uses of cash, financial condition and results of operations. If Applied does not appropriately manage its business operations, it could have a significant negative impact on its business performance and financial condition. Applied may be required to implement additional cost reduction efforts, including restructuring activities, which may adversely affect Applied's ability to capitalize on opportunities. Even during periods of economic uncertainty or lower revenues, Applied must continue to invest in research and development and maintain a global business infrastructure to compete effectively and support its customers, which can have a negative impact on its operating margins and earnings.
Applied maintains an investment portfolio that is subject to general credit, liquidity, market and interest rate risks. The risks to Applied's investment portfolio may be exacerbated if financial market conditions deteriorate and, as a result, the value and liquidity of the investment portfolio, as well as returns on pension assets, could be negatively impacted and lead to impairment charges. Applied also maintains cash balances in various bank accounts globally in order to fund normal operations. If any of these financial institutions becomes insolvent, it could limit Applied's ability to access cash in the affected accounts, which could affect its ability to manage its operations.
14
Table of Contents
Applied is exposed to risks as a result of ongoing changes in the various industries in which it operates.
The global semiconductor, display and related industries in which Applied operates are characterized by ongoing changes affecting some or all of these industries that impact demand for and the profitability of Applied's products, including:
• | the nature, timing and degree of visibility of changes in end demand for electronic products, including those related to fluctuations in consumer buying patterns tied to seasonality or the introduction of new products, and the effects of these changes on foundry and other customers' businesses and on demand for Applied's products; |
• | increasing capital requirements for building and operating new fabrication plants and customers' ability to raise the necessary capital; |
• | regulatory or tax policies impacting the timing of customers' investment in new or expanded fabrication plants; |
• | differences in growth rates among the semiconductor, display and other industries in which Applied operates; |
• | the increasing importance of establishing, improving and maintaining strong relationships with customers; |
• | the increasing cost and complexity for customers to move from product design to volume manufacturing, which may slow the adoption rate of new manufacturing technology; |
• | the need for customers to continually reduce the total cost of manufacturing system ownership; |
• | the heightened importance to customers of system reliability and productivity and the effect on demand for fabrication systems as a result of their increasing productivity, device yield and reliability; |
• | manufacturers' ability to reconfigure and re-use fabrication systems which can reduce demand for new equipment; |
• | the increasing importance of, and difficulties in, developing products with sufficient differentiation to influence customers' purchasing decisions; |
• | requirements for shorter cycle times for the development, manufacture and installation of manufacturing equipment; |
• | price and performance trends for semiconductor devices and displays, and the corresponding effect on demand for such products; |
• | the increasing importance of the availability of spare parts to maximize the time that customers' systems are available for production; |
• | the increasing role for and complexity of software in Applied products; and |
• | the increasing focus on reducing energy usage and improving the environmental impact and sustainability associated with manufacturing operations. |
Applied is exposed to risks as a result of ongoing changes specific to the semiconductor industry.
The largest proportion of Applied's consolidated net sales and profitability is derived from sales of manufacturing equipment in the Semiconductor Systems segment to the global semiconductor industry. In addition, a majority of the revenues of Applied Global Services is from sales to semiconductor manufacturers. The semiconductor industry is characterized by ongoing changes particular to this industry that impact demand for and the profitability of Applied's semiconductor equipment and service products, including:
• | the increasing cost of research and development due to many factors, including decreasing linewidths on a chip, the use of new materials, new and more complex device structures, more applications and process steps, increasing chip design costs, and the increasing cost and complexity of integrated manufacturing processes; |
• | the need to reduce product development time, despite the increasing difficulty of technical challenges; |
• | the growing number of types and varieties of semiconductors and number of applications across multiple substrate sizes; |
• | the increasing cost and complexity for semiconductor manufacturers to move more technically advanced capability and smaller linewidths to volume manufacturing, and the resulting impact on the rates of technology transition and investment in capital equipment; |
• | challenges in generating organic growth given semiconductor manufacturers' levels of capital expenditures and the allocation of capital investment to market segments that Applied does not serve, such as lithography, or segments where Applied's products have lower relative market presence; |
• | the importance of increasing market positions in segments with growing demand; |
• | semiconductor manufacturer's ability to reconfigure and re-use equipment, and the resulting effect on their need to purchase new equipment and services; |
15
Table of Contents
• | the increasing frequency and complexity of technology transitions and inflections, such as 3-D transistors and advanced interconnects, and Applied's ability to timely and effectively anticipate and adapt to these changes; |
• | shorter cycle times between order placements by customers and product shipment require greater reliance on forecasting of customer investment, which may lead to inventory write-offs and manufacturing inefficiencies that decrease gross margin; |
• | competitive factors that make it difficult to enhance position, including challenges in securing development-tool-of-record (DTOR) and production-tool-of-record (PTOR) positions with customers; |
• | consolidation in the semiconductor industry, including among semiconductor manufacturers and among manufacturing equipment suppliers; |
• | shifts in sourcing strategies by computer and electronics companies that impact the equipment requirements of Applied's foundry customers; |
• | the concentration of new wafer starts in Korea and Taiwan, where Applied's service penetration and service-revenue-per-wafer-start have been lower than in other regions; |
• | investment in semiconductor manufacturing capabilities in China, and its effect on the demand for semiconductor manufacturing equipment; and |
• | the increasing fragmentation of semiconductor markets, leading certain markets to become too small to support the cost of a new fabrication plant, while others require less technologically advanced products. |
If Applied does not accurately forecast, and allocate appropriate resources and investment towards addressing, key technology changes and inflections, successfully develop and commercialize products to meet demand for new technologies, and effectively address industry trends, its business and results of operations may be adversely impacted.
Applied is exposed to risks as a result of ongoing changes specific to the display industry.
The global display industry historically has experienced considerable volatility in capital equipment investment levels, due in part to the limited number of display manufacturers, the concentrated nature of end-use applications, production capacity relative to end-use demand, and panel manufacturer profitability. Industry growth depends primarily on consumer demand for increasingly larger and more advanced TVs, and on demand for advanced smartphones and mobile device displays, which demand is highly sensitive to cost and improvements in technologies and features. The display industry is characterized by ongoing changes particular to this industry that impact demand for and the profitability of Applied's display products, including:
• | the importance of new types of display technologies, such as organic light-emitting diode (OLED), low temperature polysilicon (LTPS), flexible displays and metal oxide, and new touch panel films; |
• | the timing and extent of an expansion of manufacturing facilities in China, which may be affected by changes in economic conditions in China; |
• | the rate of transition to larger substrate sizes for TVs and to new display technologies for TVs and mobile applications, and the resulting effect on capital intensity in the industry and on Applied's product differentiation, gross margin and return on investment; and |
• | the variability in demand for display manufacturing equipment, and uncertainty with respect to future display technology end-use applications and growth drivers. |
If Applied does not successfully develop and commercialize products to meet demand for new and emerging display technologies, or if industry demand for display manufacturing equipment and technologies slows, Applied's business and its results of operations may be adversely impacted.
The industries in which Applied operates are highly competitive and subject to rapid technological and market changes.
Applied operates in a highly competitive environment in which innovation is critical, and its future success depends on many factors, including the development of new technologies and effective commercialization and customer acceptance of its equipment, services and related products. In order to successfully grow its businesses, Applied must increase its position in its current markets, expand into adjacent and new markets, and optimize operational performance. The development, introduction and support of a broadening set of products in a geographically diverse and competitive environment, and that may require greater collaboration with customers and other industry participants, have grown more complex and expensive over time. Furthermore, new or improved products may entail higher costs and lower profits. To compete successfully, Applied must:
16
Table of Contents
• | identify and address technology inflections, market changes, new applications, customer requirements and end-use demand; |
• | develop new products and disruptive technologies, improve and develop new applications for existing products, and adapt products for use by customers in different applications and markets with varying technical requirements; |
• | differentiate its products from those of competitors, meet customers' performance specifications, appropriately price products, and achieve market acceptance; |
• | maintain operating flexibility to enable responses to changing markets, applications, customers and customer requirements; |
• | enhance its worldwide operations across its businesses to reduce cycle time, enable continuous quality improvement, reduce costs, and enhance design for manufacturability and serviceability; |
• | focus on product development and sales and marketing strategies that address customers' high value problems and strengthen customer relationships; |
• | effectively allocate resources between its existing products and markets, the development of new products, and expanding into new and adjacent markets; |
• | improve the productivity of capital invested in R&D activities; |
• | accurately forecast demand, work with suppliers and meet production schedules for its products; |
• | improve its manufacturing processes and achieve cost efficiencies across product offerings; |
• | adapt to changes in value offered by companies in different parts of the supply chain; |
• | qualify products for evaluation and volume manufacturing with its customers; and |
• | implement changes in its design engineering methodology to reduce material costs and cycle time, increase commonality of platforms and types of parts used in different systems, and improve product life cycle management. |
If Applied does not successfully anticipate technology inflections, develop and commercialize new products and technologies, and respond to changes in customer requirements and market trends, its business performance and results of operations may be adversely impacted.
Applied is exposed to risks associated with a highly concentrated customer base.
Applied's customer base is highly concentrated, and has become increasingly concentrated as a result of continued consolidation. Applied's customer base is also geographically concentrated. A relatively limited number of manufacturers account for a substantial portion of Applied's business. As a result, the actions of even a single customer can expose Applied's business and results of operations to greater volatility. The mix and type of customers, and sales to any single customer, may vary significantly from quarter to quarter and from year to year, and have a significant impact on Applied's net sales, gross margins and net income. Applied's products are configured to customer specifications, and changing, rescheduling or canceling orders may result in significant, non-recoverable costs. If customers do not place orders, or they substantially reduce, delay or cancel orders, Applied may not be able to replace the business, which may have a significant adverse impact on its results of operations and financial condition. The concentration of Applied's customer base increases its risks related to the financial condition of its customers, and the deterioration in financial condition of a single customer or the failure of a single customer to perform its obligations could have a material adverse effect on Applied's results of operations and cash flow. To the extent its customers experience liquidity constraints, Applied may incur additional bad debt expense, which may have a significant impact on its results of operations. Major customers may also seek pricing, payment, intellectual property-related, or other commercial terms that are less favorable to Applied, which may have a negative impact on Applied's business, revenue and gross margins.
Applied is exposed to the risks of operating a global business.
Applied has product development, engineering, manufacturing, sales and other operations in many countries, and some of its business activities are concentrated in certain geographic areas. Moreover, in fiscal 2016 , approximately 89 percent of Applied's net sales were to customers in regions outside the United States. As a result of the global nature of its operations, Applied's business performance and results of operations may be adversely affected by a number of factors, including:
• | varying regional economic and geopolitical business conditions and demands; |
17
Table of Contents
• | political and social attitudes, laws, rules, regulations and policies within countries that favor domestic companies over non-domestic companies, including customer- or government-supported efforts to promote the development and growth of local competitors; |
• | customer- or government-supported efforts to influence Applied to conduct more of its operations and sourcing in a particular country, such as Korea and China; |
• | variations among, and changes in, local, regional, national or international laws and regulations, including contract, intellectual property, labor, tax, and import/export laws, and the interpretation and application of such laws and regulations; |
• | global trade issues, including the ability to obtain required import and export licenses, and international trade disputes; |
• | ineffective or inadequate legal protection of intellectual property rights in certain countries; |
• | positions taken by governmental agencies regarding possible national commercial and/or security issues posed by international business operations; |
• | fluctuating raw material, commodity, energy and shipping costs or shipping delays; |
• | geographically diverse operations and projects, which require an effective organizational structure and allocation of resources, and appropriate business processes, procedures and controls; |
• | supply chain interruptions, and service interruptions from utilities, transportation, data hosting or telecommunications providers; |
• | a diverse workforce with different experience levels, languages, cultures, customs, business practices and worker expectations, and differing employment practices and labor issues; |
• | variations in the ability to develop relationships with local customers, suppliers and governments; |
• | fluctuations in interest rates and currency exchange rates, including the relative strength or weakness of the U.S. dollar against the Japanese yen, euro, Taiwanese dollar, Israeli shekel, Chinese yuan or Singapore dollar; |
• | the need to provide sufficient levels of technical support in different locations around the world; |
• | political instability, natural disasters, pandemics, social unrest, terrorism or acts of war in locations where Applied has operations, suppliers or sales, or that may influence the value chain of the industries that Applied serves; |
• | hiring and integration of an increasing number of workers in new countries; |
• | the increasing need for a mobile workforce to work in or travel to different regions; and |
• | uncertainties with respect to economic growth rates in various countries, including for the manufacture and sale of semiconductors and displays in the developing economies of certain countries. |
Many of these challenges are present in China and Korea, which are experiencing significant growth of customers, suppliers and competitors to Applied. Applied further believes that China and Korea present large potential markets for its products and opportunity for growth over the long term, although at lower projected levels of profitability and margins for certain products than historically have been achieved in other regions. In addition, government authorities may impose conditions that require the use of local suppliers or partnerships with local companies, require the license or other transfer of intellectual property, or engage in other efforts to promote local businesses and local competitors, which could have a significant adverse impact on Applied's business.
Applied is exposed to risks associated with business combinations, acquisitions and strategic investments.
Applied engages in acquisitions of or investments in companies, technologies or products in existing, related or new markets for Applied. Business combinations, acquisitions and investments involve numerous risks to Applied's business, financial condition and operating results, including but not limited to:
• | diversion of management's attention and disruption of ongoing businesses; |
• | contractual restrictions on the conduct of Applied's business during the pendency of a proposed transaction ; |
• | inability to complete proposed transactions due to the failure to obtain regulatory or other approvals, litigation or other disputes, and any ensuing obligation to pay a termination fee; |
• | the failure to realize expected returns from acquired businesses; |
• | requirements imposed by government regulators in connection with their review of a transaction, which may include, among other things, divestitures and restrictions on the conduct of Applied's existing business or the acquired business; |
• | ineffective integration of operations, systems, technologies, products or employees, which can impact the ability to realize anticipated synergies or other benefits; |
18
Table of Contents
• | failure to commercialize technologies from acquired businesses or developed through strategic investments; |
• | dependence on unfamiliar supply chains or relatively small supply partners; |
• | inability to capitalize on characteristics of new markets that may be significantly different from Applied's existing markets and where competitors may have stronger market positions and customer relationships; |
• | failure to retain and motivate key employees of acquired businesses; |
• | the potential impact of the announcement or consummation of a proposed transaction on relationships with third parties; |
• | potential changes in Applied's credit rating, which could adversely impact the Company's access to and cost of capital; |
• | reductions in cash balances or increases in debt obligations to finance activities associated with a transaction, which reduce the availability of cash flow for general corporate or other purposes, including share repurchases and dividends; |
• | exposure to new operational risks, rules, regulations, worker expectations, customs and practices to the extent acquired businesses are located in regions where Applied has not historically conducted business; |
• | challenges associated with managing new, more diverse and more widespread operations, projects and people; |
• | inability to obtain and protect intellectual property rights in key technologies; |
• | inadequacy or ineffectiveness of an acquired company's internal financial controls, disclosure controls and procedures, or environmental, health and safety, anti-corruption, human resource, or other policies or practices; |
• | impairment of acquired intangible assets and goodwill as a result of changing business conditions, technological advancements or worse-than-expected performance of the segment; |
• | the risk of litigation or claims associated with a proposed or completed transaction; |
• | unknown, underestimated or undisclosed commitments or liabilities; and |
• | the inappropriate scale of acquired entities' critical resources or facilities for business needs. |
Applied also makes strategic investments in other companies, including companies formed as joint ventures, which may decline in value or not meet desired objectives. The success of these investments depends on various factors over which Applied may have limited or no control and, particularly with respect to joint ventures, requires ongoing and effective cooperation with strategic partners. The risks to Applied's strategic investment portfolio may be exacerbated by unfavorable financial market and macroeconomic conditions and, as a result, the value of the investment portfolio could be negatively impacted and lead to impairment charges.
Applied's indebtedness and debt covenants could adversely affect its financial condition and business.
Applied has $3.4 billion in aggregate principal amount of senior unsecured notes outstanding. Under the indenture governing the senior unsecured notes, it may be required to offer to repurchase the notes at a price equal to 101% of the principal amount, plus accrued and unpaid interest, upon a change of control of Applied and a contemporaneous downgrade of the notes below investment grade. Applied also has in place a $1.5 billion committed revolving credit agreement. While no amounts were outstanding under this credit agreement at October 30, 2016 , Applied may borrow amounts in the future under the agreement. Applied may also enter into new financing arrangements. Applied's ability to satisfy its debt obligations is dependent upon the results of its business operations and subject to other risks discussed in this section. Significant changes in Applied's credit rating or changes in the interest rate environment could have a material adverse consequence on Applied's access to and cost of capital for future financings, and financial condition. If Applied fails to satisfy its debt obligations, or comply with financial and other debt covenants, it may be in default and any borrowings may become immediately due and payable, and such default may also constitute a default under other of Applied's obligations. There can be no assurance that Applied would have sufficient financial resources or be able to arrange financing to repay any borrowings at such time.
Applied is exposed to risks associated with expanding into new and related markets and industries.
As part of its growth strategy, Applied must successfully expand into related or new markets and industries, either with its existing products or with new products developed internally, or those developed in collaboration with third parties, or obtained through acquisitions. Applied's ability to successfully expand its business into new and related markets and industries may be adversely affected by a number of factors, including:
• | the need to devote additional resources to develop new products for, and operate in, new markets; |
• | the need to develop new sales and technical marketing strategies, cultivate relationships with new customers and meet different customer service requirements; |
19
Table of Contents
• | differing rates of profitability and growth among multiple businesses; |
• | Applied's ability to anticipate demand, capitalize on opportunities, and avoid or minimize risks; |
• | the complexity of managing multiple businesses with variations in production planning, execution, supply chain management and logistics; |
• | the adoption of new business models, business processes and systems; |
• | the complexity of entering into and effectively managing strategic alliances or partnering opportunities; |
• | new materials, processes and technologies; |
• | the need to attract, motivate and retain employees with skills and expertise in these new areas; |
• | new and more diverse customers and suppliers, including some with limited operating histories, uncertain or limited funding, evolving business models or locations in regions where Applied does not have, or has limited, operations; |
• | new or different competitors with potentially more financial or other resources, industry experience and established customer relationships; |
• | entry into new industries and countries, with differing levels of government involvement, laws and regulations, and business, employment and safety practices; |
• | third parties' intellectual property rights; and |
• | the need to comply with, or work to establish, industry standards and practices. |
In addition, Applied from time to time receives funding from United States and other government agencies for certain strategic development programs to increase its research and development resources and address new market opportunities. As a condition to this government funding, Applied may be subject to certain record-keeping, audit, intellectual property rights-sharing and/or other obligations.
Manufacturing interruptions or delays could affect Applied's ability to meet customer demand and lead to higher costs, while the failure to estimate customer demand accurately could result in excess or obsolete inventory.
Applied's business depends on its timely supply of equipment, services and related products that meet the rapidly changing technical and volume requirements of its customers, which depends in part on the timely delivery of parts, including components and subassemblies, from suppliers, including contract manufacturers. Some key parts are subject to long lead-times or obtainable only from a single supplier or limited group of suppliers, and some sourcing or subassembly is provided by suppliers located in countries other than the countries where Applied conducts its manufacturing, including China and Korea. Variable industry conditions and the volatility of demand for manufacturing equipment increase capital, technical, operational and other risks for Applied and for companies throughout its supply chain. These conditions may cause some suppliers to scale back operations, exit businesses, merge with other companies, or file for bankruptcy protection and possibly cease operations. Applied may also experience significant interruptions of its manufacturing operations, delays in its ability to deliver products or services, increased costs or customer order cancellations as a result of:
• | the failure or inability of suppliers to timely deliver sufficient quantities of quality parts on a cost-effective basis; |
• | volatility in the availability and cost of materials, including rare earth elements; |
• | difficulties or delays in obtaining required import or export approvals; |
• | shipment delays due to transportation interruptions or capacity constraints; |
• | information technology or infrastructure failures; and |
• | natural disasters or other events beyond Applied's control (such as earthquakes, floods or storms, regional economic downturns, pandemics, social unrest, political instability, terrorism, or acts of war), particularly where it conducts manufacturing. |
If a supplier fails to meet Applied's requirements concerning quality, cost, protection of intellectual property, socially-responsible business practices, or other performance factors, Applied may transfer its business to alternative sources, which could entail manufacturing delays, additional costs, or other difficulties. If Applied is unable to meet its customers' demand for a prolonged period due to its inability to obtain certain parts or components, it could affect its ability to manage its operations, and have an adverse impact on Applied's business, results of operations and customer relationships. In addition, if Applied needs to rapidly increase its business and manufacturing capacity to meet increases in demand or expedited shipment schedules, this may exacerbate any interruptions in Applied's manufacturing operations and supply chain and the associated effect on Applied's working capital. Moreover, if actual demand for Applied's products is different than expected, Applied may purchase more/fewer parts than necessary or incur costs for canceling, postponing or expediting delivery of parts. If Applied purchases inventory in anticipation of customer demand that does not materialize, or if customers reduce or delay orders, Applied may incur excess inventory charges.
20
Table of Contents
The ability to attract, retain and motivate key employees is vital to Applied's success.
Applied's success, competitiveness and ability to execute on its global strategies and maintain a culture of innovation depend in large part on its ability to attract, retain and motivate key employees. Achieving this objective may be difficult due to many factors, including fluctuations in global economic and industry conditions, management changes, Applied's organizational structure, global competition for talent and the availability of qualified employees, cost reduction activities (including workforce reductions and unpaid shutdowns), availability of career development opportunities, the ability to obtain necessary authorizations for workers to provide services outside their home countries, and the effectiveness of Applied's compensation and benefit programs, including its share-based programs. Restructuring programs present particular challenges to the extent they involve the departure of knowledgeable and experienced employees and the resulting need to identify and train existing or new workers to perform necessary functions, which may result in unexpected costs, reduced productivity, and/or difficulties with respect to internal processes and controls.
Applied is exposed to various risks related to protection and enforcement of intellectual property rights.
Applied's success depends in significant part on the protection of its patents, trade secrets, copyrights and other intellectual property rights. Infringement of Applied's rights by a third party, such as the unauthorized manufacture or sale of equipment or spare parts, could result in uncompensated lost market and revenue opportunities for Applied. Policing any unauthorized use of intellectual property is difficult and costly and Applied cannot be certain that the measures it has implemented will prevent misuse. Applied's ability to enforce its intellectual property rights is subject to litigation risks, as well as uncertainty as to the protection and enforceability of those rights in some countries. If Applied seeks to enforce its intellectual property rights, it may be subject to claims that those rights are invalid or unenforceable, and others may seek counterclaims against Applied, which could have a negative impact on its business. If Applied is unable to enforce and protect intellectual property rights, or if they are circumvented, invalidated, rendered obsolete by the rapid pace of technological change, it could have an adverse impact on its competitive position and business. In addition, changes in intellectual property laws or their interpretation, such as recent changes in U.S. patent laws, may impact Applied's ability to protect and assert its intellectual property rights, increase costs and uncertainties in the prosecution of patent applications and enforcement or defense of issued patents, and diminish the value of Applied's intellectual property.
Third parties may also assert claims against Applied and its products. Claims that Applied's products infringe the rights of others, whether or not meritorious, can be expensive and time-consuming to defend and resolve, and may divert the efforts and attention of management and personnel. The inability to obtain rights to use third party intellectual property on commercially reasonable terms could have an adverse impact on Applied's business. In addition, Applied may face claims based on the theft or unauthorized use or disclosure of third-party trade secrets and other confidential business information. Any such incidents and claims could severely harm Applied's business and reputation, result in significant expenses, harm its competitive position, and prevent Applied from selling certain products, all of which could have a significant adverse impact on Applied's business and results of operations.
Applied is exposed to risks related to cybersecurity threats and incidents.
In the conduct of its business, Applied collects, uses, transmits and stores data on information technology systems. This data includes confidential information belonging to Applied or its customers or other business partners, as well as personally-identifiable information of individuals. Applied has experienced, and expects to continue to be subject to, cybersecurity threats and incidents, ranging from employee error or misuse to individual attempts to gain unauthorized access to information systems to sophisticated and targeted measures known as advanced persistent threats, none of which have been material to the Company to date. Applied devotes significant resources to network security, data encryption and other measures to protect its systems and data from unauthorized access or misuse. However, depending on their nature and scope, cybersecurity incidents could result in business disruption; the misappropriation, corruption or loss of confidential information and critical data (Applied's and that of third parties); reputational damage; litigation with third parties; diminution in the value of Applied's investment in research, development and engineering; data privacy issues; and increased cybersecurity protection and remediation costs.
Applied is exposed to various risks related to legal proceedings.
Applied from time to time is, and in the future may be, involved in legal proceedings or claims regarding patent infringement, intellectual property rights, antitrust, environmental regulations, securities, contracts, product performance, product liability, unfair competition, misappropriation of trade secrets, employment, workplace safety, and other matters. Applied also on occasion receives notification from customers who believe that Applied owes them indemnification or other obligations related to claims made against such customers by third parties.
Legal proceedings and claims, whether with or without merit, and associated internal investigations, may be time-consuming and expensive to prosecute, defend or conduct; divert management's attention and other Applied resources; inhibit Applied's ability to sell its products; result in adverse judgments for damages, injunctive relief, penalties and fines; and negatively affect Applied's business. There can be no assurance regarding the outcome of current or future legal proceedings, claims or investigations.
21
Table of Contents
The failure to successfully implement and conduct outsourcing activities and other operational initiatives could adversely affect results of operations.
To better align its costs with market conditions, locate closer to customers, enhance productivity, and improve efficiencies, Applied conducts certain engineering, software development, manufacturing, sourcing and other operations in regions outside the United States, including India, Taiwan, China, and Korea. Applied has implemented a distributed manufacturing model, under which certain manufacturing and supply chain activities are conducted in various countries, including Germany, Israel, Italy, Singapore, Taiwan, the United States and other countries in Asia, and assembly of some systems is completed at customer sites. In addition, Applied outsources certain functions to third parties, including companies in the United States, India, China, Korea, Malaysia and other countries. Outsourced functions include contract manufacturing, engineering, customer support, software development, information technology support, finance and administrative activities. The expanding role of third party providers has required changes to Applied's existing operations and the adoption of new procedures and processes for retaining and managing these providers, as well as redistributing responsibilities as warranted, in order to realize the potential productivity and operational efficiencies, assure quality and continuity of supply, and protect the intellectual property of Applied and its customers, suppliers and other partners. If Applied does not accurately forecast the amount, timing and mix of demand for products, or if contract manufacturers or other outsource providers fail to perform in a timely manner or at satisfactory quality levels, Applied's ability to meet customer requirements could suffer, particularly during a market upturn.
In addition, Applied must regularly implement or update comprehensive programs and processes to better align its global organizations, including initiatives to enhance its supply chain and improve back office and information technology infrastructure for more efficient transaction processing. The implementation of new processes and information systems and additional functionality to the existing systems entails certain risks, including difficulties with changes in business processes that could disrupt Applied's operations, such as its ability to track orders and timely ship products, project inventory requirements, manage its supply chain and aggregate financial and operational data. During transitions Applied must continue to rely on legacy information systems, which may be costly or inefficient, while the implementation of new initiatives may not achieve the anticipated benefits and may divert management's attention from other operational activities, or have other unintended consequences.
If Applied does not effectively develop and implement its outsourcing and relocation strategies, if required export and other governmental approvals are not timely obtained, if Applied's third party providers do not perform as anticipated, if there are delays or difficulties in enhancing business processes or if there are delays or difficulties in implementing or enhancing information systems, Applied may not realize anticipated productivity improvements or cost efficiencies, and may experience operational difficulties, increased costs (including energy and transportation), manufacturing interruptions or delays, inefficiencies in the structure and/or operation of its supply chain, loss of its intellectual property rights, quality issues, reputational harm, increased product time-to-market, and/or inefficient allocation of human resources, all of which could adversely affect Applied's business, financial condition and results of operations.
Applied may incur impairment charges to goodwill or long-lived assets.
Applied has a significant amount of goodwill and other acquired intangible assets related to acquisitions. Goodwill and purchased intangible assets with indefinite useful lives are not amortized, but are reviewed for impairment annually during the fourth quarter of each fiscal year, and more frequently when events or changes in circumstances indicate that the carrying value of an asset may not be recoverable. The review compares the fair value for each of Applied's reporting units to its associated carrying value, including goodwill. Factors that could lead to impairment of goodwill and intangible assets include adverse industry or economic trends, reduced estimates of future cash flows, declines in the market price of Applied common stock, changes in Applied's strategies or product portfolio, and restructuring activities. Applied's valuation methodology for assessing impairment requires management to make judgments and assumptions based on historical experience and projections of future operating performance. Applied may be required to record future charges to earnings during the period in which an impairment of goodwill or intangible assets is determined to exist.
Applied is exposed to risks associated with operating in jurisdictions with complex and changing tax laws.
Applied is subject to income taxes in the United States and foreign jurisdictions. Significant judgment is required to determine and estimate worldwide tax liabilities. Applied's provision for income taxes and effective tax rates could be affected by numerous factors, including changes in: (1) applicable tax laws; (2) amount and composition of pre-tax income in jurisdictions with differing tax rates; (3) plans to indefinitely reinvest certain funds held outside of the U.S.; and (4) valuation of deferred tax assets and liabilities. An increase in Applied's provision for income taxes and effective tax rate could have a material adverse impact on Applied's results of operations and financial condition. As of October 30, 2016 , Applied intends to indefinitely reinvest approximately $3.3 billion of cash, cash equivalents and marketable securities held by foreign subsidiaries and does not plan to repatriate these funds. Applied would need to accrue and pay U.S. taxes if these funds were repatriated.
22
Table of Contents
Consistent with the international nature of its business, Applied conducts certain manufacturing, supply chain, and other operations in Asia, bringing these activities closer to customers and reducing operating costs. In certain foreign jurisdictions, conditional reduced income tax rates have been granted to Applied. To obtain the benefit of these tax incentives, Applied must meet requirements relating to various activities. Applied's ability to realize benefits from these incentives could be materially affected if, among other things, applicable requirements are not met or Applied incurs net losses in these jurisdictions.
In addition, Applied is subject to examination by the Internal Revenue Service and other tax authorities, and from time to time amends previously filed tax returns. Applied regularly assesses the likelihood of favorable or unfavorable outcomes resulting from these examinations and amendments to determine the adequacy of its provision for income taxes, which requires estimates and judgments. Although Applied believes its tax estimates are reasonable, there can be no assurance that the tax authorities will agree with such estimates. Applied may have to engage in litigation to achieve the results reflected in the estimates, which may be time-consuming and expensive. There can be no assurance that Applied will be successful or that any final determination will not be materially different from the treatment reflected in Applied's historical income tax provisions and effective tax rates.
Applied is subject to risks associated with environmental and safety regulations.
Applied is subject to environmental and safety regulations in connection with its global business operations, including but not limited to: regulations related to the development, manufacture and use of its products; handling, discharge, recycling and disposal of hazardous materials used in its products or in producing its products; the operation of its facilities; and the use of its real property. The failure or inability to comply with existing or future environmental and safety regulations could result in: significant remediation or other legal liabilities; the imposition of penalties and fines; restrictions on the development, manufacture, sale or use of certain of its products; limitations on the operation of its facilities or ability to use its real property; and a decrease in the value of its real property. Applied could be required to alter its manufacturing and operations and incur substantial expense in order to comply with environmental and safety regulations. Any failure to comply with environmental and safety regulations could subject Applied to significant costs and liabilities that could adversely affect Applied's business, financial condition and results of operations.
Applied is exposed to various risks related to the global regulatory environment.
As a public company with global operations, Applied is subject to the laws of the United States and multiple foreign jurisdictions and the rules and regulations of various governing bodies, which may differ among jurisdictions, including those related to financial and other disclosures, corporate governance, intellectual property, tax, trade, anti-competition, employment, immigration, privacy, and anti-corruption. Changing, inconsistent or conflicting laws, rules and regulations, and ambiguities in their interpretation and application, create uncertainty and challenges, and compliance with laws, rules and regulations may be onerous and expensive, divert management time and attention from revenue-generating activities, and otherwise adversely impact Applied's business operations. Violations of law, rules and regulations could result in fines, criminal sanctions, restrictions on Applied's business, and damage to its reputation, and could have an adverse impact on its business operations, financial condition and results of operations.
Item 1B: | Unresolved Staff Comments |
None.
23
Table of Contents
Item 2: | Properties |
Information concerning Applied's properties at October 30, 2016 is set forth below:
(Square feet in thousands) | United States |
| Other Countries |
| Total |
Owned | 3,745 |
| 1,629 |
| 5,374 |
Leased | 564 |
| 1,103 |
| 1,667 |
Total | 4,309 |
| 2,732 |
| 7,041 |
Because of the interrelation of Applied's operations, properties within a country may be shared by the segments operating within that country. The Company's headquarters offices are in Santa Clara, California. Products in Semiconductor Systems are manufactured in Austin, Texas; Gloucester, Massachusetts; Kalispell, Montana; Rehovot, Israel; and Singapore. Remanufactured equipment products in the Applied Global Services segment are produced primarily in Austin, Texas. Products in the Display and Adjacent Markets segment are manufactured in Alzenau, Germany; Tainan, Taiwan; and Santa Clara, California. Other products are manufactured in Treviso, Italy.
Applied also owns and leases offices, plants and warehouse locations in many locations throughout the world, including in Europe, Japan, North America (principally the United States), Israel, China, India, Korea, Southeast Asia and Taiwan. These facilities are principally used for manufacturing; research, development and engineering; and marketing, sales and customer support.
Applied also owns a total of approximately 280 acres of buildable land in Montana, Texas, California, Massachusetts, Israel and Italy that could accommodate additional building space.
Applied considers the properties that it owns or leases as adequate to meet its current and future requirements. Applied regularly assesses the size, capability and location of its global infrastructure and periodically makes adjustments based on these assessments.
24
Table of Contents
Item 3: | Legal Proceedings |
The information set forth under "Legal Matters" in Note 13 of Notes to Consolidated Financial Statements is incorporated herein by reference.
Item 4: | Mine Safety Disclosures |
None.
PART II
Item 5: | Market for Registrant's Common Equity, Related Stockholder Matters and Issuer Purchases of Equity Securities |
Market Information
The following table sets forth the high and low closing sale prices for the periods presented as reported on the NASDAQ Global Select Market.
| Price Range | ||||||
| High |
| Low | ||||
Fiscal 2016 |
|
|
| ||||
First quarter | $ | 19.26 | |
| $ | 16.08 | |
Second quarter | $ | 21.56 | |
| $ | 15.64 | |
Third quarter | $ | 26.90 | |
| $ | 19.61 | |
Fourth quarter | $ | 30.57 | |
| $ | 25.97 | |
Fiscal 2015 |
|
|
| ||||
First quarter | $ | 25.40 | |
| $ | 21.04 | |
Second quarter | $ | 25.63 | |
| $ | 21.49 | |
Third quarter | $ | 20.38 | |
| $ | 17.37 | |
Fourth quarter | $ | 17.62 | |
| $ | 14.37 | |
Applied's common stock is traded on the NASDAQ Global Select Market under the symbol AMAT. As of December 8, 2016 , there were 3,062 registered holders of Applied common stock.
25
Table of Contents
Performance Graph
The performance graph below shows the five-year cumulative total stockholder return on Applied common stock during the period from October 30, 2011 through October 30, 2016. This is compared with the cumulative total return of the Standard & Poor's 500 Stock Index and the RDG Semiconductor Composite Index over the same period. The comparison assumes $100 was invested on October 30, 2011 in Applied common stock and in each of the foregoing indices and assumes reinvestment of dividends, if any. Dollar amounts in the graph are rounded to the nearest whole dollar. The performance shown in the graph represents past performance and should not be considered an indication of future performance.
COMPARISON OF 5 YEAR CUMULATIVE TOTAL RETURN*
Among Applied Materials, Inc., the S&P 500 Index
and the RDG Semiconductor Composite Index
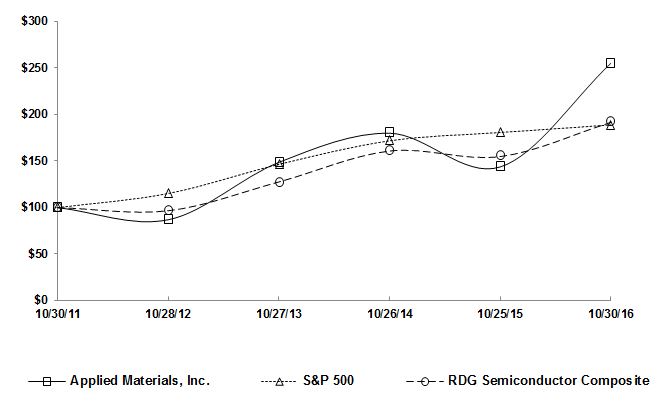
*Assumes $100 invested on 10/30/11 in stock or 10/31/11 in index, including reinvestment of dividends.
Indexes calculated on month-end basis.
Copyright© 2016 Standard & Poor's, a division of S&P global. All rights reserved.
| 10/30/2011 |
| 10/28/2012 |
| 10/27/2013 |
| 10/26/2014 |
| 10/25/2015 |
| 10/30/2016 | ||||||
Applied Materials | 100.00 | |
| 86.93 | |
| 148.68 | |
| 179.96 | |
| 143.74 | |
| 255.27 | |
S&P 500 Index | 100.00 | |
| 115.21 | |
| 146.52 | |
| 171.82 | |
| 180.75 | |
| 188.90 | |
RDG Semiconductor Composite Index | 100.00 | |
| 96.65 | |
| 127.68 | |
| 160.86 | |
| 154.90 | |
| 191.65 | |
Dividends
During each of fiscal 2016, 2015, and 2014, Applied's Board of Directors declared four quarterly cash dividends in the amount of $0.10 per share. Applied currently anticipates that cash dividends will continue to be paid on a quarterly basis, although the declaration of any future cash dividend is at the discretion of the Board of Directors and will depend on Applied's financial condition, results of operations, capital requirements, business conditions and other factors, as well as a determination by the Board of Directors that cash dividends are in the best interests of Applied's stockholders.
26
Table of Contents
Issuer Purchases of Equity Securities
The following table provides information as of October 30, 2016 with respect to the shares of common stock repurchased by Applied during the fourth quarter of fiscal 2016 pursuant to the publicly-announced stock repurchase program approved by the Board of Directors on June 9, 2016, which authorized up to $2.0 billion in repurchases.
Period | Total Number of Shares Purchased |
| Average Price Paid per Share |
| Aggregate Price Paid |
| Total Number of Shares Purchased as Part of Publicly Announced Program |
| Maximum Dollar Value of Shares That May Yet be Purchased Under the Program | ||||||||
|
|
|
|
|
|
|
|
|
| ||||||||
| (In millions, except per share amounts) | ||||||||||||||||
Month #1 |
|
|
|
|
|
|
|
|
| ||||||||
(August 1, 2016 to August 28, 2016) | 0.1 | |
| $ | 25.86 | |
| $ | 1 | |
| 0.1 | |
| $ | 1,952 | |
Month #2 |
|
|
|
|
|
|
|
|
| ||||||||
(August 29, 2016 to September 25, 2016) | 1.2 | |
| $ | 29.86 | |
| 36 | |
| 1.2 | |
| $ | 1,916 | | |
Month #3 |
|
|
|
|
|
|
|
|
| ||||||||
(September 26, 2016 to October 30, 2016) | 4.7 | |
| $ | 28.75 | |
| 134 | |
| 4.7 | |
| $ | 1,782 | | |
Total | 6.0 | |
| $ | 28.95 | |
| $ | 171 | |
| 6.0 | |
|
| ||
Item 6: | Selected Financial Data |
The following selected financial information has been derived from Applied's historical audited consolidated financial statements and should be read in conjunction with the consolidated financial statements and the accompanying notes for the corresponding fiscal years:
Fiscal Year (1) | 2016 |
| 2015 |
| 2014 |
| 2013 |
| 2012 | ||||||||||
|
|
|
|
|
|
|
|
|
| ||||||||||
| (In millions, except percentages and per share amounts) | ||||||||||||||||||
New orders | $ | 12,416 | |
| $ | 10,104 | |
| $ | 9,648 | |
| $ | 8,466 | |
| $ | 8,037 | |
Net sales | $ | 10,825 | |
| $ | 9,659 | |
| $ | 9,072 | |
| $ | 7,509 | |
| $ | 8,719 | |
Gross profit | $ | 4,511 | |
| $ | 3,952 | |
| $ | 3,843 | |
| $ | 2,991 | |
| $ | 3,313 | |
Gross margin | 41.7 | % |
| 40.9 | % |
| 42.4 | % |
| 39.8 | % |
| 38.0 | % | |||||
Research, development and engineering | $ | 1,540 | |
| $ | 1,451 | |
| $ | 1,428 | |
| $ | 1,320 | |
| $ | 1,237 | |
Operating income | $ | 2,152 | |
| $ | 1,693 | |
| $ | 1,520 | |
| $ | 432 | |
| $ | 411 | |
Operating margin | 19.9 | % |
| 17.5 | % |
| 16.8 | % |
| 5.8 | % |
| 4.7 | % | |||||
Income before income taxes | $ | 2,013 | |
| $ | 1,598 | |
| $ | 1,448 | |
| $ | 350 | |
| $ | 316 | |
Net income | $ | 1,721 | |
| $ | 1,377 | |
| $ | 1,072 | |
| $ | 256 | |
| $ | 109 | |
Earnings per diluted share | $ | 1.54 | |
| $ | 1.12 | |
| $ | 0.87 | |
| $ | 0.21 | |
| $ | 0.09 | |
Long-term debt | $ | 3,143 | |
| $ | 3,342 | |
| $ | 1,947 | |
| $ | 1,946 | |
| $ | 1,946 | |
Cash dividends declared per common share | $ | 0.40 | |
| $ | 0.40 | |
| $ | 0.40 | |
| $ | 0.39 | |
| $ | 0.35 | |
Total assets | $ | 14,588 | |
| $ | 15,308 | |
| $ | 13,174 | |
| $ | 12,043 | |
| $ | 12,102 | |
(1) | Each fiscal year ended on the last Sunday in October. Fiscal 2016 contained 53 weeks and fiscal 2015, 2014, 2013, and 2012 each contained 52 weeks. |
27
Table of Contents
Item 7: | Management's Discussion and Analysis of Financial Condition and Results of Operations |
Introduction
Management's Discussion and Analysis of Financial Condition and Results of Operations (MD&A) is intended to facilitate an understanding of Applied's business and results of operations. This MD&A should be read in conjunction with Applied's Consolidated Financial Statements and the accompanying Notes to Consolidated Financial Statements included elsewhere in this Form 10-K. The following discussion contains forward-looking statements and should also be read in conjunction with the cautionary statement set forth at the beginning of this Form 10-K. MD&A consists of the following sections:
• | Overview: a summary of Applied's business and measurements |
• | Results of Operations: a discussion of operating results |
• | Segment Information: a discussion of segment operating results |
• | Recent Accounting Pronouncements: a discussion of new accounting pronouncements and its impact to Applied's consolidated financial statements |
• | Financial Condition, Liquidity and Capital Resources: an analysis of cash flows, sources and uses of cash |
• | Off-Balance Sheet Arrangements and Contractual Obligations |
• | Critical Accounting Policies and Estimates: a discussion of critical accounting policies that require the exercise of judgments and estimates |
• | Non-GAAP Adjusted Results: a presentation of results reconciling GAAP to non-GAAP adjusted measures |
Overview
Applied provides manufacturing equipment, services and software to the global semiconductor, display, and related industries. Applied's customers include manufacturers of semiconductor wafers and chips, liquid crystal and other displays, and other electronic devices. These customers may use what they manufacture in their own end products or sell the items to other companies for use in advanced electronic components. Applied operates in three reportable segments: Semiconductor Systems (previously Silicon Systems), Applied Global Services, and Display and Adjacent Markets (previously Display). A summary of financial information for each reportable segment is found in Note 14 of Notes to Consolidated Financial Statements. A discussion of factors that could affect Applied's operations is set forth under "Risk Factors" in Part I, Item 1A, which is incorporated herein by reference. Product development and manufacturing activities occur primarily in the United States, Europe, Israel, and Asia. Applied's broad range of equipment and service products are highly technical and are sold primarily through a direct sales force.
Applied's results are driven primarily by worldwide demand for semiconductors and displays, which in turn depends on end-user demand for electronic products. Each of Applied's businesses is subject to variable industry conditions, as demand for manufacturing equipment and services can change depending on supply and demand for chips, display technologies, and other electronic devices, as well as other factors, such as global economic and market conditions, and the nature and timing of technological advances in fabrication processes. In addition, a significant driver in the semiconductor and display industries is end-demand for mobile consumer products, which is characterized by seasonality that impacts the timing of customer investments in manufacturing equipment and, in turn, Applied's business. In light of these conditions, Applied's results can vary significantly year-over-year, as well as quarter-over-quarter.
28
Table of Contents
The following table presents certain significant measurements for the past three fiscal years:
|
|
|
|
|
|
| Change | ||||||||||||
| 2016 |
| 2015 |
| 2014 |
| 2016 over 2015 |
| 2015 over 2014 | ||||||||||
|
|
|
|
|
|
|
|
|
| ||||||||||
| (In millions, except per share amounts and percentages) | ||||||||||||||||||
New orders | $ | 12,416 | |
| $ | 10,104 | |
| $ | 9,648 | |
| $ | 2,312 | |
| $ | 456 | |
Net sales | $ | 10,825 | |
| $ | 9,659 | |
| $ | 9,072 | |
| $ | 1,166 | |
| $ | 587 | |
Gross profit | $ | 4,511 | |
| $ | 3,952 | |
| $ | 3,843 | |
| $ | 559 | |
| $ | 109 | |
Gross margin | 41.7 | % |
| 40.9 | % |
| 42.4 | % |
| 0.8 points |
| (1.5) points | |||||||
Operating income | $ | 2,152 | |
| $ | 1,693 | |
| $ | 1,520 | |
| $ | 459 | |
| $ | 173 | |
Operating margin | 19.9 | % |
| 17.5 | % |
| 16.8 | % |
| 2.4 points |
| 0.7 points | |||||||
Net income | $ | 1,721 | |
| $ | 1,377 | |
| $ | 1,072 | |
| $ | 344 | |
| $ | 305 | |
Earnings per diluted share | $ | 1.54 | |
| $ | 1.12 | |
| $ | 0.87 | |
| $ | 0.42 | |
| $ | 0.25 | |
Non-GAAP Adjusted Results |
|
|
|
|
|
|
|
|
| ||||||||||
Non-GAAP adjusted gross profit | $ | 4,676 | |
| $ | 4,147 | |
| $ | 4,002 | |
| $ | 529 | |
| $ | 145 | |
Non-GAAP adjusted gross margin | 43.2 | % |
| 42.9 | % |
| 44.1 | % |
| 0.3 points |
| (1.2) points | |||||||
Non-GAAP adjusted operating income | $ | 2,347 | |
| $ | 1,896 | |
| $ | 1,781 | |
| $ | 451 | |
| $ | 115 | |
Non-GAAP adjusted operating margin | 21.7 | % |
| 19.6 | % |
| 19.6 | % |
| 2.1 points |
| - | |||||||
Non-GAAP adjusted net income | $ | 1,950 | |
| $ | 1,457 | |
| $ | 1,314 | |
| $ | 493 | |
| $ | 143 | |
Non-GAAP adjusted earnings per diluted share | $ | 1.75 | |
| $ | 1.19 | |
| $ | 1.07 | |
| $ | 0.56 | |
| $ | 0.12 | |
Reconciliations of non-GAAP adjusted measures are presented below under "Non-GAAP Adjusted Results." Fiscal 2016 contained 53 weeks and fiscal 2015 and 2014 each contained 52 weeks.
Applied's strategic priorities include developing products that help solve customers' challenges at technology inflections; expanding its served market opportunities in the semiconductor and display industries; and growing its services business.
Mobility, and the increasing technological functionality of mobile devices, continues to be a strong driver of semiconductor industry spending. During fiscal 2016, memory manufacturers invested in technology upgrades and additional capacity, both of which were driven primarily by the transition from planar NAND to 3D NAND. Foundry customers also invested in technology upgrades and new capacity to meet demand for advanced mobile chips. Mobility investments, including increasing investments in new technology such as OLED for mobile devices, represents a significant driver of display industry spending, which has resulted in higher manufacturing capacity expansion for mobile applications. As a result, new orders for display equipment increased in fiscal 2016 compared to the prior year. Demand for larger LCD TVs is also a factor for display industry investments, although demand for TV manufacturing equipment remains susceptible to cyclical conditions.
In fiscal 2017, Applied expects these trends to continue to drive demand for the semiconductor industry, and in turn for the Semiconductor Systems segment. Applied also expects healthy spending in semiconductor spares and services, and increased spending for display manufacturing equipment in fiscal 2017.
Effective in the third quarter of fiscal 2016, Applied began to account for its flexible coating systems (previously in Energy and Environmental Solutions) and display upgrade equipment (previously in Applied Global Services) under the Display and Adjacent Markets segment. As a result of the change, Applied's solar business (previously in Energy and Environmental Solutions) is included in Corporate and Other as it did not meet the threshold for a separate reportable segment. Results for prior periods have been recast to conform to the current presentation.
29
Table of Contents
Results of Operations
New Orders
New orders for the periods indicated were as follows:
|
|
|
|
|
|
|
|
|
|
|
|
| Change | ||||||||
| 2016 |
| 2015 |
| 2014 |
| 2016 over 2015 |
| 2015 over 2014 | ||||||||||||
|
|
|
|
|
|
|
|
|
|
|
|
|
|
|
| ||||||
| (In millions, except percentages) | ||||||||||||||||||||
Semiconductor Systems | $ | 7,289 | |
| 59% |
| $ | 6,581 | |
| 65% |
| $ | 6,132 | |
| 64% |
| 11% |
| 7% |
Applied Global Services | 2,775 | |
| 22% |
| 2,582 | |
| 26% |
| 2,345 | |
| 24% |
| 7% |
| 10% | |||
Display and Adjacent Markets | 2,160 | |
| 17% |
| 828 | |
| 8% |
| 1,066 | |
| 11% |
| 161% |
| (22)% | |||
Corporate and Other | 192 | |
| 2% |
| 113 | |
| 1% |
| 105 | |
| 1% |
| 70% |
| 8% | |||
Total | $ | 12,416 | |
| 100% |
| $ | 10,104 | |
| 100% |
| $ | 9,648 | |
| 100% |
| 23% |
| 5% |
New orders for fiscal 2016 increased across all segments compared to the prior year, primarily due to higher demand for display and semiconductor equipment. New orders for the Semiconductor Systems segment continued to comprise the majority of Applied's consolidated total new orders.
New orders for fiscal 2015 slightly increased from fiscal 2014 due to higher demand for semiconductor equipment, and semiconductor spares and services, partially offset by lower demand for display equipment.
New orders by geographic region for each fiscal year, determined by the product shipment destination specified by the customer, were as follows:
|
|
|
|
|
|
|
|
|
|
|
|
| Change | ||||||||
| 2016 |
| 2015 |
| 2014 |
| 2016 over 2015 |
| 2015 over 2014 | ||||||||||||
|
|
|
|
|
|
|
|
|
|
|
|
|
|
|
| ||||||
| (In millions, except percentages) | ||||||||||||||||||||
Taiwan | $ | 3,389 | |
| 27% |
| $ | 2,808 | |
| 28% |
| $ | 2,740 | |
| 28% |
| 21% |
| 2% |
China | 2,905 | |
| 23% |
| 1,472 | |
| 14% |
| 1,517 | |
| 16% |
| 97% |
| (3)% | |||
Korea | 2,286 | |
| 19% |
| 1,709 | |
| 17% |
| 1,086 | |
| 11% |
| 34% |
| 57% | |||
Japan | 980 | |
| 8% |
| 1,786 | |
| 18% |
| 1,031 | |
| 11% |
| (45)% |
| 73% | |||
Southeast Asia | 847 | |
| 7% |
| 430 | |
| 4% |
| 412 | |
| 4% |
| 97% |
| 4% | |||
Asia Pacific | 10,407 | |
| 84% |
| 8,205 | |
| 81% |
| 6,786 | |
| 70% |
| 27% |
| 21% | |||
United States | 1,235 | |
| 10% |
| 1,323 | |
| 13% |
| 2,200 | |
| 23% |
| (7)% |
| (40)% | |||
Europe | 774 | |
| 6% |
| 576 | |
| 6% |
| 662 | |
| 7% |
| 34% |
| (13)% | |||
Total | $ | 12,416 | |
| 100% |
| $ | 10,104 | |
| 100% |
| $ | 9,648 | |
| 100% |
| 23% |
| 5% |
The increase in new orders from customers in Taiwan, Europe and Southeast Asia in fiscal 2016 compared to fiscal 2015 was primarily due to higher demand for semiconductor equipment, and the increase in new orders in China in fiscal 2016 reflected increased demand for semiconductor and display equipment. The increase in new orders from customers in Korea in fiscal 2016 was primarily due to higher demand for display equipment. The decrease in new orders from customers in Japan in fiscal 2016 compared to the prior year was primarily attributed to lower orders from memory customers, partially offset by higher demand for display equipment.
The changes in new orders from customers in Korea, Japan, the United States and Europe in fiscal 2015 compared with fiscal 2014 primarily reflected changes in customer mix for semiconductor equipment.
30
Table of Contents
Changes in backlog during each fiscal year were as follows:
| 2016 |
| 2015 | ||||
|
|
|
| ||||
| (In millions) | ||||||
Beginning balance | $ | 3,142 | |
| $ | 2,917 | |
New orders | 12,416 | |
| 10,104 | | ||
Net sales | (10,825 | ) |
| (9,659 | ) | ||
Net adjustments | (155 | ) |
| (220 | ) | ||
Ending balance | $ | 4,578 | |
| $ | 3,142 | |
Backlog consists of: (1) orders for which written authorizations have been accepted and assigned shipment dates are within the next 12 months, or shipment has occurred but revenue has not been recognized; and (2) contractual service revenue and maintenance fees to be earned within the next 12 months. Applied's backlog at any particular time is not necessarily indicative of actual sales for any future periods due to the potential for customer changes in delivery schedules or cancellation of orders. Approximately 64 percent of backlog as of the end of fiscal 2016 is anticipated to be shipped within the next two quarters.
Applied's backlog was $4.6 billion at October 30, 2016 compared to $3.1 billion at October 25, 2015 . Backlog adjustments were negative for fiscal 2016 and totaled $155 million , primarily due to change in expected timing of shipments, order cancellations and other adjustments, partially offset by favorable foreign currency impact. Backlog adjustments were also negative for fiscal 2015 and totaled $220 million , primarily consisting of order cancellations, unfavorable foreign currency impacts and other adjustments.
| 2016 |
| 2015 |
| Change | ||||||||
|
|
|
|
|
|
|
|
|
| ||||
| (In millions, except percentages) | ||||||||||||
Semiconductor Systems | $ | 2,098 | |
| 45% |
| $ | 1,720 | |
| 55% |
| 22% |
Applied Global Services | 866 | |
| 19% |
| 779 | |
| 25% |
| 11% | ||
Display and Adjacent Markets | 1,539 | |
| 34% |
| 598 | |
| 19% |
| 157% | ||
Corporate and Other | 75 | |
| 2% |
| 45 | |
| 1% |
| 67% | ||
Total | $ | 4,578 | |
| 100% |
| $ | 3,142 | |
| 100% |
| 46% |
Total backlog in fiscal 2016 compared to fiscal 2015 increased primarily due to higher demand for display and semiconductor equipment. In the fourth quarter of fiscal 2016 approximately 37 percent of net sales in the Semiconductor Systems segment, Applied's largest business segment, were for orders received and shipped within the quarter, down from 55 percent in the fourth quarter of fiscal 2015.
Net Sales
Net sales for the periods indicated were as follows:
|
|
|
|
|
|
|
|
|
|
|
|
| Change | ||||||||
| 2016 |
| 2015 |
| 2014 |
| 2016 over 2015 |
| 2015 over 2014 | ||||||||||||
|
|
|
|
|
|
|
|
|
|
|
|
|
|
|
| ||||||
| (In millions, except percentages) | ||||||||||||||||||||
Semiconductor Systems | $ | 6,873 | |
| 64% |
| $ | 6,135 | |
| 64% |
| $ | 5,978 | |
| 66% |
| 12% |
| 3% |
Applied Global Services | 2,589 | |
| 24% |
| 2,447 | |
| 25% |
| 2,114 | |
| 24% |
| 6% |
| 16% | |||
Display and Adjacent Markets | 1,206 | |
| 11% |
| 944 | |
| 10% |
| 848 | |
| 9% |
| 28% |
| 11% | |||
Corporate and Other | 157 | |
| 1% |
| 133 | |
| 1% |
| 132 | |
| 1% |
| 18% |
| 1% | |||
Total | $ | 10,825 | |
| 100% |
| $ | 9,659 | |
| 100% |
| $ | 9,072 | |
| 100% |
| 12% |
| 6% |
Net sales in fiscal 2016 compared to fiscal 2015 increased primarily due to increased customer investments in semiconductor and display equipment. The Semiconductor Systems segment's relative share of total net sales remained flat compared to the prior year and remains the largest contributor of net sales.
31
Table of Contents
Net sales increased in fiscal 2015 compared to fiscal 2014 primarily due to greater customer investments in semiconductor spares and services, 200mm equipment systems and display and semiconductor equipment.
Net sales by geographic region, determined by the location of customers' facilities to which products were shipped, were as follows:
|
|
|
|
|
|
|
|
|
|
|
|
| Change | ||||||||
| 2016 |
| 2015 |
| 2014 |
| 2016 over 2015 |
| 2015 over 2014 | ||||||||||||
|
|
|
|
|
|
|
|
|
|
|
|
|
|
|
| ||||||
| (In millions, except percentages) | ||||||||||||||||||||
Taiwan | $ | 2,843 | |
| 26% |
| $ | 2,600 | |
| 27% |
| $ | 2,702 | |
| 30% |
| 9% |
| (4)% |
China | 2,259 | |
| 21% |
| 1,623 | |
| 17% |
| 1,608 | |
| 18% |
| 39% |
| 1% | |||
Korea | 1,883 | |
| 17% |
| 1,654 | |
| 17% |
| 965 | |
| 10% |
| 14% |
| 71% | |||
Japan | 1,279 | |
| 12% |
| 1,078 | |
| 11% |
| 817 | |
| 9% |
| 19% |
| 32% | |||
Southeast Asia | 803 | |
| 7% |
| 432 | |
| 4% |
| 356 | |
| 4% |
| 86% |
| 21% | |||
Asia Pacific | 9,067 | |
| 83% |
| 7,387 | |
| 76% |
| 6,448 | |
| 71% |
| 23% |
| 15% | |||
United States | 1,143 | |
| 11% |
| 1,630 | |
| 17% |
| 1,966 | |
| 22% |
| (30)% |
| (17)% | |||
Europe | 615 | |
| 6% |
| 642 | |
| 7% |
| 658 | |
| 7% |
| (4)% |
| (2)% | |||
Total | $ | 10,825 | |
| 100% |
| $ | 9,659 | |
| 100% |
| $ | 9,072 | |
| 100% |
| 12% |
| 6% |
The changes in net sales in all regions for fiscal 2016 compared to fiscal 2015 reflected increased spending on semiconductor equipment and changes in customer mix for semiconductor equipment. The changes in net sales in Korea, Japan and China also reflected changes in customer mix for display equipment.
The changes in net sales in Korea, Japan and Taiwan in fiscal 2015 compared to fiscal 2014 primarily reflected changes in customer mix for semiconductor equipment. The decrease in net sales in the United States was due to lower customer spending on semiconductor equipment, partially offset by increased spending on semiconductor spares and services, and 200mm equipment.
Gross Margin
Gross margins for the periods indicated were as follows:
|
|
|
|
|
|
| Change | ||||||||||||
| 2016 |
| 2015 |
| 2014 |
| 2016 over 2015 |
| 2015 over 2014 | ||||||||||
|
|
|
|
|
|
|
|
|
| ||||||||||
| (In millions, except percentages) | ||||||||||||||||||
Gross profit | $ | 4,511 | |
| $ | 3,952 | |
| $ | 3,843 | |
| $ | 559 | |
| $ | 109 | |
Gross margin | 41.7 | % |
| 40.9 | % |
| 42.4 | % |
| 0.8 points |
| (1.5) points | |||||||
Non-GAAP Adjusted Results |
|
|
|
|
|
|
|
|
| ||||||||||
Non-GAAP adjusted gross profit | $ | 4,676 | |
| $ | 4,147 | |
| $ | 4,002 | |
| $ | 529 | |
| $ | 145 | |
Non-GAAP adjusted gross margin | 43.2 | % |
| 42.9 | % |
| 44.1 | % |
| 0.3 points |
| (1.2) points | |||||||
Reconciliations of non-GAAP adjusted measures are presented below under "Non-GAAP Adjusted Results" below.
Gross profit, non-GAAP adjusted gross profit, gross margin and non-GAAP adjusted gross margin in fiscal 2016 increased compared to fiscal 2015 primarily due to higher net sales, partially offset by unfavorable changes in product mix.
Gross profit and non-GAAP adjusted gross profit in fiscal 2015 increased compared to fiscal 2014, primarily due to higher net sales, while gross margin and non-GAAP adjusted gross margin decreased primarily due to unfavorable changes in product mix and the absence of a recovery of a regional customs duty assessment charge recorded in fiscal 2014.
Gross profit and non-GAAP adjusted gross profit during fiscal 2016 , 2015 and 2014 included $62 million , $57 million and $53 million , respectively, of share-based compensation expense.
32
Table of Contents
Research, Development and Engineering
Research, Development and Engineering (RD&E) expenses for the periods indicated were as follows:
|
|
|
|
|
|
| Change | ||||||||||||
| 2016 |
| 2015 |
| 2014 |
| 2016 over 2015 |
| 2015 over 2014 | ||||||||||
|
|
|
|
|
|
|
|
|
| ||||||||||
| (In millions) | ||||||||||||||||||
Research, development and engineering | $ | 1,540 | |
| $ | 1,451 | |
| $ | 1,428 | |
| $ | 89 | |
| $ | 23 | |
Applied's future operating results depend to a considerable extent on its ability to maintain a competitive advantage in the equipment and service products it provides. Development cycles range from 12 to 36 months depending on whether the product is an enhancement of an existing product, which typically has a shorter development cycle, or a new product, which typically has a longer development cycle. Most of Applied's existing products resulted from internal development activities and innovations involving new technologies, materials and processes. In certain instances, Applied acquires technologies, either in existing or new product areas, to complement its existing technology capabilities and to reduce time to market.
Management believes that it is critical to continue to make substantial investments in RD&E to assure the availability of innovative technology that meets the current and projected requirements of its customers' most advanced designs. Applied has maintained and intends to continue its commitment to investing in RD&E in order to continue to offer new products and technologies.
In fiscal 2016, Applied increased its RD&E investments in new product growth across Semiconductor Systems and Display and Adjacent Markets, including etch, e-beam inspection, new materials engineering solutions to improve transistor performance and OLED displays. Applied's investments in etch were focused on supporting the adoption of the Producer® Selectra™ Etch system, an extreme selectivity etch tool for enabling continued scaling of 3D logic and memory chips. The investment in e-beam inspection was in support of the PROVision™ system, which helps achieve higher yields at advanced nodes by detecting the most challenging defects and monitoring process marginality. Applied also invested in materials engineering solutions to improve transistor performance by lowering the contact resistance between the transistor and interconnect wiring. In Display and Adjacent Markets, RD&E investments were focused on expanding the company's market opportunity with a new high-resolution inline e-beam review system and forthcoming solutions to improve OLED and flexible display manufacturing.
RD&E expenses increased in fiscal 2016 compared to the prior year and also in fiscal 2015 compared to fiscal 2014, reflecting the impact of ongoing investments in product development initiatives. As part of its growth strategy, Applied continued to reprioritize existing spend, to enable increased funding for investments in technical capabilities and critical RD&E programs in current and new markets, with a focus on semiconductor technologies. RD&E expense during fiscal 2016, 2015 and 2014 included $76 million , $69 million and $66 million , respectively, of share-based compensation expense.
Marketing and Selling
Marketing and selling expenses for the periods indicated were as follows:
|
|
|
|
|
|
| Change | ||||||||||||
| 2016 |
| 2015 |
| 2014 |
| 2016 over 2015 |
| 2015 over 2014 | ||||||||||
|
|
|
|
|
|
|
|
|
| ||||||||||
| (In millions) | ||||||||||||||||||
Marketing and selling | $ | 429 | |
| $ | 428 | |
| $ | 423 | |
| $ | 1 | |
| $ | 5 | |
Marketing and selling expenses remained relatively flat in fiscal 2016 compared to fiscal 2015 and fiscal 2014 due to continued cost management efforts. Marketing and selling expenses for fiscal years 2016, 2015, and 2014 included $26 million , $26 million and $23 million , respectively, of share-based compensation expense.
33
Table of Contents
General and Administrative
General and administrative expenses for the periods indicated were as follows:
|
|
|
|
|
|
| Change | ||||||||||||
| 2016 |
| 2015 |
| 2014 |
| 2016 over 2015 |
| 2015 over 2014 | ||||||||||
|
|
|
|
|
|
|
|
|
| ||||||||||
| (In millions) | ||||||||||||||||||
General and administrative | $ | 390 | |
| $ | 469 | |
| $ | 502 | |
| $ | (79 | ) |
| $ | (33 | ) |
General and administrative (G&A) expenses for fiscal 2016 decreased compared to the prior year. G&A expenses were higher in fiscal 2015 primarily due to acquisition-related and integration costs related to the terminated business combination with Tokyo Electron Limited (TEL), impact of foreign currency exchange loss as a result of functional currency correction, and restructuring charges, all recorded during fiscal 2015.
G&A expenses for fiscal 2015 decreased compared to fiscal 2014 primarily due to lower acquisition-related and integration costs related to the terminated business combination with TEL, which was terminated in April 2015, and continued cost management efforts. G&A expenses during fiscal 2016, 2015 and 2014 included $37 million , $35 million and $35 million , respectively, of share-based compensation expense.
Loss (Gain) on Derivatives Associated with Terminated Business Combination
|
|
|
|
|
|
| Change | ||||||||||||
| 2016 |
| 2015 |
| 2014 |
| 2016 over 2015 |
| 2015 over 2014 | ||||||||||
|
|
|
|
|
|
|
|
|
| ||||||||||
| (In millions) | ||||||||||||||||||
Loss (gain) on derivatives associated with terminated business combination | $ | - | |
| $ | (89 | ) |
| $ | (30 | ) |
| $ | 89 | |
| $ | (59 | ) |
Changes in gain or loss on derivatives associated with the terminated business combination with TEL resulted from exchange rate fluctuations and the sale of derivative contracts in fiscal 2015. For further details, see Note 5 of Notes to Consolidated Financial Statements.
Interest Expense and Interest and Other Income (loss), net
Interest expense and interest and other income (loss), net for the periods indicated were as follows:
|
|
|
|
|
|
| Change | ||||||||||||
| 2016 |
| 2015 |
| 2014 |
| 2016 over 2015 |
| 2015 over 2014 | ||||||||||
|
|
|
|
|
|
|
|
|
| ||||||||||
| (In millions) | ||||||||||||||||||
Interest expense | $ | 155 | |
| $ | 103 | |
| $ | 95 | |
| $ | 52 | |
| $ | 8 | |
Interest and other income, net | $ | 16 | |
| $ | 8 | |
| $ | 23 | |
| $ | 8 | |
| $ | (15 | ) |
Interest expenses incurred were primarily associated with the senior unsecured notes issued in June 2011 and September 2015. Interest expense for fiscal 2016 increased compared to fiscal 2015 due to the issuance of senior unsecured notes in September 2015.
Interest and other income, net primarily includes interest earned on cash and investments, realized gains or losses on sales of securities and impairment of strategic investments. Interest and other income, net in fiscal 2016 increased compared to fiscal 2015 primarily due to higher interest income from investments, partially offset by a $5 million loss from prepayment of $400 million debt. Interest and other income, net in fiscal 2015 decreased compared to fiscal 2014 primarily due to lower realized gains on sales of strategic investments in fiscal 2015.
34
Table of Contents
Income Taxes
Provision for income taxes and effective tax rates for the periods indicated were as follows:
|
|
|
|
|
|
| Change | ||||||||||||
| 2016 |
| 2015 |
| 2014 |
| 2016 over 2015 |
| 2015 over 2014 | ||||||||||
|
|
|
|
|
|
|
|
|
| ||||||||||
| (In millions, except percentages) | ||||||||||||||||||
Provision for income taxes | $ | 292 | |
| $ | 221 | |
| $ | 376 | |
| $ | 71 | |
| $ | (155 | ) |
Effective income tax rate | 14.5 | % |
| 13.8 | % |
| 26.0 | % |
| 0.7 points |
| (12.2) points | |||||||
Applied's provision for income taxes and effective tax rate are affected by the geographical composition of pre-tax income which includes jurisdictions with differing tax rates, conditional reduced tax rates and other income tax incentives. It is also affected by events that are not consistent from period to period, such as changes in income tax laws and the resolution of prior years' income tax filings.
Applied's effective tax rates for fiscal 2016, 2015 and 2014 were 14.5% , 13.8% and 26.0% , respectively. The effective tax rate for fiscal 2016 was higher than fiscal 2015 primarily due to resolutions and changes related to income tax liabilities for uncertain tax positions, partially offset by changes in the geographical composition of income.
The effective tax rate for fiscal 2015 was lower than the rate for fiscal 2014 primarily due to acquisition costs that became deductible in the second quarter of fiscal 2015 as a result of the termination of the proposed business combination with TEL, an adjustment in the second quarter of fiscal 2015 to correct an error in the recognition of cost of sales in the U.S. related to intercompany sales as discussed below, reinstatement of the U.S. federal research and development tax credit during the first quarter of fiscal 2015 which was retroactive to its expiration in December 2013, resolutions and changes related to income tax liabilities for prior years, and changes in the geographical composition of income.
The effective tax rate for fiscal 2015 included the effect of an adjustment primarily to correct an error in the recognition of cost of sales in the U.S. related to intercompany sales. While this error had no impact on Applied's consolidated cost of sales, it resulted in overstating profitability in the U.S. and the provision for income taxes, income taxes payable and other tax balance sheet accounts in each year since fiscal 2010. The impact of the adjustment to fiscal 2015 was a decrease in provision for income taxes of $28 million which was determined to be immaterial on the originating periods and fiscal 2015. Accordingly, a restatement was not considered necessary.
35
Table of Contents
Segment Information
Applied reports financial results in three segments: Semiconductor Systems, Applied Global Services, and Display and Adjacent Markets. A description of the products and services, as well as financial data, for each reportable segment can be found in Note 14 of Notes to Consolidated Financial Statements.
The Corporate and Other category includes revenues from products, as well as costs of products sold, for fabricating solar photovoltaic cells and modules and certain operating expenses that are not allocated to its reportable segments and are managed separately at the corporate level. These operating expenses include costs for share-based compensation; certain management, finance, legal, human resource, and RD&E functions provided at the corporate level; and unabsorbed information technology and occupancy. In addition, Applied does not allocate to its reportable segments restructuring and asset impairment charges and any associated adjustments related to restructuring actions, unless these actions pertain to a specific reportable segment.
The results for each reportable segment are discussed below.
Semiconductor Systems Segment
The Semiconductor Systems segment includes semiconductor capital equipment for deposition, etch, ion implantation, rapid thermal processing, chemical mechanical planarization, metrology and inspection, and wafer level packaging. Development efforts are focused on solving customers' key technical challenges in transistor, interconnect, patterning and packaging performance as devices scale to advanced technology nodes. The mobility trend remains the largest influence on industry spending, as it drives semiconductor device manufacturers to continually improve their ability to deliver high-performance, low-power processors and affordable memories.
Certain significant measures for the periods indicated were as follows:
|
|
|
|
|
|
| Change | ||||||||||||||||
| 2016 |
| 2015 |
| 2014 |
| 2016 over 2015 |
| 2015 over 2014 | ||||||||||||||
|
|
|
|
|
|
|
|
|
|
|
|
|
| ||||||||||
| (In millions, except percentages and ratios) | ||||||||||||||||||||||
New orders | $ | 7,289 | |
| $ | 6,581 | |
| $ | 6,132 | |
| $ | 708 | |
| 11% |
| $ | 449 | |
| 7% |
Net sales | 6,873 | |
| 6,135 | |
| 5,978 | |
| 738 | |
| 12% |
| 157 | |
| 3% | |||||
Book to bill ratio | 1.1 | |
| 1.1 | |
| 1.0 | |
|
|
|
|
|
|
|
| |||||||
Operating income | 1,807 | |
| 1,410 | |
| 1,391 | |
| 397 | |
| 28% |
| 19 | |
| 1% | |||||
Operating margin | 26.3 | % |
| 23.0 | % |
| 23.3 | % |
|
|
| 3.3 points |
|
|
| (0.3) points | |||||||
Non-GAAP Adjusted Results |
|
|
|
|
|
|
|
|
|
|
|
|
| ||||||||||
Non-GAAP adjusted operating income | 1,991 | |
| 1,588 | |
| $ | 1,565 | |
| 403 | |
| 25% |
| 23 | |
| 1% | ||||
Non-GAAP adjusted operating margin | 29.0 | % |
| 25.9 | % |
| 26.2 | % |
|
|
| 3.1 points |
|
|
| (0.3) points | |||||||
Reconciliations of non-GAAP adjusted measures are presented below under "Non-GAAP Adjusted Results."
New orders for Semiconductor Systems by end use application for the periods indicated were as follows:
| 2016 |
| 2015 |
| 2014 |
Foundry | 46% |
| 34% |
| 52% |
Memory | 42% |
| 53% |
| 35% |
Logic and other | 12% |
| 13% |
| 13% |
| 100% |
| 100% |
| 100% |
36
Table of Contents
The following region accounted for at least 30 percent of total net sales for the Semiconductor Systems segment for one or more of past three fiscal years:
|
|
|
|
|
|
| Change | ||||||||||||||||
| 2016 |
| 2015 |
| 2014 |
| 2016 over 2015 |
| 2015 over 2014 | ||||||||||||||
|
|
|
|
|
|
|
|
|
|
|
|
|
| ||||||||||
| (In millions, except percentages) | ||||||||||||||||||||||
Taiwan | $ | 2,165 | |
| $ | 1,982 | |
| $ | 2,186 | |
| $ | 183 | |
| 9% |
| $ | (204 | ) |
| (9)% |
Customers in Taiwan accounted for 32 percent, 32 percent and 37 percent of total net sales for Semiconductor Systems in fiscal 2016, 2015 and 2014, respectively. The increase in net sales from customers in Taiwan primarily reflected increased investments from foundry customers.
Financial results in the Semiconductor Systems segment for fiscal 2016 reflected steady overall demand for semiconductor equipment, with continued investments by memory customers in technology upgrades and additional capacity, reflecting primarily the transition from planar technology to 3D architectures. Foundry customers also invested in technology upgrades and new capacity to meet demand for advanced mobile chips. New orders for fiscal 2016 increased compared to the prior year primarily due to higher demand from foundry customers, partially offset by lower demand from memory customers. Net sales for fiscal 2016 increased compared to fiscal 2015 primarily due to higher spending from foundry and memory customers. The increase in the operating income, non-GAAP adjusted operating income, operating margin and non-GAAP adjusted operating margin for fiscal 2016 compared to fiscal 2015 primarily reflected higher net sales. Three customers accounted for approximately 54 percent of this segment's new orders for fiscal 2 016, each of whom represented at least 10 percent of this segment's new orders. Four customers accounted for approximately 60 percent of this segment's net sales for fiscal 2016, each of whom represented at least 10 percent of this segment's net sales.
The increase in new orders and net sales in fiscal 2015 compared to fiscal 2014 primarily reflected increased demand and spending from memory customers, partially offset by lower demand and spending from foundry customers. Two customers accounted for approximately 41 percent of net sales and three customers accounted for 53 percent of new orders in this segment in fiscal 2015. Operating income and non-GAAP adjusted operating income for fiscal 2015 increased compared to fiscal 2014, reflecting the increase in net sales, partially offset by changes in product mix and higher research and development expenses.
Applied Global Services Segment
The Applied Global Services segment provides integrated solutions to optimize equipment and fab performance and productivity, including spares, upgrades, services, certain remanufactured earlier generation equipment and factory automation software for semiconductor, display and other products. Customer demand for products and services is fulfilled through a global distribution system with trained service engineers located in close proximity to customer sites.
Certain significant measures for the periods indicated were as follows:
|
|
|
|
|
|
| Change | |||||||||||||||||
| 2016 |
| 2015 |
| 2014 |
| 2016 over 2015 |
| 2015 over 2014 | |||||||||||||||
|
|
|
|
|
|
|
|
|
|
|
|
|
| |||||||||||
| (In millions, except percentages and ratios) | |||||||||||||||||||||||
New orders | $ | 2,775 | |
| $ | 2,582 | |
| $ | 2,345 | |
| $ | 193 | |
| 7% |
| $ | 237 | |
| 10 | % |
Net sales | 2,589 | |
| 2,447 | |
| 2,114 | |
| 142 | |
| 6% |
| 333 | |
| 16 | % | |||||
Book to bill ratio | 1.1 | |
| 1.1 | |
| 1.1 | |
|
|
|
|
|
|
|
| ||||||||
Operating income | 682 | |
| 630 | |
| 538 | |
| 52 | |
| 8% |
| 92 | |
| 17 | % | |||||
Operating margin | 26.3 | % |
| 25.7 | % |
| 25.4 | % |
|
|
| 0.6 points |
|
|
| 0.3 points | ||||||||
Non-GAAP Adjusted Results |
|
|
|
|
|
|
|
|
|
|
|
|
| |||||||||||
Non-GAAP adjusted operating income | 683 | |
| 633 | |
| 541 | |
| 50 | |
| 8% |
| 92 | |
| 17 | % | |||||
Non-GAAP adjusted operating margin | 26.4 | % |
| 25.9 | % |
| 25.6 | % |
|
|
| 0.5 points |
|
|
| 0.3 points | ||||||||
Reconciliations of non-GAAP adjusted measures are presented below under "Non-GAAP Adjusted Results."
There was no single region that accounted for at least 30 percent of total net sales for the Applied Global Services segment for any of the past three fiscal years.
37
Table of Contents
New orders and net sales for fiscal 2016 slightly increased compared to fiscal 2015 primarily due to higher demand and spending on spares and services, partially offset by lower investments in 200mm equipment systems. Operating income, non-GAAP adjusted operating income, operating margin and non-GAAP adjusted operating margin for fiscal 2016 increased compared to fiscal 2015, reflecting higher net sales partially offset by increased headcount to support business growth. One customer accounted for approximately 15 percent of this segment's new orders for fiscal 2 016. Two customers accounted for approximately 23 percent of this segment's net sales for fiscal 2016, each of whom represented at least 10 percent of this segment's net sales.
New orders and net sales for fiscal 2015 increased compared to fiscal 2014 mainly due to higher demand for semiconductor spares and services, and 200mm equipment systems. Operating income, operating margin, non-GAAP adjusted operating income, and non-GAAP adjusted operating margin increased in fiscal 2015 compared fiscal 2014, reflecting the increase in net sales, which was partially offset by unfavorable product mix and the absence of a recovery of a regional customs duty assessment charge recorded in fiscal 2014.
Display and Adjacent Markets Segment
The Display and Adjacent Markets segment encompasses products for manufacturing liquid crystal displays (LCDs), organic light-emitting diodes (OLEDs), upgrades and flexible coating systems and other display technologies for TVs, personal computers (PCs), tablets, smart phones and other consumer-oriented devices. The segment is focused on expanding its presence through technologically-differentiated equipment for manufacturing large-scale TVs; emerging markets such as OLED, low temperature polysilicon (LTPS), metal oxide, and touch panel sectors; and development of products that provide customers with improved performance and yields. Display and Adjacent Markets industry growth depends primarily on consumer demand for increasingly larger and more advanced TVs as well as larger and higher resolution displays for next generation mobile devices, including OLED.
Certain significant measures for the periods presented were as follows:
|
|
|
|
|
|
| Change | ||||||||||||||||
| 2016 |
| 2015 |
| 2014 |
| 2016 over 2015 |
| 2015 over 2014 | ||||||||||||||
|
|
|
|
|
|
|
|
|
|
|
|
|
| ||||||||||
| (In millions, except percentages and ratios) | ||||||||||||||||||||||
New orders | $ | 2,160 | |
| $ | 828 | |
| $ | 1,066 | |
| $ | 1,332 | |
| 161% |
| $ | (238 | ) |
| (22)% |
Net sales | 1,206 | |
| 944 | |
| 848 | |
| 262 | |
| 28% |
| 96 | |
| 11% | |||||
Book to bill ratio | 1.8 | |
| 0.9 | |
| 1.3 | |
|
|
|
|
|
|
|
| |||||||
Operating income | 245 | |
| 191 | |
| 202 | |
| 54 | |
| 28% |
| (11 | ) |
| (5)% | |||||
Operating margin | 20.3 | % |
| 20.2 | % |
| 23.8 | % |
|
|
| 0.1 points |
|
|
| (3.6) points | |||||||
Non-GAAP Adjusted Results |
|
|
|
|
|
|
|
|
|
|
|
|
| ||||||||||
Non-GAAP adjusted operating income | 245 | |
| 194 | |
| $ | 206 | |
| 51 | |
| 26% |
| (12 | ) |
| (6)% | ||||
Non-GAAP adjusted operating margin | 20.3 | % |
| 20.6 | % |
| 24.3 | % |
|
|
| (0.3) points |
|
|
| (3.7) points | |||||||
Reconciliations of non-GAAP adjusted measures are presented below under "Non-GAAP Adjusted Results."
The following regions accounted for at least 30 percent of total net sales for the Display and Adjacent Markets segment for one or more of the periods presented:
|
|
|
|
|
|
| Change | ||||||||||||||||
| 2016 |
| 2015 |
| 2014 |
| 2016 over 2015 |
| 2015 over 2014 | ||||||||||||||
|
|
|
|
|
|
|
|
|
|
|
|
|
| ||||||||||
| (In millions, except percentages) | ||||||||||||||||||||||
China | $ | 449 | |
| $ | 624 | |
| $ | 584 | |
| $ | (175 | ) |
| (28)% |
| $ | 40 | |
| 7% |
Korea | $ | 492 | |
| $ | 163 | |
| $ | 143 | |
| $ | 329 | |
| 202% |
| $ | 20 | |
| 14% |
In fiscal 2016, 2015 and 2014, customers in China accounted for 37 percent, 66 percent and 69 percent, respectively, of the Display and Adjacent Markets segment's total net sales. Customers in Korea accounted for 41 percent, 17 percent and 17 percent of total net sales for the Display and Adjacent Markets segment in fiscal 2016, 2015 and 2014, respectively. The decrease in net sales from customers in China reflected lower customer investments in TV manufacturing equipment, while the increase in net sales from customers in Korea related to investments in mobile display manufacturing equipment.
38
Table of Contents
New orders for fiscal 2016 increased compared to fiscal 2015 primarily due to increased orders for mobile display manufacturing equipment, reflecting increased demand for new technology, and TV manufacturing equipment. Net sales for fiscal 2016 increased compared to fiscal 2015 primarily due to higher customer investments in mobile display manufacturing equipment, partially offset by lower customer spending in TV manufacturing equipment. Operating income and non-GAAP adjusted operating income increased while operating margin and non-GAAP adjusted operating margin remained essentially flat or decreased slightly for fiscal 2016 compared to fiscal 2015, reflecting unfavorable product mix and higher research and new product development costs. Two customers accounted for approximately 63 percent of new orders for the Display and Adjacent Markets segment in fiscal 2016, with one customer accounting for approximately 36 percent of new orders. Two customers accounted for approximately 55 percent of net sales for this segment in fiscal 2016, with one customer accounting for approximately 44 percent of net sales.
New orders for fiscal 2015 decreased compared to fiscal 2014 primarily due to lower TV manufacturing equipment orders, while net sales for fiscal 2015 were higher due to the timing of shipments. Operating income and non-GAAP adjusted operating income increased for fiscal 2015 from fiscal 2014, reflecting higher net sales. Operating margin and non-GAAP adjusted operating margin decreased, despite the increase in net sales, primarily due to unfavorable product mix, increased research and development expenses and the sale of tools in fiscal 2014 for which inventory had been previously fully reserved. Four customers accounted for approximately 65 percent of new orders for the Display and Adjacent Markets segment in fiscal 2015, with two customers accounting for approximately 37 percent of new orders. Four customers accounted for approximately 79 percent of net sales for this segment in fiscal 2015, with two customers accounting for approximately 46 percent of net sales.
Recent Accounting Pronouncements
For a description of recent accounting pronouncements, including the expected dates of adoption and estimated effects, if any, on Applied's consolidated financial statements, see Note 1, "Summary of Significant Accounting Policies," of the Notes to Consolidated Financial Statements.
39
Table of Contents
Financial Condition, Liquidity and Capital Resources
Applied's cash, cash equivalents and investments consist of the following:
| October 30, |
| October 25, | ||||
|
|
|
| ||||
| (In millions) | ||||||
Cash and cash equivalents | $ | 3,406 | |
| $ | 4,797 | |
Short-term investments | 343 | |
| 168 | | ||
Long-term investments | 929 | |
| 946 | | ||
Total cash, cash-equivalents and investments | $ | 4,678 | |
| $ | 5,911 | |
Sources and Uses of Cash
A summary of cash provided by (used in) operating, investing, and financing activities is as follows:
| 2016 |
| 2015 |
| 2014 | ||||||
|
|
|
|
|
| ||||||
| (In millions) | ||||||||||
Cash provided by operating activities | $ | 2,466 | |
| $ | 1,163 | |
| $ | 1,800 | |
Cash used in investing activities | $ | (425 | ) |
| $ | (281 | ) |
| $ | (161 | ) |
Cash provided by (used in) financing activities | $ | (3,432 | ) |
| $ | 913 | |
| $ | (348 | ) |
Operating Activities
Cash from operating activities for fiscal 2016 was $2.5 billion , which reflects net income adjusted for the effect of non-cash charges and changes in working capital components. Non-cash charges included depreciation, amortization, share-based compensation and deferred income taxes. The primary drivers of the increase in cash from operating activities from fiscal 2015 to fiscal 2016 included higher net income and increases in customer deposits, deferred revenue, accounts payable and accrued expenses, partially offset by higher increases in accounts receivable. The primary drivers of the decrease in cash from operating activities from fiscal 2014 to fiscal 2015 were the increases in inventories and deferred income taxes and decreases in accounts payable, accrued expenses, customer deposits, deferred revenue and income taxes payable, partially offset by higher net income.
Applied has agreements with various financial institutions to sell accounts receivable and discount promissory notes from selected customers. Applied sells its accounts receivable without recourse. Applied, from time to time, also discounts letters of credit issued by customers through various financial institutions. The discounting of letters of credit depends on many factors, including the willingness of financial institutions to discount the letters of credit and the cost of such arrangements. Applied sold $75 million and $45 million of accounts receivable during fiscal 2016 and 2014, respectively. Applied did not sell accounts receivable during fiscal 2015. Applied did not discount promissory notes or utilize programs to discount letters of credit issued by customers during fiscal 2016 or 2015. Applied discounted $29 million letters of credit issued by customers during fiscal 2014.
Applied's working capital was $4.7 billion at October 30, 2016 and $5.5 billion at October 25, 2015 . Applied's working capital at October 30, 2016 includes the effects of the adoption of the authoritative guidance requiring all deferred tax assets and liabilities, and any related valuation allowance, to be classified as noncurrent on the balance sheet. Prior periods were not retrospectively adjusted.
Days sales, inventory and payable outstanding at the end of each of the periods indicated were:
| 2016 |
| 2015 |
| 2014 |
|
|
|
|
|
|
Days sales outstanding | 63 |
| 67 |
| 67 |
Days inventory outstanding | 98 |
| 118 |
| 109 |
Days payable outstanding | 39 |
| 42 |
| 43 |
Days sales outstanding varies due to the timing of shipments and payment terms. Days sales outstanding decreased at the end of fiscal 2016 compared to fiscal 2015 primarily due to higher revenue and sale of accounts receivable, and remained flat at the end of fiscal 2015 compared to fiscal 2014. The decrease in days inventory outstanding during the current year compared to prior year reflected increased business volume, offset by higher inventory balances at the end of fiscal 2016. Days inventory outstanding increased at the end of fiscal 2015 compared to fiscal 2014 reflecting higher inventory near the end of the period due to increase in deferred inventory and more builds as compared to revenue turns. Days payable outstanding decreased slightly during fiscal 2016 compared to fiscal 2015 reflecting higher total cost of products sold due to higher business volume, and remained relatively flat in fiscal 2015 compared to fiscal 2014.
40
Table of Contents
Investing Activities
Applied used $425 million , $281 million , and $161 million of cash in investing activities in fiscal 2016, 2015 and 2014, respectively. Capital expenditures in fiscal 2016, 2015 and 2014 were $253 million , $215 million and $241 million , respectively. Capital expenditures in fiscal 2016 and 2015 were primarily for demonstration and test equipment and laboratory tools in North America. Capital expenditures in fiscal 2014 were primarily for demonstration and test equipment and infrastructure improvements in North America, including creation of a new pilot operation facility and distribution center. Purchases of investments, net of proceeds from sales and maturities of investments was $156 million and $62 million for fiscal 2016 and 2015, respectively. Proceeds from sales and maturities of investments, net of purchases of investments totaled $67 million in fiscal 2014. Investing activities also included investments in technology to allow Applied to access new market opportunities or emerging technologies.
Applied's investment portfolio consists principally of investment grade money market mutual funds, U.S. Treasury and agency securities, municipal bonds, corporate bonds and mortgage-backed and asset-backed securities, as well as equity securities. Applied regularly monitors the credit risk in its investment portfolio and takes appropriate measures, which may include the sale of certain securities, to manage such risks prudently in accordance with its investment policies.
Financing Activities
Applied used $3.4 billion of cash in financing activities in fiscal 2016, consisting primarily of $1.2 billion in debt repayments, $1.9 billion in repurchases of its common stock, and $444 million in cash dividends to stockholders, offset by excess tax benefits from share-based compensation of $23 million and proceeds from common stock issuances of $88 million.
Applied generated $913 million of cash from financing activities in fiscal 2015, consisting primarily of net proceeds received from the issuance of senior unsecured notes of $1.8 billion and short-term borrowings of $800 million, offset by cash used for repurchases of its common stock of $1.3 billion and payment of cash dividends of $487 million . Applied used $348 million of cash in financing activities in fiscal 2014, which included payment of cash dividends to stockholders and issuances of common stock. Applied made no repurchases of its common stock in fiscal 2014. On June 9, 2016, Applied's Board of Directors approved a new common stock repurchase program authorizing up to $2.0 billion in repurchases which followed the completion of a $3.0 billion common stock repurchase program approved on April 26, 2015. At October 30, 2016 , $1.8 billion remained available for future stock repurchases under this repurchase program. Proceeds from stock issuances under equity compensation awards and related excess tax benefits in fiscal 2016, 2015 and 2014 were $111 million , $144 million and $137 million , respectively.
During each of fiscal 2016, 2015 and 2014, Applied's Board of Directors declared quarterly cash dividends in the amount of $0.10 per share. Applied currently anticipates that cash dividends will continue to be paid on a quarterly basis, although the declaration of any future cash dividend is at the discretion of the Board of Directors and will depend on Applied's financial condition, results of operations, capital requirements, business conditions and other factors, as well as a determination by the Board of Directors that cash dividends are in the best interests of Applied's stockholders.
Applied has credit facilities for unsecured borrowings in various currencies of up to $1.6 billion , of which $1.5 billion is comprised of a committed revolving credit agreement with a group of banks that is scheduled to expire in September 2020 . This agreement provides for borrowings in United States dollars at interest rates keyed to one of two rates selected by Applied for each advance and includes financial and other covenants with which Applied was in compliance at October 30, 2016 . Remaining credit facilities in the amount of approximately $77 million are with Japanese banks. Applied's ability to borrow under these facilities is subject to bank approval at the time of the borrowing request, and any advances will be at rates indexed to the banks' prime reference rate denominated in Japanese yen. No amounts were outstanding under any of these facilities at both October 30, 2016 and October 25, 2015 , and Applied has not utilized these credit facilities.
In fiscal 2011, Applied established a short-term commercial paper program of up to $1.5 billion. At October 30, 2016 and October 25, 2015 , Applied did not have any commercial paper outstanding, but may issue commercial paper notes under this program from time to time in the future.
Applied had senior unsecured notes in the aggregate principal amount of $3.4 billion outstanding as of October 30, 2016 . The indentures governing these notes include covenants with which Applied was in compliance at October 30, 2016 . In November 2015, Applied completed the redemption of the entire outstanding $400 million in principal amount of senior notes due in 2016. The redemption price was $405 million, and after adjusting for the carrying value of the debt issuance costs and discounts, Applied recorded a $5 million loss on the prepayment of the $400 million debt, which is included in non-operating loss in the Consolidated Statement of Operations for the first quarter of fiscal 2016. See Note 9 of Notes to Consolidated Financial Statements for additional discussion of existing debt. Applied may seek to refinance its existing debt and may incur additional indebtedness depending on Applied's capital requirements and the availability of financing.
41
Table of Contents
Others
During fiscal 2016, Applied recorded a bad debt provision of $3 million, and released $9 million and $16 million in fiscal 2015 and 2014, respectively, of its allowance for doubtful accounts as a result of an overall lower risk profile of Applied's customers. While Applied believes that its allowance for doubtful accounts at October 30, 2016 is adequate, it will continue to closely monitor customer liquidity and economic conditions.
As of October 30, 2016 , approximately $4.0 billion of cash, cash equivalents and marketable securities held by foreign subsidiaries may be subject to U.S. income taxes if repatriated for U.S. operations. Applied intends to indefinitely reinvest approximately $3.3 billion of these funds outside of the U.S. and does not plan to repatriate these funds. Applied would need to accrue and pay U.S. taxes if these funds were repatriated. For the remaining cash, cash equivalents and marketable securities held by foreign subsidiaries, U.S. income taxes have been provided for in the financial statements. Subsequent to October 30, 2016 , a foreign subsidiary of Applied made an advance payment of $1.8 billion to Applied. Applied's provision for income taxes and effective tax rate will not be materially affected by this transaction.
Although cash requirements will fluctuate based on the timing and extent of factors such as those discussed above, Applied's management believes that cash generated from operations, together with the liquidity provided by existing cash balances and borrowing capability, will be sufficient to satisfy Applied's liquidity requirements for the next 12 months. For further details regarding Applied's operating, investing and financing activities, see the Consolidated Statements of Cash Flows in this report.
For details on standby letters of credit and other agreements with banks, see Off-Balance Sheet Arrangements below.
42
Table of Contents
Off-Balance Sheet Arrangements
In the ordinary course of business, Applied provides standby letters of credit or other guarantee instruments to third parties as required for certain transactions initiated by either Applied or its subsidiaries. As of October 30, 2016 , the maximum potential amount of future payments that Applied could be required to make under these guarantee agreements was approximately $52 million . Applied has not recorded any liability in connection with these guarantee agreements beyond that required to appropriately account for the underlying transaction being guaranteed. Applied does not believe, based on historical experience and information currently available, that it is probable that any amounts will be required to be paid under these guarantee agreements.
Applied also has agreements with various banks to facilitate subsidiary banking operations worldwide, including overdraft arrangements, issuance of bank guarantees, and letters of credit. As of October 30, 2016 , Applied Materials Inc. has provided parent guarantees to banks for approximately $100 million to cover these arrangements.
Applied also has operating leases for various facilities. Total rent expense for fiscal 2016, 2015 and 2014 was $38 million , $32 million and $37 million , respectively.
Contractual Obligations
The following table summarizes Applied's contractual obligations as of October 30, 2016 :
| Payments Due by Period | ||||||||||||||||||
Contractual Obligations | Total |
| Less Than 1 Year |
| 1-3 Years |
| 3-5 Years |
| More Than 5 Years | ||||||||||
|
|
|
|
|
|
|
|
|
| ||||||||||
| (In millions) | ||||||||||||||||||
Debt obligations | $ | 3,350 | |
| $ | 200 | |
| $ | - | |
| $ | 1,350 | |
| $ | 1,800 | |
Interest expense associated with debt obligations | 1,846 | |
| 150 | |
| 272 | |
| 256 | |
| 1,168 | | |||||
Operating lease obligations | 66 | |
| 26 | |
| 27 | |
| 7 | |
| 6 | | |||||
Purchase obligations 1 | 2,336 | |
| 1,999 | |
| 234 | |
| 62 | |
| 41 | | |||||
Other long-term liabilities 2,3 | 21 | |
| 1 | |
| 3 | |
| 2 | |
| 15 | | |||||
Total | $ | 7,619 | |
| $ | 2,376 | |
| $ | 536 | |
| $ | 1,677 | |
| $ | 3,030 | |
______________________
1 | Represents Applied's agreements to purchase goods and services consisting of Applied's outstanding purchase orders for goods and services. |
2 | Other long-term liabilities in the table do not include pension, post-retirement and deferred compensation plans due to the uncertainty in the timing of future payments. Applied evaluates the need to make contributions to its pension and post-retirement benefit plans after considering the funded status of the plans, movements in the discount rate, performance of the plan assets and related tax consequences. Payments to the plans would be dependent on these factors and could vary across a wide range of amounts and time periods. Payments for deferred compensation plans are dependent on activity by participants, making the timing of payments uncertain. Information on Applied's pension, post-retirement benefit and deferred compensation plans is presented in Note 11, Employee Benefit Plans, of the consolidated financial statements. |
3 | Applied's other long-term liabilities in the Consolidated Balance Sheets include deferred tax liabilities, gross unrecognized tax benefits and related gross interest and penalties. As of October 30, 2016 , the gross liability for unrecognized tax benefits that was not expected to result in payment of cash within one year was $320 million . Interest and penalties related to uncertain tax positions that were not expected to result in payment of cash within one year of October 30, 2016 and October 25, 2015 were $33 million and $14 million , respectively. At this time, Applied is unable to make a reasonably reliable estimate of the timing of payments due to uncertainties in the timing of tax audit outcomes; therefore, such amounts are not included in the above contractual obligation table. |
43
Table of Contents
Critical Accounting Policies and Estimates
The preparation of consolidated financial statements and related disclosures in conformity with accounting principles generally accepted in the United States of America requires management to make judgments, assumptions and estimates that affect the amounts reported. Note 1 of Notes to Consolidated Financial Statements describes the significant accounting policies used in the preparation of the consolidated financial statements. Certain of these significant accounting policies are considered to be critical accounting policies.
A critical accounting policy is defined as one that is both material to the presentation of Applied's consolidated financial statements and that requires management to make difficult, subjective or complex judgments that could have a material effect on Applied's financial condition or results of operations. Specifically, these policies have the following attributes: (1) Applied is required to make assumptions about matters that are highly uncertain at the time of the estimate; and (2) different estimates Applied could reasonably have used, or changes in the estimate that are reasonably likely to occur, would have a material effect on Applied's financial condition or results of operations.
Estimates and assumptions about future events and their effects cannot be determined with certainty. Applied bases its estimates on historical experience and on various other assumptions believed to be applicable and reasonable under the circumstances. These estimates may change as new events occur, as additional information is obtained and as Applied's operating environment changes. These changes have historically been minor and have been included in the consolidated financial statements as soon as they became known. In addition, management is periodically faced with uncertainties, the outcomes of which are not within its control and will not be known for prolonged periods of time. These uncertainties include those discussed in Part I, Item 1A, "Risk Factors." Based on a critical assessment of its accounting policies and the underlying judgments and uncertainties affecting the application of those policies, management believes that Applied's consolidated financial statements are fairly stated in accordance with accounting principles generally accepted in the United States of America, and provide a meaningful presentation of Applied's financial condition and results of operations.
Management believes that the following are critical accounting policies and estimates:
Revenue Recognition
Applied recognizes revenue when all four revenue recognition criteria have been met: persuasive evidence of an arrangement exists; delivery has occurred or services have been rendered; sales price is fixed or determinable; and collectability is probable. Each sale arrangement may contain commercial terms that differ from other arrangements. In addition, Applied frequently enters into contracts that contain multiple deliverables. Judgment is required to properly identify the accounting units of the multiple deliverable transactions and to determine the manner in which revenue should be allocated among the accounting units. Moreover, judgment is used in interpreting the commercial terms and determining when all criteria of revenue recognition have been met in order for revenue recognition to occur in the appropriate accounting period. While changes in the allocation of the estimated sales price between the units of accounting will not affect the amount of total revenue recognized for a particular sales arrangement, any material changes in these allocations could impact the timing of revenue recognition, which could have a material effect on Applied's financial condition and results of operations.
Warranty Costs
Applied provides for the estimated cost of warranty when revenue is recognized. Estimated warranty costs are determined by analyzing specific product, current and historical configuration statistics and regional warranty support costs. Applied's warranty obligation is affected by product and component failure rates, material usage and labor costs incurred in correcting product failures during the warranty period. As Applied's customer engineers and process support engineers are highly trained and deployed globally, labor availability is a significant factor in determining labor costs. The quantity and availability of critical replacement parts is another significant factor in estimating warranty costs. Unforeseen component failures or exceptional component performance can also result in changes to warranty costs. If actual warranty costs differ substantially from Applied's estimates, revisions to the estimated warranty liability would be required, which could have a material adverse effect on Applied's business, financial condition and results of operations.
Allowance for Doubtful Accounts
Applied maintains an allowance for doubtful accounts for estimated losses resulting from the inability of its customers to make required payments. This allowance is based on historical experience, credit evaluations, specific customer collection history and any customer-specific issues Applied has identified. Changes in circumstances, such as an unexpected material adverse change in a major customer's ability to meet its financial obligation to Applied or its payment trends, may require Applied to further adjust its estimates of the recoverability of amounts due to Applied, which could have a material adverse effect on Applied's business, financial condition and results of operations.
44
Table of Contents
Inventory Valuation
Inventories are generally stated at the lower of cost or market, with cost determined on a first-in, first-out basis. The carrying value of inventory is reduced for estimated obsolescence by the difference between its cost and the estimated market value based upon assumptions about future demand. Applied evaluates the inventory carrying value for potential excess and obsolete inventory exposures by analyzing historical and anticipated demand. In addition, inventories are evaluated for potential obsolescence due to the effect of known and anticipated engineering change orders and new products. If actual demand were to be substantially lower than estimated, additional adjustments for excess or obsolete inventory may be required, which could have a material adverse effect on Applied's business, financial condition and results of operations.
Goodwill and Intangible Assets
Applied reviews goodwill and intangible assets for impairment whenever events or changes in circumstances indicate that the carrying amount of these assets may not be recoverable, and also annually reviews goodwill and intangibles with indefinite lives for impairment. Intangible assets, such as purchased technology, are generally recorded in connection with a business acquisition. The value assigned to intangible assets is usually based on estimates and judgments regarding expectations for the success and life cycle of products and technology acquired. If actual product acceptance differs significantly from the estimates, Applied may be required to record an impairment charge to reduce the carrying value of the reporting unit to its estimated fair value.
To test goodwill for impairment, Applied first performs a qualitative assessment to determine whether it is more likely than not that the fair value of a reporting unit is less than its carrying value. If it is concluded that this is the case, Applied then performs the two-step goodwill impairment test. Otherwise, the two-step goodwill impairment test is not required. Under the two-step goodwill impairment test, Applied would in the first step compare the estimated fair value of each reporting unit to its carrying value. If the carrying value of a reporting unit exceeds its estimated fair value, Applied would then perform the second step of the impairment test in order to determine the implied fair value of the reporting unit's goodwill. If Applied determines that the carrying value of a reporting unit's goodwill exceeds its implied fair value, Applied would record an impairment charge equal to the difference.
Applied determines the fair value of each reporting unit based on a weighting of an income and a market approach. Applied bases the fair value estimates on assumptions that it believes to be reasonable but that are unpredictable and inherently uncertain. Under the income approach, Applied estimates the fair value based on discounted cash flow method.
The estimates used in the impairment testing are consistent with the discrete forecasts that Applied uses to manage its business, and considers any significant developments during the period. Under the discounted cash flow method, cash flows beyond the discrete forecasts are estimated using a terminal growth rate, which considers the long-term earnings growth rate specific to the reporting units. The estimated future cash flows are discounted to present value using each reporting unit's weighted average cost of capital. The weighted average cost of capital measures a reporting unit's cost of debt and equity financing weighted by the percentage of debt and equity in a reporting unit's target capital structure. In addition, the weighted average cost of capital is derived using both known and estimated market metrics, and is adjusted to reflect both the timing and risks associated with the estimated cash flows. The tax rate used in the discounted cash flow method is the median tax rate of comparable companies and reflects Applied's current international structure, which is consistent with the market participant perspective. Under the market approach, Applied uses the guideline company method which applies market multiples to forecasted revenues and earnings before interest, taxes, depreciation and amortization. Applied uses market multiples that are consistent with comparable publicly-traded companies and considers each reporting unit's size, growth and profitability relative to its comparable companies.
Management uses significant judgment when assessing goodwill for potential impairment, especially in emerging markets. Indicators of potential impairment include, but are not limited to, challenging economic conditions, an unfavorable industry or economic environment or other severe decline in market conditions. Such conditions could have the effect of changing one of the critical assumptions or estimates used for the fair value calculation, resulting in an unexpected goodwill impairment charge, which could have a material adverse effect on Applied's business, financial condition and results of operations. See Note 8 of Notes to Consolidated Financial Statements for additional discussion of goodwill impairment.
45
Table of Contents
Income Taxes
Applied's provision for income taxes and effective tax rate are affected by the geographical composition of pre-tax income which includes jurisdictions with differing tax rates, conditional reduced tax rates and other income tax incentives. It is also affected by events that are not consistent from period to period, such as changes to income tax laws and the resolution of prior years' income tax filings.
Applied recognizes a current tax liability for the estimated amount of income tax payable on tax returns for the current fiscal year. Deferred tax assets and liabilities are recognized for the estimated future tax effects of temporary differences between the book and tax bases of assets and liabilities. Deferred tax assets are also recognized for net operating loss and tax credit carryforwards. Deferred tax assets are offset by a valuation allowance to the extent it is more likely than not that they are not expected to be realized.
Applied recognizes tax benefits from uncertain tax positions only if it is more likely than not that the tax position will be sustained upon examination by the taxing authorities based on the technical merits of the position. The tax benefits recognized from such positions are estimated based on the largest benefit that has a greater than 50% likelihood of being realized upon ultimate settlement. Any changes in judgment related to uncertain tax positions are recognized in the Consolidated Statements of Operations in the quarter in which such change occurs. Interest and penalties related to uncertain tax positions are recognized in Applied's provision for income taxes.
The calculation of Applied's provision for income taxes and effective tax rate involves significant judgment in estimating the impact of uncertainties in the application of complex tax laws. Resolution of these uncertainties in a manner inconsistent with Applied's expectations could have an adverse material impact on Applied's results of operations and financial condition.
Non-GAAP Adjusted Financial Results
Applied provides investors with certain non-GAAP adjusted financial measures, which are adjusted to exclude the impact of certain costs, expenses, gains and losses, including certain items related to mergers and acquisitions; restructuring charges and any associated adjustments; impairments of assets, or investments; gain or loss on sale of strategic investments; certain other discrete adjustments and income tax items. Reconciliations of these non-GAAP measures to the most directly comparable financial measures calculated and presented in accordance with GAAP are provided in the financial tables presented below.
Management uses these non-GAAP adjusted financial measures to evaluate the Company's operating and financial performance and for planning purposes, and as performance measures in its executive compensation program. Applied believes these measures enhance an overall understanding of our performance and investors' ability to review the Company's business from the same perspective as the Company's management and facilitate comparisons of this period's results with prior periods on a consistent basis by excluding items that we do not believe are indicative of our ongoing operating performance. There are limitations in using non-GAAP financial measures because the non-GAAP financial measures are not prepared in accordance with generally accepted accounting principles, may be different from non-GAAP financial measures used by other companies, and may exclude certain items that may have a material impact upon our reported financial results. The presentation of this additional information is not meant to be considered in isolation or as a substitute for the directly comparable financial measures prepared in accordance with GAAP.
46
Table of Contents
The following tables present a reconciliation of the GAAP and non-GAAP adjusted consolidated results for the past three fiscal years:
APPLIED MATERIALS, INC.
UNAUDITED RECONCILIATION OF GAAP TO NON-GAAP ADJUSTED RESULTS
(In millions, except percentages) |
| 2016 |
| 2015 |
| 2014 | ||||||
|
|
|
|
|
|
| ||||||
Non-GAAP Adjusted Gross Profit |
|
|
|
|
|
| ||||||
Reported gross profit - GAAP basis |
| $ | 4,511 | |
| $ | 3,952 | |
| $ | 3,843 | |
Certain items associated with acquisitions 1 |
| 167 | |
| 162 | |
| 158 | | |||
Acquisition integration and deal costs |
| - | |
| - | |
| 1 | | |||
Inventory charges (reversals) related to restructuring 3, 4 |
| (2 | ) |
| 35 | |
| - | | |||
Other significant gains, losses or charges, net 7 |
| - | |
| (2 | ) |
| - | | |||
Non-GAAP adjusted gross profit |
| $ | 4,676 | |
| $ | 4,147 | |
| $ | 4,002 | |
Non-GAAP adjusted gross margin |
| 43.2 | % |
| 42.9 | % |
| 44.1 | % | |||
Non-GAAP Adjusted Operating Income |
|
|
|
|
|
| ||||||
Reported operating income - GAAP basis |
| $ | 2,152 | |
| $ | 1,693 | |
| $ | 1,520 | |
Certain items associated with acquisitions 1 |
| 188 | |
| 185 | |
| 183 | | |||
Acquisition integration and deal costs |
| 2 | |
| 2 | |
| 34 | | |||
Gain on derivatives associated with terminated business combination, net |
| - | |
| (89 | ) |
| (30 | ) | |||
Certain items associated with terminated business combination 2 |
| - | |
| 50 | |
| 73 | | |||
Inventory charges (reversals) related to restructuring and asset impairments 3,4,5 |
| (3 | ) |
| 49 | |
| 5 | | |||
Other significant gains, losses or charges, net 6,7 |
| 8 | |
| 6 | |
| (4 | ) | |||
Non-GAAP adjusted operating income |
| $ | 2,347 | |
| $ | 1,896 | |
| $ | 1,781 | |
Non-GAAP adjusted operating margin |
| 21.7 | % |
| 19.6 | % |
| 19.6 | % | |||
Non-GAAP Adjusted Net Income |
|
|
|
|
|
| ||||||
Reported net income - GAAP basis 8 |
| $ | 1,721 | |
| $ | 1,377 | |
| $ | 1,072 | |
Certain items associated with acquisitions 1 |
| 188 | |
| 185 | |
| 183 | | |||
Acquisition integration and deal costs |
| 2 | |
| 2 | |
| 34 | | |||
Gain on derivatives associated with terminated business combination, net |
| - | |
| (89 | ) |
| (30 | ) | |||
Certain items associated with terminated business combination 2 |
| - | |
| 50 | |
| 73 | | |||
Inventory charges (reversals) related to restructuring and asset impairments 3,4 |
| (3 | ) |
| 49 | |
| 5 | | |||
Loss on early extinguishment of debt |
| 5 | |
| - | |
| - | | |||
Impairment (gain on sale) of strategic investments, net |
| 3 | |
| 4 | |
| (9 | ) | |||
Other significant gains, losses or charges, net 6,7 |
| 8 | |
| 6 | |
| (4 | ) | |||
Reinstatement of federal R&D tax credit, resolution of prior years' income tax filings and other tax items 8 |
| 45 | |
| (110 | ) |
| 28 | | |||
Income tax effect of non-GAAP adjustments 9 |
| (19 | ) |
| (17 | ) |
| (38 | ) | |||
Non-GAAP adjusted net income |
| $ | 1,950 | |
| $ | 1,457 | |
| $ | 1,314 | |
1 | These items are incremental charges attributable to completed acquisitions, consisting of amortization of purchased intangible assets. |
2 | These items are incremental charges related to the terminated business combination agreement with Tokyo Electron Limited, consisting of acquisition-related and integration planning costs. |
3 | Results for fiscal 2016 primarily included benefit from sales of solar equipment tools for which inventory had been previously reserved related to the cost reductions in the solar business. |
4 | Results for fiscal 2015 primarily included $35 million of inventory charges, $17 million of restructuring charges and asset impairments related to cost reductions in the solar business, and a $2 million favorable adjustment of restructuring reserves related to prior restructuring plans. |
5 | Results for fiscal 2014 included $5 million of employee-related costs related to the restructuring program announced on October 3, 2012. |
6 | Results for fiscal 2016 included a loss of $8 million due to discontinuance of cash flow hedges that were probable not to occur by the end of the originally specified time period. |
7 | Results for fiscal 2015 included immaterial correction of errors related to prior periods, partially offset by costs related to executive termination. |
8 | Amounts for fiscal 2016 and 2015 included resolution of prior years' income tax filings and other tax items. Amounts for fiscal 2015 included an adjustment to decrease the provision for income taxes by $28 million with a corresponding increase in net income, resulting in an increase in diluted earnings per share of $0.02. The adjustment was excluded in Applied's non-GAAP adjusted results and was made primarily to correct an error in the recognition of cost of sales in the U.S. related to intercompany sales, which resulted in overstating profitability in the U.S. and the provision for income taxes in immaterial amounts in each year since fiscal 2010. |
9 | These amounts represent non-GAAP adjustments above multiplied by the effective tax rate within the jurisdictions the adjustments affect. |
47
Table of Contents
APPLIED MATERIALS, INC.
UNAUDITED RECONCILIATION OF GAAP TO NON-GAAP ADJUSTED RESULTS
(In millions, except per share amounts) |
| 2016 |
| 2015 |
| 2014 | ||||||
|
|
|
|
| ||||||||
Non-GAAP Adjusted Earnings Per Diluted Share |
|
|
|
|
|
| ||||||
Reported earnings per diluted share - GAAP basis 1 |
| $ | 1.54 | |
| $ | 1.12 | |
| $ | 0.87 | |
Certain items associated with acquisitions |
| 0.16 | |
| 0.14 | |
| 0.13 | | |||
Acquisition integration and deal costs |
| - | |
| - | |
| 0.02 | | |||
Certain items associated with terminated business combination |
| - | |
| 0.03 | |
| 0.05 | | |||
Gain on derivatives associated with terminated business combination, net |
| - | |
| (0.05 | ) |
| (0.02 | ) | |||
Restructuring, inventory charges and asset impairments |
| - | |
| 0.03 | |
| - | | |||
Other significant gains, losses or charges, net |
| 0.01 | |
| 0.01 | |
| - | | |||
Reinstatement of federal R&D tax credit, resolution of prior years' income tax filings and other tax items 1 |
| 0.04 | |
| (0.09 | ) |
| 0.02 | | |||
Non-GAAP adjusted earnings per diluted share |
| $ | 1.75 | |
| $ | 1.19 | |
| $ | 1.07 | |
Weighted average number of diluted shares |
| 1,116 | |
| 1,226 | |
| 1,231 | | |||
1 | Amounts for fiscal 2016 and 2015 included resolution of prior years' income tax filings and other tax items. Amounts for fiscal 2015 included an adjustment to decrease the provision for income taxes by $28 million with a corresponding increase in net income, resulting in an increase in diluted earnings per share of $0.02. The adjustment was excluded in Applied's non-GAAP adjusted results and was made primarily to correct an error in the recognition of cost of sales in the U.S. related to intercompany sales, which resulted in overstating profitability in the U.S. and the provision for income taxes in immaterial amounts in each year since fiscal 2010. |
48
Table of Contents
The following table presents a reconciliation of the GAAP and non-GAAP adjusted segment results for the past three fiscal years:
APPLIED MATERIALS, INC.
UNAUDITED RECONCILIATION OF GAAP TO NON-GAAP ADJUSTED RESULTS
(In millions, except percentages) |
| 2016 |
| 2015 |
| 2014 | ||||||
|
|
|
|
|
|
| ||||||
Semiconductor Systems Non-GAAP Adjusted Operating Income |
|
|
|
|
|
| ||||||
Reported operating income - GAAP basis |
| $ | 1,807 | |
| $ | 1,410 | |
| $ | 1,391 | |
Certain items associated with acquisitions 1 |
| 184 | |
| 178 | |
| 172 | | |||
Acquisition integration costs |
| - | |
| - | |
| 2 | | |||
Non-GAAP adjusted operating income |
| $ | 1,991 | |
| $ | 1,588 | |
| $ | 1,565 | |
Non-GAAP adjusted operating margin |
| 29.0 | % |
| 25.9 | % |
| 26.2 | % | |||
|
|
|
|
|
|
| ||||||
AGS Non-GAAP Adjusted Operating Income |
|
|
|
|
|
| ||||||
Reported operating income - GAAP basis |
| $ | 682 | |
| $ | 630 | |
| $ | 538 | |
Certain items associated with acquisitions 1 |
| 1 | |
| 1 | |
| 3 | | |||
Restructuring, inventory charges and asset impairments 2 |
| - | |
| 3 | |
| - | | |||
Other significant gains, losses or charges, net 3 |
| - | |
| (1 | ) |
| - | | |||
Non-GAAP adjusted operating income |
| $ | 683 | |
| $ | 633 | |
| $ | 541 | |
Non-GAAP adjusted operating margin |
| 26.4 | % |
| 25.9 | % |
| 25.6 | % | |||
|
|
|
|
|
|
| ||||||
Display and Adjacent Markets Non-GAAP Adjusted Operating Income |
|
|
|
|
|
| ||||||
Reported operating income - GAAP basis |
| $ | 245 | |
| $ | 191 | |
| $ | 202 | |
Certain items associated with acquisitions 1 |
| - | |
| 3 | |
| 4 | | |||
Non-GAAP adjusted operating income |
| $ | 245 | |
| $ | 194 | |
| $ | 206 | |
Non-GAAP adjusted operating margin |
| 20.3 | % |
| 20.6 | % |
| 24.3 | % | |||
1 | These items are incremental charges attributable to completed acquisitions, consisting of amortization of purchased intangible assets. |
|
|
2 | Results for fiscal 2015 included $3 million of inventory charges related to cost reduction in the solar business. |
|
|
3 | Results for fiscal 2015 included immaterial correction of errors related to prior periods, partially offset by costs related to executive termination. |
Note: The reconciliation of GAAP and non-GAAP adjusted segment results above does not include certain revenues, costs of products sold and operating expenses that are reported within corporate and other and included in consolidated operating income.
49
Table of Contents
Item 7A: | Quantitative and Qualitative Disclosures About Market Risk |
Applied is exposed to interest rate risk related to its investment portfolio and debt issuances. Applied's investment portfolio includes fixed-income securities with a fair value of approximately $1.1 billion at October 30, 2016 . These securities are subject to interest rate risk and will decline in value if interest rates increase. Based on Applied's investment portfolio at October 30, 2016 , an immediate 100 basis point increase in interest rates would result in a decrease in the fair value of the portfolio of approximately $16 million. While an increase in interest rates reduces the fair value of the investment portfolio, Applied will not realize the losses in the consolidated statement of operations unless the individual fixed-income securities are sold prior to recovery or the loss is determined to be other-than-temporary. At October 30, 2016 , the carrying amount of long-term debt issued by Applied was $3.1 billion with an estimated fair value of $3.5 billion . A hypothetical decrease in interest rates of 100 basis points would result in an increase in the fair value of Applied's long-term debt issuances of approximately $306 million at October 30, 2016 .
Certain operations of Applied are conducted in foreign currencies, such as Japanese yen, euro, Israeli shekel and Taiwanese dollar. Applied enters into currency forward exchange and option contracts to hedge a portion of, but not all, existing and anticipated foreign currency denominated transactions generally expected to occur within the next 24 months. Gains and losses on these contracts are generally recognized in income at the time that the related transactions being hedged are recognized. Because the effect of movements in currency exchange rates on currency forward exchange and option contracts generally offsets the related effect on the underlying items being hedged, these financial instruments are not expected to subject Applied to risks that would otherwise result from changes in currency exchange rates. Applied does not use derivative financial instruments for trading or speculative purposes.
Item 8: | Financial Statements and Supplementary Data |
The consolidated financial statements required by this Item are set forth on the pages indicated at Item 15(a).
Item 9: | Changes in and Disagreements with Accountants on Accounting and Financial Disclosure |
None.
50
Table of Contents
Item 9A: | Controls and Procedures |
Disclosure Controls and Procedures
As of the end of the period covered by this report, management of Applied conducted an evaluation, under the supervision and with the participation of Applied's Chief Executive Officer and Chief Financial Officer, of the effectiveness of Applied's disclosure controls and procedures, as such term is defined in Rule 13a-15(e) of the Securities Exchange Act of 1934 (the Exchange Act). Based upon that evaluation, Applied's Chief Executive Officer and Chief Financial Officer concluded that Applied's disclosure controls and procedures were effective as of the end of the period covered by this report in ensuring that information required to be disclosed was recorded, processed, summarized and reported within the time periods specified in the SEC's rules and forms, and to provide reasonable assurance that information required to be disclosed by Applied in such reports is accumulated and communicated to the Company's management, including its Chief Executive Officer and Chief Financial Officer, as appropriate to allow timely decisions regarding required disclosure.
Management's Report on Internal Control over Financial Reporting
Applied's management is responsible for establishing and maintaining adequate internal control over financial reporting, as such term is defined in Rule 13a-15(f) of the Exchange Act. Under the supervision and with the participation of Applied's Chief Executive Officer and Chief Financial Officer, management of Applied conducted an evaluation of the effectiveness of Applied's internal control over financial reporting based upon the framework in "Internal Control - Integrated Framework (2013)" issued by the Committee of Sponsoring Organizations of the Treadway Commission. Based on that evaluation, Applied's management concluded that Applied's internal control over financial reporting was effective as of October 30, 2016 .
KPMG LLP, an independent registered public accounting firm, has audited the consolidated financial statements included in this Form 10-K and, as part of the audit, has issued a report, included herein, on the effectiveness of Applied's internal control over financial reporting as of October 30, 2016 .
Changes in Internal Control over Financial Reporting
During the fourth quarter of fiscal 2016 , there were no changes in the internal control over financial reporting that materially affected, or are reasonably likely to materially affect, Applied's internal control over financial reporting.
Inherent Limitations of Disclosure Controls and Procedures and Internal Control over Financial Reporting
It should be noted that any system of controls, however well designed and operated, can provide only reasonable, and not absolute, assurance that the objectives of the system will be met. In addition, the design of any control system is based in part upon certain assumptions about the likelihood of future events.
Item 9B: | Other Information |
None
51
Table of Contents
PART III
Item 10: | Directors, Executive Officers and Corporate Governance |
Except for the information regarding executive officers required by Item 401 of Regulation S-K (which is included in Part I, Item 1 of this Annual Report on Form 10-K, under "Executive Officers of the Registrant") and code of ethics (which is set forth below), the information required by this item will be provided in accordance with Instruction G(3) to Form 10-K no later than February 27, 2017 .
Applied has implemented the Standards of Business Conduct, a code of ethics with which every person who works for Applied and every member of the Board of Directors is expected to comply. If any substantive amendments are made to the Standards of Business Conduct or any waiver is granted, including any implicit waiver, from a provision of the code to Applied's Chief Executive Officer, Chief Financial Officer or Chief Accounting Officer, Applied will disclose the nature of such amendment or waiver on its website or in a report on Form 8-K. The above information, including the Standards of Business Conduct, is available on Applied's website under the Corporate Governance section at http://www.appliedmaterials.com/investor-relations/governance. This website address is intended to be an inactive, textual reference only. None of the materials on, or accessible through, this website is part of this report or is incorporated by reference herein.
Item 11: | Executive Compensation |
The information required by this Item will be provided in accordance with Instruction G(3) to Form 10-K no later than February 27, 2017 .
52
Table of Contents
Item 12: | Security Ownership of Certain Beneficial Owners and Management and Related Stockholder Matters |
Except for the information regarding securities authorized for issuance under equity compensation plans (which is set forth below), the information required by this Item will be provided in accordance with Instruction G(3) to Form 10-K no later than February 27, 2017 .
The following table summarizes information with respect to equity awards under Applied's equity compensation plans as of October 30, 2016 :
Equity Compensation Plan Information
Plan Category | (a) Number of Securities to be Issued Upon Exercise of Outstanding Options, Warrants and Rights(1) |
|
| (b) Weighted Average Exercise Price of Outstanding Options, Warrants and Rights(2) |
| (c) Number of Securities Available for Future Issuance Under Equity Compensation Plans (Excluding Securities Reflected in Column(a)) |
| ||||
|
|
|
|
|
|
|
| ||||
| (In millions, except prices) |
| |||||||||
Equity compensation plans approved by security holders | 26 | |
|
| $ | 15.06 | |
| 124 | | (3) |
Equity compensation plans not approved by security holders | - | | (4) |
| $ | 6.82 | |
| 7 | | (5) |
Total | 26 | |
|
| $ | 14.87 | |
| 131 | |
|
(1) | Includes only options, restricted stock units and performance shares outstanding under Applied's equity compensation plans, as no stock warrants or other rights were outstanding as of October 30, 2016 . |
(2) | The weighted average exercise price calculation does not take into account any restricted stock units or performance shares as they have a de minimis purchase price. |
(3) | Includes 16 million shares of Applied common stock available for future issuance under the Applied Materials, Inc. Employees' Stock Purchase Plan. Of these 16 million shares, 1 million are subject to purchase during the purchase period in effect as of October 30, 2016 . |
(4) | Includes options to purchase 24 thousand shares of Applied common stock assumed through various mergers and acquisitions, after giving effect to the applicable exchange ratios. The assumed options had a weighted average exercise price of $6.82 per share. No further shares are available for issuance under the plans under which these assumed awards were granted. |
(5) | Includes 7 million shares of Applied common stock available for future issuance under the Applied Materials, Inc. Stock Purchase Plan for Offshore Employees. Of these 7 million shares, 1 million are subject to purchase during the purchase period in effect as of October 30, 2016 . |
Applied has the following equity compensation plans that have not been approved by stockholders:
Stock Purchase Plan for Offshore Employees. The Stock Purchase Plan for Offshore Employees (the Offshore ESPP) was adopted effective as of October 16, 1995 for the benefit of employees of Applied's participating affiliates. The Offshore ESPP provides for the grant of options to purchase shares of Applied common stock through payroll deductions pursuant to one or more offerings. The administrator of the Offshore ESPP (the Board of Directors of Applied or a committee appointed by the Board) determines the terms and conditions of all options prior to the start of an offering, including the purchase price of shares, the number of shares covered by the option and when the option may be exercised. All options granted as part of an offering must be granted on the same date. As of October 30, 2016 , a total of 36 million shares have been authorized for issuance under the Offshore ESPP, and 7 million shares remain available for issuance.
Applied Materials Profit Sharing Scheme. The Applied Materials Profit Sharing Scheme was adopted effective July 3, 1996 to enable employees of Applied Materials Ireland Limited and its participating subsidiaries to purchase Applied common stock at 100% of fair market value on the purchase date. Under this plan, eligible employees may elect to forego a certain portion of their base salary and certain bonuses they have earned and that otherwise would be payable in cash to purchase shares of Applied common stock at full fair market value. Since the eligible employees pay full fair market value for the shares, there is no reserved amount of shares under this plan and, accordingly, the table above does not include any set number of shares available for future issuance under the plan.
53
Table of Contents
Item 13: | Certain Relationships and Related Transactions, and Director Independence |
The information required by this Item will be provided in accordance with Instruction G(3) to Form 10-K no later than February 27, 2017 .
Item 14: | Principal Accounting Fees and Services |
The information required by this Item will be provided in accordance with Instruction G(3) to Form 10-K no later than February 27, 2017 .
54
Table of Contents
PART IV
Item 15: | Exhibits, Financial Statement Schedules |
(a) The following documents are filed as part of this Annual Report on Form 10-K:
|
| Page Number |
(1) | Financial Statements: |
|
|
|
|
| Reports of Independent Registered Public Accounting Firm | 56 |
|
|
|
| Consolidated Statements of Operations | 58 |
|
|
|
| Consolidated Statements of Comprehensive Income | 59 |
|
|
|
| Consolidated Balance Sheets | 60 |
|
|
|
| Consolidated Statements of Stockholders' Equity | 61 |
|
|
|
| Consolidated Statements of Cash Flows | 62 |
|
|
|
| Notes to Consolidated Financial Statements | 63 |
|
|
|
(2) | Exhibits: |
|
|
|
|
| The exhibits listed in the accompanying Index to Exhibits are filed or incorporated by reference as part of this Annual Report on Form 10-K | 101 |
|
|
|
All other schedules are omitted because they are not applicable or the required information is shown in the Consolidated Financial Statements or Notes thereto.
55
Table of Contents
REPORT OF INDEPENDENT REGISTERED PUBLIC ACCOUNTING FIRM
The Board of Directors and Stockholders
Applied Materials, Inc.:
We have audited the accompanying consolidated balance sheets of Applied Materials, Inc. and subsidiaries (the Company) as of October 30, 2016 and October 25, 2015 , and the related consolidated statements of operations, comprehensive income, stockholders' equity, and cash flows for each of the years in the three‑year period ended October 30, 2016 . These consolidated financial statements are the responsibility of the Company's management. Our responsibility is to express an opinion on these consolidated financial statements based on our audits.
We conducted our audits in accordance with the standards of the Public Company Accounting Oversight Board (United States). Those standards require that we plan and perform the audit to obtain reasonable assurance about whether the financial statements are free of material misstatement. An audit includes examining, on a test basis, evidence supporting the amounts and disclosures in the financial statements. An audit also includes assessing the accounting principles used and significant estimates made by management, as well as evaluating the overall financial statement presentation. We believe that our audits provide a reasonable basis for our opinion.
In our opinion, the consolidated financial statements referred to above present fairly, in all material respects, the financial position of Applied Materials, Inc. and subsidiaries as of October 30, 2016 and October 25, 2015 , and the results of their operations and their cash flows for each of the years in the three-year period ended October 30, 2016 , in conformity with U.S. generally accepted accounting principles.
We also have audited, in accordance with the standards of the Public Company Accounting Oversight Board (United States), Applied Materials, Inc.'s internal control over financial reporting as of October 30, 2016 based on criteria established in Internal Control - Integrated Framework (2013) issued by the Committee of Sponsoring Organizations of the Treadway Commission (COSO), and our report dated December 15, 2016 expressed an unqualified opinion on the effectiveness of the Company's internal control over financial reporting.
/ S / KPMG LLP |
KPMG LLP |
Santa Clara, California
December 15, 2016
56
Table of Contents
REPORT OF INDEPENDENT REGISTERED PUBLIC ACCOUNTING FIRM
The Board of Directors and Stockholders
Applied Materials, Inc.:
We have audited Applied Materials, Inc.'s (the Company) internal control over financial reporting as of October 30, 2016 , based on criteria established in Internal Control - Integrated Framework (2013) issued by the Committee of Sponsoring Organizations of the Treadway Commission (COSO). The Company's management is responsible for maintaining effective internal control over financial reporting and for its assessment of the effectiveness of internal control over financial reporting, included in the accompanying Management's Report on Internal Control over Financial Reporting in Item 9A. Our responsibility is to express an opinion on the Company's internal control over financial reporting based on our audit.
We conducted our audit in accordance with the standards of the Public Company Accounting Oversight Board (United States). Those standards require that we plan and perform the audit to obtain reasonable assurance about whether effective internal control over financial reporting was maintained in all material respects. Our audit included obtaining an understanding of internal control over financial reporting, assessing the risk that a material weakness exists, and testing and evaluating the design and operating effectiveness of internal control based on the assessed risk. Our audit also included performing such other procedures as we considered necessary in the circumstances. We believe that our audit provides a reasonable basis for our opinion.
A company's internal control over financial reporting is a process designed to provide reasonable assurance regarding the reliability of financial reporting and the preparation of financial statements for external purposes in accordance with generally accepted accounting principles. A company's internal control over financial reporting includes those policies and procedures that (1) pertain to the maintenance of records that, in reasonable detail, accurately and fairly reflect the transactions and dispositions of the assets of the company; (2) provide reasonable assurance that transactions are recorded as necessary to permit preparation of financial statements in accordance with generally accepted accounting principles, and that receipts and expenditures of the company are being made only in accordance with authorizations of management and directors of the company; and (3) provide reasonable assurance regarding prevention or timely detection of unauthorized acquisition, use, or disposition of the company's assets that could have a material effect on the financial statements.
Because of its inherent limitations, internal control over financial reporting may not prevent or detect misstatements. Also, projections of any evaluation of effectiveness to future periods are subject to the risk that controls may become inadequate because of changes in conditions, or that the degree of compliance with the policies or procedures may deteriorate.
In our opinion, Applied Materials, Inc. maintained, in all material respects, effective internal control over financial reporting as of October 30, 2016 , based on criteria established in Internal Control - Integrated Framework (2013) issued by the Committee of Sponsoring Organizations of the Treadway Commission (COSO).
We also have audited, in accordance with the standards of the Public Company Accounting Oversight Board (United States), the consolidated balance sheets of Applied Materials, Inc. and subsidiaries as of October 30, 2016 and October 25, 2015 , and the related consolidated statements of operations, comprehensive income, stockholders' equity, and cash flows for each of the years in the three-year period ended October 30, 2016 , and our report dated December 15, 2016 expressed an unqualified opinion on those consolidated financial statements.
/s/ KPMG LLP |
KPMG LLP |
Santa Clara, California
December 15, 2016
57
Table of Contents
APPLIED MATERIALS, INC.
CONSOLIDATED STATEMENTS OF OPERATIONS
(In millions, except per share amounts)
Fiscal Year | 2016 |
| 2015 |
| 2014 | ||||||
|
|
|
|
|
| ||||||
Net sales | $ | 10,825 | |
| $ | 9,659 | |
| $ | 9,072 | |
Cost of products sold | 6,314 | |
| 5,707 | |
| 5,229 | | |||
Gross profit | 4,511 | |
| 3,952 | |
| 3,843 | | |||
Operating expenses: |
|
|
|
|
| ||||||
Research, development and engineering | 1,540 | |
| 1,451 | |
| 1,428 | | |||
Marketing and selling | 429 | |
| 428 | |
| 423 | | |||
General and administrative | 390 | |
| 469 | |
| 502 | | |||
Gain on derivatives associated with terminated business combination | - | |
| (89 | ) |
| (30 | ) | |||
Total operating expenses | 2,359 | |
| 2,259 | |
| 2,323 | | |||
Income from operations | 2,152 | |
| 1,693 | |
| 1,520 | | |||
Interest expense | 155 | |
| 103 | |
| 95 | | |||
Interest and other income, net | 16 | |
| 8 | |
| 23 | | |||
Income before income taxes | 2,013 | |
| 1,598 | |
| 1,448 | | |||
Provision for income taxes | 292 | |
| 221 | |
| 376 | | |||
Net income | $ | 1,721 | |
| $ | 1,377 | |
| $ | 1,072 | |
Earnings per share: |
|
|
|
|
| ||||||
Basic | $ | 1.56 | |
| $ | 1.13 | |
| $ | 0.88 | |
Diluted | $ | 1.54 | |
| $ | 1.12 | |
| $ | 0.87 | |
Weighted average number of shares: |
|
|
|
|
| ||||||
Basic | 1,107 | |
| 1,214 | |
| 1,215 | | |||
Diluted | 1,116 | |
| 1,226 | |
| 1,231 | | |||
See accompanying Notes to Consolidated Financial Statements.
58
Table of Contents
APPLIED MATERIALS, INC.
CONSOLIDATED STATEMENTS OF COMPREHENSIVE INCOME
(In millions)
Fiscal Year | 2016 |
| 2015 |
| 2014 | ||||||
|
|
|
|
|
| ||||||
Net income | $ | 1,721 | |
| $ | 1,377 | |
| $ | 1,072 | |
Other comprehensive income (loss), net of tax: |
|
|
|
|
| ||||||
Change in unrealized net gain on investments | 16 | |
| (10 | ) |
| (1 | ) | |||
Change in unrealized net loss on derivative instruments | (3 | ) |
| (15 | ) |
| (2 | ) | |||
Change in defined and postretirement benefit plans | (36 | ) |
| - | |
| (33 | ) | |||
Change in cumulative translation adjustments | - | |
| 9 | |
| (2 | ) | |||
Other comprehensive income (loss), net of tax | (23 | ) |
| (16 | ) |
| (38 | ) | |||
Comprehensive income | $ | 1,698 | |
| $ | 1,361 | |
| $ | 1,034 | |
See accompanying Notes to Consolidated Financial Statements.
59
Table of Contents
APPLIED MATERIALS, INC.
CONSOLIDATED BALANCE SHEETS
(In millions, except per share amounts)
| October 30, |
| October 25, | ||||
|
|
|
| ||||
ASSETS | |||||||
Current assets: |
|
|
| ||||
Cash and cash equivalents | $ | 3,406 | |
| $ | 4,797 | |
Short-term investments | 343 | |
| 168 | | ||
Accounts receivable, net | 2,279 | |
| 1,739 | | ||
Inventories | 2,050 | |
| 1,833 | | ||
Other current assets | 275 | |
| 724 | | ||
Total current assets | 8,353 | |
| 9,261 | | ||
Long-term investments | 929 | |
| 946 | | ||
Property, plant and equipment, net | 937 | |
| 892 | | ||
Goodwill | 3,316 | |
| 3,302 | | ||
Purchased technology and other intangible assets, net | 575 | |
| 762 | | ||
Deferred income taxes and other assets | 478 | |
| 145 | | ||
Total assets | $ | 14,588 | |
| $ | 15,308 | |
|
|
|
| ||||
LIABILITIES AND STOCKHOLDERS' EQUITY | |||||||
Current liabilities: |
|
|
| ||||
Short-term debt | $ | 200 | |
| $ | 1,200 | |
Accounts payable and accrued expenses | 2,056 | |
| 1,833 | | ||
Customer deposits and deferred revenue | 1,376 | |
| 765 | | ||
Total current liabilities | 3,632 | |
| 3,798 | | ||
Long-term debt | 3,143 | |
| 3,342 | | ||
Other liabilities | 596 | |
| 555 | | ||
Total liabilities | 7,371 | |
| 7,695 | | ||
Commitments and contingencies (Note 13) | |
| | ||||
Stockholders' equity: |
|
|
| ||||
Preferred stock: $.01 par value per share; 1 shares authorized; no shares issued | - | |
| - | | ||
Common stock: $.01 par value per share; 2,500 shares authorized; 1,078 and 1,160 shares outstanding at 2016 and 2015, respectively | 11 | |
| 11 | | ||
Additional paid-in capital | 6,809 | |
| 6,575 | | ||
Retained earnings | 15,252 | |
| 13,967 | | ||
Treasury stock: 889 and 793 shares at 2016 and 2015, respectively | (14,740 | ) |
| (12,848 | ) | ||
Accumulated other comprehensive loss | (115 | ) |
| (92 | ) | ||
Total stockholders' equity | 7,217 | |
| 7,613 | | ||
Total liabilities and stockholders' equity | $ | 14,588 | |
| $ | 15,308 | |
See accompanying Notes to Consolidated Financial Statements.
60
Table of Contents
APPLIED MATERIALS, INC.
CONSOLIDATED STATEMENTS OF STOCKHOLDERS' EQUITY
(In millions)
| Common Stock |
| Additional Paid-In Capital |
| Retained Earnings |
| Treasury Stock |
| Accumulated Other Comprehensive Income (Loss) |
| Total | ||||||||||||||||||
| Shares |
| Amount |
|
|
| Shares |
| Amount |
|
| ||||||||||||||||||
|
|
|
|
|
|
|
|
|
|
|
|
|
|
|
| ||||||||||||||
Balance at October 27, 2013 | 1,204 | |
| $ | 12 | |
| $ | 6,151 | |
| $ | 12,487 | |
| 717 | |
| $ | (11,524 | ) |
| $ | (38 | ) |
| $ | 7,088 | |
Net income | - | |
| - | |
| - | |
| 1,072 | |
| - | |
| - | |
| - | |
| 1,072 | | ||||||
Other comprehensive loss, net of tax | - | |
| - | |
| - | |
| - | |
| - | |
| - | |
| (38 | ) |
| (38 | ) | ||||||
Dividends | - | |
| - | |
| - | |
| (487 | ) |
| - | |
| - | |
| - | |
| (487 | ) | ||||||
Share-based compensation | - | |
| - | |
| 177 | |
| - | |
| - | |
| - | |
| - | |
| 177 | | ||||||
Issuance under stock plans, net of a tax benefit of $27 and other | 17 | |
| - | |
| 56 | |
| - | |
| - | |
| - | |
| - | |
| 56 | | ||||||
Balance at October 26, 2014 | 1,221 | |
| $ | 12 | |
| $ | 6,384 | |
| $ | 13,072 | |
| 717 | |
| $ | (11,524 | ) |
| $ | (76 | ) |
| $ | 7,868 | |
Net income | - | |
| - | |
| - | |
| 1,377 | |
| - | |
| - | |
| - | |
| 1,377 | | ||||||
Other comprehensive loss, net of tax | - | |
| - | |
| - | |
| - | |
| - | |
| - | |
| (16 | ) |
| (16 | ) | ||||||
Dividends | - | |
| - | |
| - | |
| (482 | ) |
| - | |
| - | |
| - | |
| (482 | ) | ||||||
Share-based compensation | - | |
| - | |
| 187 | |
| - | |
| - | |
| - | |
| - | |
| 187 | | ||||||
Issuance under stock plans, net of a tax benefit of $55 and other | 15 | |
| - | |
| 4 | |
| - | |
| - | |
| - | |
| - | |
| 4 | | ||||||
Common stock repurchases | (76 | ) |
| (1 | ) |
| - | |
| - | |
| 76 | |
| (1,324 | ) |
| - | |
| (1,325 | ) | ||||||
Balance at October 25, 2015 | 1,160 | |
| $ | 11 | |
| $ | 6,575 | |
| $ | 13,967 | |
| 793 | |
| $ | (12,848 | ) |
| $ | (92 | ) |
| $ | 7,613 | |
Net income | - | |
| - | |
| - | |
| 1,721 | |
| - | |
| - | |
| - | |
| 1,721 | | ||||||
Other comprehensive loss, net of tax | - | |
| - | |
| - | |
| - | |
| - | |
| - | |
| (23 | ) |
| (23 | ) | ||||||
Dividends | - | |
| - | |
| - | |
| (436 | ) |
| - | |
| - | |
| - | |
| (436 | ) | ||||||
Share-based compensation | - | |
| - | |
| 201 | |
| - | |
| - | |
| - | |
| - | |
| 201 | | ||||||
Issuance under stock plans, net of a tax benefit of $23 and other | 14 | |
| - | |
| 33 | |
| - | |
| - | |
| - | |
| - | |
| 33 | | ||||||
Common stock repurchases | (96 | ) |
| - | |
| - | |
| - | |
| 96 | |
| (1,892 | ) |
| - | |
| (1,892 | ) | ||||||
Balance at October 30, 2016 | 1,078 | |
| $ | 11 | |
| $ | 6,809 | |
| $ | 15,252 | |
| 889 | |
| $ | (14,740 | ) |
| $ | (115 | ) |
| $ | 7,217 | |
See accompanying Notes to Consolidated Financial Statements.
61
Table of Contents
APPLIED MATERIALS, INC.
CONSOLIDATED STATEMENTS OF CASH FLOWS
(In millions)
Fiscal Year | 2016 |
| 2015 |
| 2014 | ||||||
|
|
|
|
|
| ||||||
Cash flows from operating activities: |
|
|
|
|
| ||||||
Net income | $ | 1,721 | |
| $ | 1,377 | |
| $ | 1,072 | |
Adjustments required to reconcile net income to cash provided by operating activities: |
|
|
|
|
| ||||||
Depreciation and amortization | 389 | |
| 371 | |
| 375 | | |||
Excess tax benefits from share-based compensation | (23 | ) |
| (56 | ) |
| (30 | ) | |||
Deferred income taxes | 21 | |
| (134 | ) |
| 58 | | |||
Other | 38 | |
| 53 | |
| 13 | | |||
Share-based compensation | 201 | |
| 187 | |
| 177 | | |||
Changes in operating assets and liabilities, net of amounts acquired: |
|
|
|
|
| ||||||
Accounts receivable | (542 | ) |
| (61 | ) |
| (21 | ) | |||
Inventories | (216 | ) |
| (266 | ) |
| (154 | ) | |||
Other current and non-current assets | 30 | |
| 26 | |
| 26 | | |||
Accounts payable and accrued expenses | 107 | |
| (133 | ) |
| 79 | | |||
Customer deposits and deferred revenue | 611 | |
| (175 | ) |
| 146 | | |||
Income taxes payable | 173 | |
| (24 | ) |
| 142 | | |||
Other liabilities | (44 | ) |
| (2 | ) |
| (83 | ) | |||
Cash provided by operating activities | 2,466 | |
| 1,163 | |
| 1,800 | | |||
Cash flows from investing activities: |
|
|
|
|
| ||||||
Capital expenditures | (253 | ) |
| (215 | ) |
| (241 | ) | |||
Cash paid for acquisitions, net of cash acquired | (16 | ) |
| (4 | ) |
| (12 | ) | |||
Proceeds from sale of facilities | - | |
| - | |
| 25 | | |||
Proceeds from sales and maturities of investments | 1,234 | |
| 1,100 | |
| 878 | | |||
Purchases of investments | (1,390 | ) |
| (1,162 | ) |
| (811 | ) | |||
Cash used in investing activities | (425 | ) |
| (281 | ) |
| (161 | ) | |||
Cash flows from financing activities: |
|
|
|
|
| ||||||
Debt borrowings (repayments), net of issuance costs | (1,207 | ) |
| 2,581 | |
| - | | |||
Proceeds from common stock issuances and others, net | 88 | |
| 88 | |
| 107 | | |||
Common stock repurchases | (1,892 | ) |
| (1,325 | ) |
| - | | |||
Payments of dividends to stockholders | (444 | ) |
| (487 | ) |
| (485 | ) | |||
Excess tax benefits from share-based compensation | 23 | |
| 56 | |
| 30 | | |||
Cash provided by (used in) financing activities | (3,432 | ) |
| 913 | |
| (348 | ) | |||
Increase (decrease) in cash and cash equivalents | (1,391 | ) |
| 1,795 | |
| 1,291 | | |||
Cash and cash equivalents - beginning of year | 4,797 | |
| 3,002 | |
| 1,711 | | |||
Cash and cash equivalents - end of year | $ | 3,406 | |
| $ | 4,797 | |
| $ | 3,002 | |
Supplemental cash flow information: |
|
|
|
|
| ||||||
Cash payments for income taxes | $ | 157 | |
| $ | 407 | |
| $ | 195 | |
Cash refunds from income taxes | $ | 113 | |
| $ | 12 | |
| $ | 111 | |
Cash payments for interest | $ | 151 | |
| $ | 92 | |
| $ | 92 | |
See accompanying Notes to Consolidated Financial Statements.
62
Table of Contents
APPLIED MATERIALS, INC.
NOTES TO CONSOLIDATED FINANCIAL STATEMENTS
Note 1 | Summary of Significant Accounting Policies |
Principles of Consolidation and Basis of Presentation
The consolidated financial statements include the accounts of Applied Materials, Inc. and its subsidiaries (Applied or the Company) after elimination of intercompany balances and transactions. All references to a fiscal year apply to Applied's fiscal year which ends on the last Sunday in October. Fiscal 2016, 2015 and 2014 contained 53, 52, and 52 weeks, respectively. The first fiscal quarter of 2016 contained 14 weeks, while the second, third and fourth quarters of fiscal 2016 contained 13 weeks. Each fiscal quarter of 2015 and 2014 contained 13 weeks.
Effective in the third quarter of fiscal 2016, Applied began to account for its flexible coating systems (previously included in the Energy and Environmental Solutions segment) and display upgrade equipment (previously included in the Applied Global Services segment) under the Display and Adjacent Markets segment (previously Display). As a result of these changes, Applied's solar business (previously included in the Energy and Environmental Solutions segment) is included in Corporate and Other as it did not meet the threshold for a separate reportable segment. Results for prior periods have been recast to conform to the current presentation. As of October 30, 2016 , Applied's three primary reportable segments are: Semiconductor Systems (previously Silicon Systems), Applied Global Services and Display and Adjacent Markets. See Note 14 of Notes to the Consolidated Financial Statements for further detail on reportable segments.
Certain prior year amounts have been reclassified to conform to current year presentation.
Use of Estimates
The preparation of financial statements in conformity with accounting principles generally accepted in the United States of America requires management to make judgments, estimates and assumptions that affect the amounts reported in the financial statements and accompanying notes. Actual results could differ materially from those estimates. On an ongoing basis, Applied evaluates its estimates, including those related to accounts receivable and sales allowances, fair values of financial instruments, inventories, intangible assets and goodwill, useful lives of intangible assets and property and equipment, fair values of share-based awards, and income taxes, among others. Applied bases its estimates on historical experience and on various other assumptions that are believed to be reasonable, the results of which form the basis for making judgments about the carrying values of assets and liabilities.
Cash Equivalents
All highly-liquid investments with a remaining maturity of three months or less at the time of purchase are considered to be cash equivalents. Cash equivalents consist primarily of investments in institutional money market funds.
Investments
All of Applied's investments, except equity investments held in privately-held companies, are classified as available-for-sale at the respective balance sheet dates. Investments classified as available-for-sale are recorded at fair value based upon quoted market prices, and any temporary difference between the cost and fair value of an investment is presented as a separate component of accumulated other comprehensive income (loss). The specific identification method is used to determine the gains and losses on investments. Interest earned on cash and investments, as well as realized gains and losses on sale of securities, are included in interest and other income, net in the accompanying Consolidated Statements of Operations.
Equity investments in privately-held companies are generally accounted for under the cost method of accounting and are periodically assessed for other-than-temporary impairment when an event or circumstance indicates that an other-than-temporary decline in value may have occurred.
Allowance for Doubtful Accounts
Applied maintains an allowance for doubtful accounts for estimated losses resulting from the inability of its customers to make required payments. This allowance is based on historical experience, credit evaluations, specific customer collection history and any customer-specific issues Applied has identified. Changes in circumstances, such as an unexpected material adverse change in a major customer's ability to meet its financial obligation to Applied or its payment trends, may require Applied to further adjust its estimates of the recoverability of amounts due to Applied. Bad debt expense and any reversals are recorded in marketing and selling expenses in the Consolidated Statement of Operations.
63
Table of Contents
APPLIED MATERIALS, INC.
NOTES TO CONSOLIDATED FINANCIAL STATEMENTS - (Continued)
Inventories
Inventories are stated at the lower of cost or market, with cost determined on a first-in, first-out (FIFO) basis. Applied adjusts inventory carrying value for estimated obsolescence equal to the difference between the cost of inventory and the estimated market value based upon assumptions about future demand and market conditions. Applied fully writes down inventories and noncancelable purchase orders for inventory deemed obsolete. Applied performs periodic reviews of inventory items to identify excess inventories on hand by comparing on-hand balances to anticipated usage using recent historical activity as well as anticipated or forecasted demand. If estimates of customer demand diminish further or market conditions become less favorable than those projected by Applied, additional inventory adjustments may be required.
Property, Plant and Equipment
Property, plant and equipment is stated at cost. Depreciation is provided over the estimated useful lives of the assets using the straight-line method. Estimated useful lives for financial reporting purposes are as follows: buildings and improvements, 3 to 30 years; demonstration and manufacturing equipment, 3 to 5 years; software, 3 to 5 years; and furniture, fixtures and other equipment, 3 to 15 years. Land improvements are amortized over the shorter of 15 years or the estimated useful life. Leasehold improvements are amortized over the shorter of five years or the lease term.
Intangible Assets
Goodwill and indefinite-lived assets are not amortized, but are reviewed for impairment annually during the fourth quarter of each fiscal year and whenever events or changes in circumstances indicate that the carrying value of an asset may not be recoverable. Purchased technology and other intangible assets are presented at cost, net of accumulated amortization, and are amortized over their estimated useful lives of 1 to 15 years using the straight-line method.
Long-Lived Assets
Applied reviews long-lived assets for impairment whenever events or changes in circumstances indicate that the carrying amount of these assets or asset group may not be recoverable. Applied assesses these assets for impairment based on estimated future cash flows from these assets.
Research, Development and Engineering Costs
Research, development and engineering costs are expensed as incurred.
Sales and Value Added Taxes
Taxes collected from customers and remitted to governmental authorities are presented on a net basis in the accompanying Consolidated Statements of Operations.
Warranty
Applied provides for the estimated cost of warranty when revenue is recognized. Estimated warranty costs are determined by analyzing specific product, current and historical configuration statistics and regional warranty support costs. Applied's warranty obligation is affected by product and component failure rates, material usage and labor costs incurred in correcting product failures during the warranty period. If actual warranty costs differ substantially from Applied's estimates, revisions to the estimated warranty liability would be required.
Income Taxes
Applied recognizes a current tax liability for the estimated amount of income tax payable on tax returns for the current fiscal year. Deferred tax assets and liabilities are recognized for the estimated future tax effects of temporary differences between the book and tax bases of assets and liabilities. Deferred tax assets are also recognized for net operating loss and tax credit carryovers. Deferred tax assets are offset by a valuation allowance to the extent it is more likely than not that they are not expected to be realized.
Applied recognizes tax benefits from uncertain tax positions only if it is more likely than not that the tax position will be sustained upon examination by the taxing authorities, based on the technical merits of the position. The tax benefits recognized from such positions are estimated based on the largest benefit that has a greater than 50% likelihood of being realized upon ultimate settlement. Any changes in judgment related to uncertain tax positions are recognized in the Consolidated Statement of Operations in the quarter in which such change occurs. Interest and penalties related to uncertain tax positions are recognized in Applied's provision for income taxes.
64
Table of Contents
APPLIED MATERIALS, INC.
NOTES TO CONSOLIDATED FINANCIAL STATEMENTS - (Continued)
Restructuring
From time to time, Applied initiates restructuring activities to appropriately align its cost structure relative to prevailing economic and industry conditions and associated customer demand as well as in connection with certain acquisitions. Costs associated with restructuring actions can include termination benefits and related charges in addition to facility closure, contract termination and other related activities. Costs associated with restructuring activities were not material in all fiscal years presented and are included in general and administrative expenses in the Consolidated Statements of Operations.
Revenue Recognition
Applied recognizes revenue when all four revenue recognition criteria have been met: persuasive evidence of an arrangement exists; delivery has occurred or services have been rendered; seller's price to buyer is fixed or determinable; and collectability is probable. Applied's shipping terms are customarily FOB Applied shipping point or equivalent terms. Applied's revenue recognition policy generally results in revenue recognition at the following points: (1) for all transactions where legal title passes to the customer upon shipment or delivery, Applied recognizes revenue upon passage of title for all products that have been demonstrated to meet product specifications prior to shipment; the portion of revenue associated with certain installation-related tasks is deferred, and that revenue is recognized upon completion of the installation-related tasks; (2) for products that have not been demonstrated to meet product specifications prior to shipment, revenue is recognized at customer technical acceptance; (3) for transactions where legal title does not pass at shipment or delivery, revenue is recognized when legal title passes to the customer, which is generally at customer technical acceptance; and (4) for arrangements containing multiple elements, the revenue relating to the undelivered elements is deferred using the relative selling price method utilizing estimated sales prices until delivery of the deferred elements. Applied limits the amount of revenue recognition for delivered elements to the amount that is not contingent on the future delivery of products or services, future performance obligations or subject to customer-specified return or adjustment. In cases where Applied has sold products that have been demonstrated to meet product specifications prior to shipment, Applied believes that at the time of delivery, it has an enforceable claim to amounts recognized as revenue. Spare parts revenue is generally recognized upon shipment, and services revenue is generally recognized over the period that the services are provided.
When a sales arrangement contains multiple elements, such as hardware and services and/or software products, Applied allocates revenue to each element based on a selling price hierarchy. The selling price for a deliverable is based on its vendor specific objective evidence (VSOE) if available, third party evidence (TPE) if VSOE is not available, or estimated selling price (ESP) if neither VSOE nor TPE is available. Applied generally utilizes the ESP due to the nature of its products. In multiple element arrangements where more-than-incidental software deliverables are included, revenue is allocated to each separate unit of accounting for each of the non-software deliverables and to the software deliverables as a group using the relative selling prices of each of the deliverables in the arrangement based on the aforementioned selling price hierarchy. If the arrangement contains more than one software deliverable, the arrangement consideration allocated to the software deliverables as a group is then allocated to each software deliverable using the guidance for recognizing software revenue.
Derivative Financial Instruments
Applied uses financial instruments, such as forward exchange and currency option contracts, to hedge a portion of, but not all, existing and anticipated foreign currency denominated transactions typically expected to occur within 24 months. The purpose of Applied's foreign currency management is to mitigate the effect of exchange rate fluctuations on certain foreign currency denominated revenues, costs and eventual cash flows. In certain cases, Applied also uses interest rate swap agreements to hedge against the variability of cash flows due to changes in the benchmark interest rate of fixed rate debt. The terms of derivative financial instruments used for hedging purposes are generally consistent with the timing of the transactions being hedged. All of Applied's derivative financial instruments are recorded at fair value based upon quoted market prices for comparable instruments. For derivative instruments designated and qualifying as cash flow hedges, the effective portion of the gain or loss on these hedges is reported as a component of accumulated other comprehensive income (loss) in stockholders' equity, and is reclassified into earnings when the hedged transaction affects earnings. If the transaction being hedged fails to occur, or if a portion of any derivative is ineffective, the gain or loss on the associated financial instrument is recorded promptly in earnings. For derivative instruments used to hedge existing foreign currency denominated assets or liabilities, the gain or loss on these hedges is recorded promptly in earnings to offset the changes in the fair value of the assets or liabilities being hedged. Applied does not use derivative financial instruments for trading or speculative purposes.
65
Table of Contents
APPLIED MATERIALS, INC.
NOTES TO CONSOLIDATED FINANCIAL STATEMENTS - (Continued)
Foreign Currencies
As of October 30, 2016 , all of Applied's subsidiaries use the United States dollar as their functional currency. Accordingly, assets and liabilities of these subsidiaries are remeasured using exchange rates in effect at the end of the period, except for non-monetary assets, such as inventories and property, plant and equipment, which are remeasured using historical exchange rates. Foreign currency-denominated revenues and costs are remeasured using average exchange rates for the period, except for costs related to those balance sheet items that are remeasured using historical exchange rates. The resulting remeasurement gains and losses are included in general and administrative expenses in the Consolidated Statements of Operations as incurred.
Concentrations of Credit Risk
Financial instruments that potentially subject Applied to significant concentrations of credit risk consist principally of cash equivalents, investments, trade accounts receivable and derivative financial instruments used in hedging activities. Applied invests in a variety of financial instruments, such as, but not limited to, certificates of deposit, corporate and municipal bonds, United States Treasury and agency securities, and asset-backed and mortgage-backed securities, and, by policy, limits the amount of credit exposure with any one financial institution or commercial issuer. Applied performs ongoing credit evaluations of its customers' financial condition and generally requires no collateral to secure accounts receivable. Applied maintains an allowance reserve for potentially uncollectible accounts receivable based on its assessment of the collectability of accounts receivable. Applied regularly reviews the allowance by considering factors such as historical experience, credit quality, age of the accounts receivable balances, and current economic conditions that may affect a customer's ability to pay. In addition, Applied utilizes letters of credit to mitigate credit risk when considered appropriate. Applied is exposed to credit-related losses in the event of nonperformance by counterparties to derivative financial instruments, but does not expect any counterparties to fail to meet their obligations. In some instances, Applied has entered into security arrangements which require the counterparties to post collateral to further mitigate credit exposure.
Recent Accounting Pronouncements
In August of 2016, the Financial Accounting Standards Board (FASB) issued authoritative guidance which addresses classification of certain cash receipts and cash payments related to the statement of cash flows. The authoritative guidance will be effective for Applied in the first quarter of fiscal 2019. The adoption of this guidance is not expected to have a significant impact on Applied's consolidated financial statements.
In June 2016, the FASB issued authoritative guidance that modifies the impairment model for certain financial assets by requiring use of an expected loss methodology, which will result in more timely recognition of credit losses. The authoritative guidance will be effective for Applied in the first quarter of fiscal 2021. Early adoption is permitted beginning in the first quarter of fiscal 2020. Applied is currently evaluating the effect of this new guidance on Applied's consolidated financial statements.
In March 2016, the FASB issued authoritative guidance that simplifies several aspects of the accounting for share-based payment transactions, including the income tax consequences, forfeitures, classification of awards as either equity or liabilities, and classification on the statement of cash flows. Applied plans to adopt the authoritative guidance effective in the first quarter of fiscal 2018. Upon adoption, Applied has elected to continue to estimate forfeitures expected to occur to determine the amount of compensation cost to be recognized in each period. The new standard will result in the recognition of excess tax benefits in provision for income taxes rather than paid-in capital prospectively, which is expected to increase volatility in Applied's results of operations. Applied also elected to apply the presentation requirements for cash flows related to excess tax benefits retrospectively. The presentation requirements for cash flows related to employee taxes paid for withheld shares will be presented as a financing activity retrospectively, as required. Applied expects cash flow from operations to increase, with a corresponding decrease in cash flow from financing activity as a result of the changes in the cash flow presentation.
In February 2016, the FASB issued authoritative guidance for lease accounting, which requires lessees to recognize lease assets and liabilities on the balance sheet for certain lease arrangements that are classified as operating leases under the previous standard, and to provide for enhanced disclosures. The authoritative guidance will be effective for Applied in the first quarter of fiscal 2020 and should be applied using a modified retrospective approach. Early adoption is permitted. Applied is currently evaluating the effect of this new guidance on Applied's consolidated financial statements.
In January 2016, the FASB issued authoritative guidance that requires equity investments that do not result in consolidation, and are not accounted for under the equity method, to be measured at fair value, and requires recognition of any changes in fair value in net income unless the investments qualify for a new practicability exception. For financial liabilities measured at fair value, the change in fair value caused by a change in instrument-specific credit risk will be required to be presented separately in other comprehensive income. The authoritative guidance will be effective for Applied in the first quarter of fiscal 2019. Early adoption is permitted only for the provisions related to the recognition of changes in fair value of financial liabilities caused by instrument-specific credit risk. Applied is currently evaluating the effect of this new guidance on Applied's consolidated financial statements.
66
Table of Contents
APPLIED MATERIALS, INC.
NOTES TO CONSOLIDATED FINANCIAL STATEMENTS - (Continued)
In November 2015, the FASB issued authoritative guidance requiring all deferred tax assets and liabilities, and any related valuation allowance, to be classified as noncurrent on the balance sheet. Applied elected to prospectively adopt the authoritative guidance in the beginning of the first quarter of fiscal 2016. Prior periods were not retrospectively adjusted.
In July 2015, the FASB issued authoritative guidance that requires inventory to be measured at the lower of cost and net realizable value instead of at lower of cost or market. This guidance does not apply to inventory that is measured using last-in, first out (LIFO) or the retail inventory method but applies to all other inventory including those measured using first-in, first-out (FIFO) or the average cost method. The authoritative guidance will be effective for Applied in the first quarter of fiscal 2018 and should be applied prospectively. Early adoption is permitted as of the beginning of an interim or annual reporting period. Applied is currently evaluating the effect of this new guidance on Applied's consolidated financial statements.
In May 2015, the FASB issued authoritative guidance to remove the requirement to categorize within the fair value hierarchy all investments for which fair value is measured using the net asset value per share practical expedient. The new guidance also removes the requirement of certain disclosures for all investments that are eligible to be measured at fair value using the net asset value per share practical expedient. The guidance becomes effective retrospectively for Applied in the first quarter of fiscal 2017. Early adoption is permitted. The adoption of this guidance will only impact disclosures in Applied's financial statements.
In April 2015, the FASB issued authoritative guidance for customers about whether a cloud computing arrangement includes a software license. If a cloud computing arrangement includes a software license, then the customer should account for the software license element of the arrangement consistent with the acquisition of other software licenses. If a cloud computing arrangement does not include a software license, the customer should account for the arrangement as a service contract. This guidance will not change accounting for service contracts. Applied will adopt this guidance in the first quarter of fiscal 2017 prospectively to all arrangements entered into or materially modified after the effective date. The adoption of this guidance is not expected to have a significant impact on Applied's consolidated financial statements.
In April 2015, the FASB issued authoritative guidance that requires debt issuance costs to be presented in the balance sheet as a direct deduction from the carrying amount of the related debt liability, consistent with debt discounts. Applied plans to adopt the authoritative guidance effective in the first quarter of fiscal 2017 and it will be applied retrospectively. The adoption of this guidance is not expected to have a significant impact on Applied's consolidated financial statements.
In May 2014, the FASB issued authoritative guidance that requires revenue recognition to depict the transfer of promised goods or services to a customer in an amount that reflects the consideration to which the entity expects to be entitled in exchange for those goods or services. This new standard will supersede most current revenue recognition guidance, including industry-specific guidance. Entities will have the option of using either a full retrospective or modified retrospective approach to adopting the guidance. Under the modified approach, an entity would recognize the cumulative effect of initially applying the guidance with an adjustment to the opening balance of retained earnings in the period of adoption. In addition, the modified approach will require additional disclosures. In August 2015, the FASB issued an amendment to defer the effective date by one year and allow entities to early adopt no earlier than the original effective date. With this amendment, the guidance will be effective for Applied in the first quarter of fiscal 2019, which is the Company's planned adoption date. In fiscal 2016, Applied established a project steering committee and cross-functional implementation team to identify potential differences that would result from applying the requirements of the new standard to Applied's revenue contracts. In addition, the implementation team is also responsible for identifying and implementing changes to business processes, systems and controls to support recognition and disclosure under the new standard. Applied is continuing to evaluate the effect of this new guidance on Applied's financial position, results of operations and its ongoing financial reporting, including the selection of a transition method.
67
Table of Contents
APPLIED MATERIALS, INC.
NOTES TO CONSOLIDATED FINANCIAL STATEMENTS - (Continued)
Note 2 | Earnings Per Share |
Basic earnings per share is determined using the weighted average number of common shares outstanding during the period. Diluted earnings per share is determined using the weighted average number of common shares and potential common shares (representing the dilutive effect of stock options, restricted stock units, and employee stock purchase plan shares) outstanding during the period. Applied's net income has not been adjusted for any period presented for purposes of computing basic or diluted earnings per share due to the Company's non-complex capital structure.
Fiscal Year | 2016 |
| 2015 |
| 2014 | ||||||
|
|
|
|
|
| ||||||
| (In millions, except per share amounts) | ||||||||||
Numerator: |
|
|
|
|
| ||||||
Net income | $ | 1,721 | |
| $ | 1,377 | |
| $ | 1,072 | |
Denominator: |
|
|
|
|
| ||||||
Weighted average common shares outstanding | 1,107 | |
| 1,214 | |
| 1,215 | | |||
Effect of dilutive stock options, restricted stock units and employee stock purchase plan shares | 9 | |
| 12 | |
| 16 | | |||
Denominator for diluted earnings per share | 1,116 | |
| 1,226 | |
| 1,231 | | |||
Basic earnings per share | $ | 1.56 | |
| $ | 1.13 | |
| $ | 0.88 | |
Diluted earnings per share | $ | 1.54 | |
| $ | 1.12 | |
| $ | 0.87 | |
Potentially dilutive securities | - | |
| - | |
| 1 | | |||
Potentially dilutive securities attributable to outstanding stock options and restricted stock units are excluded from the calculation of diluted earnings per share where the combined exercise price, average unamortized fair value and assumed tax benefits upon the exercise of options and the vesting of restricted stock units are greater than the average market price of Applied common stock, and their inclusion would be anti-dilutive.
68
Table of Contents
APPLIED MATERIALS, INC.
NOTES TO CONSOLIDATED FINANCIAL STATEMENTS - (Continued)
Note 3 | Cash, Cash Equivalents and Investments |
Summary of Cash, Cash Equivalents and Investments
The following tables summarize Applied's cash, cash equivalents and investments by security type:
October 30, 2016 | Cost |
| Gross Unrealized Gains |
| Gross Unrealized Losses |
| Estimated Fair Value | ||||||||
|
|
|
|
|
|
|
| ||||||||
| (In millions) | ||||||||||||||
Cash | $ | 1,103 | |
| $ | - | |
| $ | - | |
| $ | 1,103 | |
Cash equivalents: |
|
|
|
|
|
|
| ||||||||
Money market funds | 1,889 | |
| - | |
| - | |
| 1,889 | | ||||
U.S. Treasury and agency securities | 10 | |
| - | |
| - | |
| 10 | | ||||
Non-U.S. government securities* | 10 | |
| - | |
| - | |
| 10 | | ||||
Municipal securities | 253 | |
| - | |
| - | |
| 253 | | ||||
Commercial paper, corporate bonds and medium-term notes | 141 | |
| - | |
| - | |
| 141 | | ||||
Total Cash equivalents | 2,303 | |
| - | |
| - | |
| 2,303 | | ||||
Total Cash and Cash equivalents | $ | 3,406 | |
| $ | - | |
| $ | - | |
| $ | 3,406 | |
Short-term and long-term investments: |
|
|
|
|
|
|
| ||||||||
U.S. Treasury and agency securities | $ | 195 | |
| $ | - | |
| $ | - | |
| $ | 195 | |
Non-U.S. government securities* | 5 | |
| - | |
| - | |
| 5 | | ||||
Municipal securities | 408 | |
| - | |
| - | |
| 408 | | ||||
Commercial paper, corporate bonds and medium-term notes | 273 | |
| 1 | |
| - | |
| 274 | | ||||
Asset-backed and mortgage-backed securities | 253 | |
| 1 | |
| 1 | |
| 253 | | ||||
Total fixed income securities | 1,134 | |
| 2 | |
| 1 | |
| 1,135 | | ||||
Publicly traded equity securities | 26 | |
| 44 | |
| 3 | |
| 67 | | ||||
Equity investments in privately-held companies | 70 | |
| - | |
| - | |
| 70 | | ||||
Total short-term and long-term investments | $ | 1,230 | |
| $ | 46 | |
| $ | 4 | |
| $ | 1,272 | |
Total Cash, Cash equivalents and Investments | $ | 4,636 | |
| $ | 46 | |
| $ | 4 | |
| $ | 4,678 | |
_________________________
* Includes agency debt securities guaranteed by non-U.S. governments, which consist of Canada and Germany.
69
Table of Contents
APPLIED MATERIALS, INC.
NOTES TO CONSOLIDATED FINANCIAL STATEMENTS - (Continued)
October 25, 2015 | Cost |
| Gross Unrealized Gains |
| Gross Unrealized Losses |
| Estimated Fair Value | ||||||||
|
|
|
|
|
|
|
| ||||||||
| (In millions) | ||||||||||||||
Cash | $ | 1,010 | |
| $ | - | |
| $ | - | |
| $ | 1,010 | |
Cash equivalents: |
|
|
|
|
|
|
| ||||||||
Money market funds | 3,272 | |
| - | |
| - | |
| 3,272 | | ||||
Non-U.S. government securities | 60 | |
| - | |
| - | |
| 60 | | ||||
Municipal securities | 73 | |
| - | |
| - | |
| 73 | | ||||
Commercial paper, corporate bonds and medium-term notes | 382 | |
| - | |
| - | |
| 382 | | ||||
Total Cash equivalents | $ | 3,787 | |
| $ | - | |
| $ | - | |
| $ | 3,787 | |
Total Cash and Cash equivalents | $ | 4,797 | |
| $ | - | |
| $ | - | |
| $ | 4,797 | |
Short-term and long-term investments: |
|
|
|
|
|
|
| ||||||||
U.S. Treasury and agency securities | $ | 84 | |
| $ | - | |
| $ | - | |
| $ | 84 | |
Non-U.S. government securities | 9 | |
| - | |
| - | |
| 9 | | ||||
Municipal securities | 384 | |
| 2 | |
| - | |
| 386 | | ||||
Commercial paper, corporate bonds and medium-term notes | 250 | |
| - | |
| - | |
| 250 | | ||||
Asset-backed and mortgage-backed securities | 262 | |
| - | |
| - | |
| 262 | | ||||
Total fixed income securities | 989 | |
| 2 | |
| - | |
| 991 | | ||||
Publicly traded equity securities | 28 | |
| 17 | |
| - | |
| 45 | | ||||
Equity investments in privately-held companies | 78 | |
| - | |
| - | |
| 78 | | ||||
Total short-term and long-term investments | $ | 1,095 | |
| $ | 19 | |
| $ | - | |
| $ | 1,114 | |
Total Cash, Cash equivalents and Investments | $ | 5,892 | |
| $ | 19 | |
| $ | - | |
| $ | 5,911 | |
Maturities of Investments
The following table summarizes the contractual maturities of Applied's investments at October 30, 2016 :
| Cost |
| Estimated Fair Value | ||||
|
|
|
| ||||
| (In millions) | ||||||
Due in one year or less | $ | 329 | |
| $ | 329 | |
Due after one through five years | 552 | |
| 553 | | ||
No single maturity date** | 349 | |
| 390 | | ||
| $ | 1,230 | |
| $ | 1,272 | |
_________________________
** Securities with no single maturity date include publicly-traded and privately-held equity securities, and asset-backed and mortgage-backed securities.
70
Table of Contents
APPLIED MATERIALS, INC.
NOTES TO CONSOLIDATED FINANCIAL STATEMENTS - (Continued)
Gains and Losses on Investments
Gross realized gains and losses on sales of investments for each fiscal year were as follows:
| 2016 |
| 2015 |
| 2014 | ||||||
|
|
|
|
|
| ||||||
| (In millions) | ||||||||||
Gross realized gains | $ | 10 | |
| $ | 9 | |
| $ | 27 | |
Gross realized losses | $ | 2 | |
| $ | 3 | |
| $ | 2 | |
At October 30, 2016 , gross unrealized losses related to Applied's investment portfolio were not material. Applied regularly reviews its investment portfolio to identify and evaluate investments that have indications of possible impairment. Factors considered in determining whether an unrealized loss is considered to be temporary, or other-than-temporary and therefore impaired, include: the length of time and extent to which fair value has been lower than the cost basis; the financial condition, credit quality and near-term prospects of the investee; and whether it is more likely than not that Applied will be required to sell the security prior to recovery. Generally, the contractual terms of investments in marketable securities do not permit settlement at prices less than the amortized cost of the investments. Applied determined that the gross unrealized losses on its marketable fixed income securities at October 30, 2016 , October 25, 2015 and October 26, 2014 were temporary in nature and therefore it did not recognize any impairment of its marketable fixed income securities for fiscal 2016 , 2015 or 2014 . During fiscal 2016 , 2015 and 2014 , Applied determined that certain of its equity investments were other-than-temporarily impaired and, accordingly, recognized impairment charges of $8 million , $9 million and $15 million , respectively. These impairment charges are included in interest and other income, net in the Consolidated Statement of Operations.
Unrealized gains and temporary losses on investments classified as available-for-sale are included within accumulated other comprehensive income (loss), net of any related tax effect. Upon realization, those amounts are reclassified from accumulated other comprehensive income (loss) to results of operations.
71
Table of Contents
APPLIED MATERIALS, INC.
NOTES TO CONSOLIDATED FINANCIAL STATEMENTS - (Continued)
Note 4 | Fair Value Measurements |
Applied's financial assets are measured and recorded at fair value, except for equity investments in privately-held companies. These equity investments are generally accounted for under the cost method of accounting and are periodically assessed for other-than-temporary impairment when events or circumstances indicate that an other-than-temporary decline in value may have occurred. Applied's nonfinancial assets, such as goodwill, intangible assets, and property, plant and equipment, are recorded at cost and are assessed for impairment when events or circumstances indicate that an other-than-temporary decline in value may have occurred.
Fair Value Hierarchy
Applied uses the following fair value hierarchy, which prioritizes the inputs to valuation techniques used to measure fair value into three levels and bases the categorization within the hierarchy upon the lowest level of input that is available and significant to the fair value measurement:
• | Level 1 - Quoted prices in active markets for identical assets or liabilities; |
• | Level 2 - Inputs other than Level 1 that are observable, either directly or indirectly, such as quoted prices for similar assets or liabilities, quoted prices in markets that are not active, or other inputs that are observable or can be corroborated by observable market data for substantially the full term of the assets or liabilities; and |
• | Level 3 - Unobservable inputs that are supported by little or no market activity and that are significant to the fair value of the assets or liabilities. |
Applied's investments consist primarily of debt securities that are classified as available-for-sale and recorded at their fair values. In determining the fair value of investments, Applied uses pricing information from pricing services that value securities based on quoted market prices and models that utilize observable market inputs. In the event a fair value estimate is unavailable from a pricing service, Applied generally obtains non-binding price quotes from brokers. Applied then reviews the information provided by the pricing services or brokers to determine the fair value of its short-term and long-term investments. In addition, to validate pricing information obtained from pricing services, Applied periodically performs supplemental analysis on a sample of securities. Applied reviews any significant unanticipated differences identified through this analysis to determine the appropriate fair value.
Investments with remaining effective maturities of 12 months or less from the balance sheet date are classified as short-term investments. Investments with remaining effective maturities of more than 12 months from the balance sheet date are classified as long-term investments. As of October 30, 2016 , substantially all of Applied's available-for-sale, short-term and long-term investments were recognized at fair value that was determined based upon observable inputs.
72
Table of Contents
APPLIED MATERIALS, INC.
NOTES TO CONSOLIDATED FINANCIAL STATEMENTS - (Continued)
Assets Measured at Fair Value on a Recurring Basis
Financial assets (excluding cash balances) measured at fair value on a recurring basis are summarized below:
| October 30, 2016 |
| October 25, 2015 | ||||||||||||||||||||
| Level 1 |
| Level 2 |
| Total |
| Level 1 |
| Level 2 |
| Total | ||||||||||||
|
|
|
|
|
|
|
|
|
|
|
| ||||||||||||
| (In millions) | ||||||||||||||||||||||
Assets: |
|
|
|
|
|
|
|
|
|
|
| ||||||||||||
Money market funds | $ | 1,889 | |
| $ | - | |
| $ | 1,889 | |
| $ | 3,272 | |
| $ | - | |
| $ | 3,272 | |
U.S. Treasury and agency securities | 107 | |
| 98 | |
| 205 | |
| 72 | |
| 12 | |
| 84 | | ||||||
Non-U.S. government securities | - | |
| 15 | |
| 15 | |
| - | |
| 69 | |
| 69 | | ||||||
Municipal securities | - | |
| 661 | |
| 661 | |
| - | |
| 459 | |
| 459 | | ||||||
Commercial paper, corporate bonds and medium-term notes | - | |
| 415 | |
| 415 | |
| - | |
| 632 | |
| 632 | | ||||||
Asset-backed and mortgage-backed securities | - | |
| 253 | |
| 253 | |
| - | |
| 262 | |
| 262 | | ||||||
Publicly traded equity securities | 67 | |
| - | |
| 67 | |
| 45 | |
| - | |
| 45 | | ||||||
Total | $ | 2,063 | |
| $ | 1,442 | |
| $ | 3,505 | |
| $ | 3,389 | |
| $ | 1,434 | |
| $ | 4,823 | |
There were no transfers between Level 1 and Level 2 fair value measurements during fiscal 2016 and 2015 , and Applied did not have any financial assets measured at fair value on a recurring basis within Level 3 fair value measurements as of October 30, 2016 or October 25, 2015 .
Assets and Liabilities Measured at Fair Value on a Non-recurring Basis
Equity investments in privately-held companies are generally accounted for under the cost method of accounting and are periodically assessed for other-than-temporary impairment when an event or circumstance indicates that an other-than-temporary decline in value may have occurred. If Applied determines that an other-than-temporary impairment has occurred, the investment will be written down to its estimated fair value based on available information, such as pricing in recent rounds of financing, current cash positions, earnings and cash flow forecasts, recent operational performance and any other readily available market data. Equity investments in privately-held companies totaled $70 million at October 30, 2016 , of which $62 million of investments were accounted for under the cost method of accounting and $8 million of investments had been measured at fair value on a non-recurring basis within Level 3 fair value measurements due to an other-than-temporary decline in value. Equity investments in privately-held companies totaled $78 million at October 25, 2015 , of which $70 million of investments were accounted for under the cost method of accounting and $8 million of investments had been measured at fair value on a non-recurring basis within Level 3 fair value measurements due to an other-than-temporary decline in value.
During fiscal 2016 , 2015 and 2014 , Applied determined that certain of its equity investments in publicly-held and privately-held companies were other-than-temporarily impaired and, accordingly, recognized impairment charges of $8 million , $9 million and $15 million , respectively.
Other
The carrying amounts of Applied's financial instruments, including cash and cash equivalents, accounts receivable, notes payable - short term, and accounts payable and accrued expenses, approximate fair value due to their short maturities. At October 30, 2016 , the carrying amount of long-term debt was $3.1 billion , and the estimated fair value was $3.5 billion . At October 25, 2015 , the carrying amount of long-term debt was $3.3 billion , and the estimated fair value was $3.5 billion . The estimated fair value of long-term debt is determined by Level 2 inputs and is based primarily on quoted market prices for the same or similar issues. See Note 9 of the Notes to the Consolidated Financial Statements for further detail of existing debt.
73
Table of Contents
APPLIED MATERIALS, INC.
NOTES TO CONSOLIDATED FINANCIAL STATEMENTS - (Continued)
Note 5 | Derivative Instruments and Hedging Activities |
Derivative Financial Instruments
Applied conducts business in a number of foreign countries, with certain transactions denominated in local currencies, such as the Japanese yen, euro, Israeli shekel and Taiwanese dollar. Applied uses derivative financial instruments, such as forward exchange contracts and currency option contracts, to hedge certain forecasted foreign currency denominated transactions expected to occur typically within the next 24 months . The purpose of Applied's foreign currency management is to mitigate the effect of exchange rate fluctuations on certain foreign currency denominated revenues, costs and eventual cash flows. The terms of currency instruments used for hedging purposes are generally consistent with the timing of the transactions being hedged.
During fiscal 2015, Applied entered into and settled a series of forward-starting interest rate swap agreements, with a total notional amount of $600 million , to hedge against the variability of cash flows due to changes in the benchmark interest rate of fixed rate debt. These instruments were designated as cash flow hedges at inception and settled in conjunction with the issuance of debt in September 2015. The $20 million loss from the settlement of the interest rate swap agreement, which was included in accumulated other comprehensive income (AOCI) in stockholders' equity, is being amortized to interest expense over the term of the senior unsecured 10 -year notes issued in September 2015.
Applied does not use derivative financial instruments for trading or speculative purposes. Derivative instruments and hedging activities, including foreign currency exchange contracts and interest rate swap agreements, are recognized on the balance sheet at fair value. Changes in the fair value of derivatives that do not qualify for hedge treatment, as well as the ineffective portion of any hedges, are recognized currently in earnings. All of Applied's derivative financial instruments are recorded at their fair value in other current assets or in accounts payable and accrued expenses.
Hedges related to anticipated transactions are designated and documented at the inception of the hedge as cash flow hedges and foreign exchange derivatives are typically entered into once per month. Cash flow hedges are evaluated for effectiveness quarterly. The effective portion of the gain or loss on these hedges is reported as a component of AOCI in stockholders' equity and is reclassified into earnings when the hedged transaction affects earnings. The majority of the after-tax net income or loss related to foreign exchange derivative instruments included in AOCI at October 30, 2016 is expected to be reclassified into earnings within 12 months . Changes in the fair value of currency forward exchange and option contracts due to changes in time value are excluded from the assessment of effectiveness. Both ineffective hedge amounts and hedge components excluded from the assessment of effectiveness are recognized in earnings. If the transaction being hedged is no longer probable to occur, or if a portion of any derivative is deemed to be ineffective, Applied promptly recognizes the gain or loss on the associated financial instrument in earnings. The amount recognized due to discontinuance of cash flow hedges that were probable not to occur by the end of the originally specified time period was a loss of $8 million in fiscal 2016, and was not significant for fiscal 2015 or 2014 .
Additionally, forward exchange contracts are generally used to hedge certain foreign currency denominated assets or liabilities. These derivatives are typically entered into once per month and are not designated for hedge accounting treatment. Accordingly, changes in the fair value of these hedges are recorded in earnings to offset the changes in the fair value of the assets or liabilities being hedged.
In September 2013, Applied and Tokyo Electron Limited (TEL) entered into a Business Combination Agreement. Applied purchased foreign exchange option contracts to limit its foreign exchange risk associated with the then-anticipated business combination. These derivatives did not qualify for hedge accounting treatment and were marked to market at the end of each reporting period with gains and losses recorded as part of operating expenses. Due to the termination of the then-anticipated business combination with TEL on April 26, 2015, these foreign exchange option contracts were sold during the third quarter of fiscal 2015. Applied recorded a gain of $89 million and $30 million in fiscal 2015 and 2014, respectively, related to these contracts. The cash flow impacts of these derivatives have been classified as operating cash flows in the Consolidated Statements of Cash Flows.
The fair values of foreign exchange derivative instruments at October 30, 2016 and October 25, 2015 were not material.
74
Table of Contents
APPLIED MATERIALS, INC.
NOTES TO CONSOLIDATED FINANCIAL STATEMENTS - (Continued)
The effects of derivative instruments and hedging activities on the Consolidated Statements of Operations were as follows:
|
|
| Effective Portion |
| Ineffective Portion and Amount | ||||||||
Derivatives in Cash Flow Hedging Relationships | Location of Gain or |
| Gain or |
| Gain or (Loss) |
| Gain or (Loss) | ||||||
|
|
|
|
|
|
|
| ||||||
|
|
| (In millions) | ||||||||||
2016 |
|
|
|
|
|
|
| ||||||
Foreign exchange contracts | Cost of products sold |
| $ | (53 | ) |
| $ | (46 | ) |
| $ | 2 | |
Foreign exchange contracts | General and administrative |
| - | |
| - | |
| (11 | ) | |||
Interest rate swaps | Interest expense |
| - | |
| (2 | ) |
| - | | |||
Total |
|
| $ | (53 | ) |
| $ | (48 | ) |
| $ | (9 | ) |
|
|
|
|
|
|
|
| ||||||
2015 |
|
|
|
|
|
|
| ||||||
Foreign exchange contracts | Cost of products sold |
| $ | 6 | |
| $ | 15 | |
| $ | (4 | ) |
Foreign exchange contracts | General and administrative |
| - | |
| (6 | ) |
| (2 | ) | |||
Interest rate swaps | Interest expense |
| (20 | ) |
| - | |
| - | | |||
Total |
|
| $ | (14 | ) |
| $ | 9 | |
| $ | (6 | ) |
|
|
|
|
|
|
|
| ||||||
2014 |
|
|
|
|
|
|
| ||||||
Foreign exchange contracts | Cost of products sold |
| $ | 7 | |
| $ | 8 | |
| $ | (2 | ) |
Foreign exchange contracts | General and administrative |
| - | |
| 1 | |
| (2 | ) | |||
Total |
|
| $ | 7 | |
| $ | 9 | |
| $ | (4 | ) |
|
|
| Amount of Gain or (Loss) Recognized in Income | ||||||||||
Derivatives Not Designated as Hedging Instruments | Location of Gain or |
| 2016 |
| 2015 |
| 2014 | ||||||
|
|
|
|
|
|
|
| ||||||
|
|
| (In millions) | ||||||||||
Foreign exchange contracts | Gain (loss) on derivatives associated with terminated business combination |
| $ | - | |
| $ | 89 | |
| $ | 30 | |
Foreign exchange contracts | General and administrative |
| (75 | ) |
| 21 | |
| 19 | | |||
Total |
|
| $ | (75 | ) |
| $ | 110 | |
| $ | 49 | |
Credit Risk Contingent Features
If Applied's credit rating were to fall below investment grade, it would be in violation of credit risk contingent provisions of the derivative instruments discussed above, and certain counterparties to the derivative instruments could request immediate payment on derivative instruments in net liability positions. The aggregate fair value of all derivative instruments with credit-risk related contingent features that were in a net liability position was immaterial as of October 30, 2016 and October 25, 2015 .
Entering into derivative contracts with banks exposes Applied to credit-related losses in the event of the banks' nonperformance. However, Applied's exposure is not considered significant.
75
Table of Contents
APPLIED MATERIALS, INC.
NOTES TO CONSOLIDATED FINANCIAL STATEMENTS - (Continued)
Note 6 | Accounts Receivable, Net |
Applied has agreements with various financial institutions to sell accounts receivable and discount promissory notes from selected customers. Applied sells its accounts receivable without recourse. Applied, from time to time, also discounts letters of credit issued by customers through various financial institutions. The discounting of letters of credit depends on many factors, including the willingness of financial institutions to discount the letters of credit and the cost of such arrangements. Details of discounted letters of credit, accounts receivable sold and discounted promissory notes for fiscal years ended 2016, 2015 and 2014 were as follows:
| 2016 |
| 2015 |
| 2014 | ||||||
|
|
|
|
|
| ||||||
| (In millions) | ||||||||||
Discounted letters of credit | $ | - | |
| $ | - | |
| $ | 29 | |
Accounts receivable sold and discounted promissory notes | 75 | |
| - | |
| 45 | | |||
Total | $ | 75 | |
| $ | - | |
| $ | 74 | |
Financing charges on the sale of receivables and discounting of letters of credit are included in interest expense in the accompanying Consolidated Statements of Operations and were not material for all years presented.
Accounts receivable are presented net of allowance for doubtful accounts of $51 million and $49 million at October 30, 2016 and October 25, 2015 , respectively.
| 2016 |
| 2015 |
| 2014 | ||||||
|
|
|
|
|
| ||||||
| (In millions) | ||||||||||
Beginning balance | $ | 49 | |
| $ | 58 | |
| $ | 74 | |
Provision | 3 | |
| - | |
| - | | |||
Deductions 1 | (1 | ) |
| (9 | ) |
| (16 | ) | |||
Ending balance | $ | 51 | |
| $ | 49 | |
| $ | 58 | |
1 Fiscal 2016, 2015 and 2014 deductions represent releases of allowance for doubtful accounts credited to expense as a result of an overall lower risk profile of Applied's customers.
Applied sells its products principally to manufacturers within the semiconductor and display industries. While Applied believes that its allowance for doubtful accounts is adequate and represents its best estimate as of October 30, 2016 , it continues to closely monitor customer liquidity and industry and economic conditions, which may result in changes to Applied estimates.
76
Table of Contents
APPLIED MATERIALS, INC.
NOTES TO CONSOLIDATED FINANCIAL STATEMENTS - (Continued)
Note 7 | Balance Sheet Detail |
| October 30, |
| October 25, | ||||
|
|
|
| ||||
| (In millions) | ||||||
Inventories |
|
|
| ||||
Customer service spares | $ | 452 | |
| $ | 382 | |
Raw materials | 474 | |
| 461 | | ||
Work-in-process | 393 | |
| 271 | | ||
Finished goods | 731 | |
| 719 | | ||
| $ | 2,050 | |
| $ | 1,833 | |
Included in finished goods inventory is $190 million at October 30, 2016 and $155 million October 25, 2015 , of newly-introduced systems at customer locations where the sales transaction did not meet Applied's revenue recognition criteria as set forth in Note 1. Finished goods inventory includes $197 million and $185 million of evaluation inventory at October 30, 2016 and October 25, 2015 , respectively.
| October 30, |
| October 25, | ||||
|
|
|
| ||||
| (In millions) | ||||||
Other Current Assets |
|
|
| ||||
Deferred income taxes, net 1 | $ | - | |
| $ | 403 | |
Prepaid income taxes and income taxes receivable | 87 | |
| 127 | | ||
Prepaid expenses and other | 188 | |
| 194 | | ||
| $ | 275 | |
| $ | 724 | |
1 2016 balance reflects the effects of the prospective adoption of the authoritative guidance in the first quarter of fiscal 2016, which required all deferred tax assets and liabilities, and any related valuation allowance to be classified as noncurrent on the balance sheet.
| Useful Life |
| October 30, |
| October 25, | ||||
|
|
|
|
|
| ||||
| (In years) |
| (In millions) | ||||||
Property, Plant and Equipment, Net |
|
|
| ||||||
Land and improvements |
|
| $ | 159 | |
| $ | 157 | |
Buildings and improvements | 3-30 |
| 1,261 | |
| 1,247 | | ||
Demonstration and manufacturing equipment | 3-5 |
| 992 | |
| 920 | | ||
Furniture, fixtures and other equipment | 3-15 |
| 547 | |
| 574 | | ||
Construction in progress |
|
| 84 | |
| 48 | | ||
Gross property, plant and equipment |
|
| 3,043 | |
| 2,946 | | ||
Accumulated depreciation |
|
| (2,106 | ) |
| (2,054 | ) | ||
|
|
| $ | 937 | |
| $ | 892 | |
Depreciation expense was $200 million , $185 million and $191 million for fiscal 2016 , 2015 and 2014 respectively.
77
Table of Contents
APPLIED MATERIALS, INC.
NOTES TO CONSOLIDATED FINANCIAL STATEMENTS - (Continued)
| October 30, |
| October 25, | ||||
|
|
|
| ||||
| (In millions) | ||||||
Accounts Payable and Accrued Expenses |
|
|
| ||||
Accounts payable | $ | 813 | |
| $ | 658 | |
Compensation and employee benefits | 517 | |
| 509 | | ||
Warranty | 153 | |
| 126 | | ||
Dividends payable | 108 | |
| 116 | | ||
Income taxes payable | 101 | |
| 60 | | ||
Other accrued taxes | 50 | |
| 58 | | ||
Interest payable | 31 | |
| 36 | | ||
Other | 283 | |
| 270 | | ||
| $ | 2,056 | |
| $ | 1,833 | |
| October 30, |
| October 25, | ||||
|
|
|
| ||||
| (In millions) | ||||||
Customer Deposits and Deferred Revenue |
|
|
| ||||
Customer deposits | $ | 471 | |
| $ | 132 | |
Deferred revenue | 905 | |
| 633 | | ||
| $ | 1,376 | |
| $ | 765 | |
Applied typically receives deposits on future deliverables from customers in the Display and Adjacent Markets segment and, in certain instances, may also receive deposits from customers in the Applied Global Services segment.
| October 30, |
| October 25, | ||||
|
|
|
| ||||
| (In millions) | ||||||
Other Liabilities |
|
|
| ||||
Deferred income taxes | $ | 1 | |
| $ | 56 | |
Income taxes payable | 337 | |
| 227 | | ||
Defined and postretirement benefit plans | 182 | |
| 187 | | ||
Other | 76 | |
| 85 | | ||
| $ | 596 | |
| $ | 555 | |
78
Table of Contents
APPLIED MATERIALS, INC.
NOTES TO CONSOLIDATED FINANCIAL STATEMENTS - (Continued)
Note 8 | Goodwill, Purchased Technology and Other Intangible Assets |
Goodwill and Purchased Intangible Assets
Applied's methodology for allocating the purchase price relating to purchase acquisitions is determined through established and generally accepted valuation techniques. Goodwill is measured as the excess of the purchase price over the sum of the amounts assigned to tangible and identifiable intangible assets acquired less liabilities assumed. Applied assigns assets acquired (including goodwill) and liabilities assumed to one or more reporting units as of the date of acquisition. Typically, acquisitions relate to a single reporting unit and thus do not require the allocation of goodwill to multiple reporting units. If the products obtained in an acquisition are assigned to multiple reporting units, the goodwill is distributed to the respective reporting units as part of the purchase price allocation process.
Goodwill and purchased intangible assets with indefinite useful lives are not amortized, but are reviewed for impairment annually during the fourth quarter of each fiscal year and whenever events or changes in circumstances indicate that the carrying value of an asset may not be recoverable. The process of evaluating the potential impairment of goodwill and intangible assets requires significant judgment, especially in emerging markets. Applied regularly monitors current business conditions and considers other factors including, but not limited to, adverse industry or economic trends, restructuring actions and lower projections of profitability that may impact future operating results.
To test goodwill for impairment, Applied first performs a qualitative assessment to determine whether it is more likely than not that the fair value of a reporting unit is less than its carrying value. If it is concluded that this is the case, Applied then performs the two-step goodwill impairment test. Otherwise, the two-step goodwill impairment test is not required. Under the two-step goodwill impairment test, Applied would, in the first step, compare the estimated fair value of each reporting unit to its carrying value. Applied determines the fair value of each of its reporting units based on a weighting of income and market approaches. If the carrying value of a reporting unit exceeds its fair value, Applied would then perform the second step of the impairment test in order to determine the implied fair value of the reporting unit's goodwill. If Applied determines that the carrying value of a reporting unit's goodwill exceeds its implied fair value, Applied would record an impairment charge equal to the difference.
During the third quarter of fiscal 2015, Applied implemented a new management structure, which resulted in changes in Applied's reporting units. Applied's reporting units include Transistor and Interconnect Group, Patterning and Packaging Group, and Imaging and Process Control Group, which, based on similar economic characteristics and similar nature of their products and services, production processes, type or class of customers, distribution methods and operational environment, combine to form the Semiconductor Systems reporting segment, Applied Global Services and Display and Adjacent Markets.
Effective in the third quarter of fiscal 2016, Applied began to account for its flexible coating systems (previously included in the Energy and Environmental Solutions segment) and display upgrade equipment (previously included in the Applied Global Services segment) under the Display and Adjacent Markets segment (previously Display). See Note 14, Industry Segment Operations. These changes did not affect the Semiconductor Systems reporting segment.
Due to this change, Applied performed a goodwill impairment test for Applied Global Services and Display and Adjacent Markets immediately before the changes in the composition of the segments, reallocated $31 million of goodwill from Applied Global Services associated with the display upgrade equipment business to Display and Adjacent Markets based on the estimated relative fair value of each business unit and, then performed another goodwill impairment test for Applied Global Services and Display and Adjacent Markets after the change. There was no goodwill associated with the flexible coating systems business. Prior period information in the tables below has been reclassified to conform to current presentation, which reflects the new organizational structure.
In performing the goodwill impairment test, Applied utilized both the discounted cash flow method (weighted 75% ) and the guideline company method (weighted 25% ) to estimate the fair value of the reporting units. The estimates used in the impairment testing were consistent with the discrete forecasts that Applied uses to manage its business, and considered any significant developments that occurred during the quarter. Under the discounted cash flow method, cash flows beyond the discrete forecasts were estimated using a terminal growth rate, which considered the long-term earnings growth rate specific to the reporting units. The estimated future cash flows were discounted to present value using each reporting unit's weighted average cost of capital. The weighted average cost of capital measures a reporting unit's cost of debt and equity financing weighted by the percentage of debt and equity in a reporting unit's target capital structure. In addition, the weighted average cost of capital was derived using both known and estimated market metrics, and was adjusted to reflect both the timing and risks associated with the estimated cash flows. The tax rate used in the discounted cash flow method was the median tax rate of comparable companies which reflected Applied's current international structure, which is consistent with the market participant perspective. Under the guideline company method, market multiples were applied to forecasted revenues and earnings before interest, taxes, depreciation and amortization. The market multiples used were consistent with comparable publicly-traded companies and considered each reporting unit's size,
79
Table of Contents
APPLIED MATERIALS, INC.
NOTES TO CONSOLIDATED FINANCIAL STATEMENTS - (Continued)
growth and profitability relative to its comparable companies. Based on Applied's analysis, the estimated fair value exceeded the carrying value for Applied Global Services and Display and Adjacent Markets segments before and after the change in their compositions, and therefore, the second step of the goodwill impairment test was not required.
In the fourth quarter of fiscal 2016 , Applied performed a qualitative assessment to test goodwill for all of its reporting units for impairment. Applied determined that it was more likely than not that each of its reporting units' fair values exceeded their respective carrying values and that it was not necessary to perform the two-step goodwill impairment test for any of its reporting units.
The evaluation of goodwill and intangible assets for impairment requires the exercise of significant judgment. In the event of future changes in business conditions, Applied will be required to reassess and update its forecasts and estimates used in future impairment analyses. If the results of these future analyses are lower than current estimates, a material impairment charge may result at that time.
Details of goodwill and other indefinite-lived intangible assets were as follows:
| October 30, 2016 |
| October 25, 2015 | ||||||||||||||||||||
| Goodwill |
| Other Intangible Assets |
| Total |
| Goodwill |
| Other Intangible Assets |
| Total | ||||||||||||
|
|
|
|
|
|
|
|
|
|
|
| ||||||||||||
| (In millions) | ||||||||||||||||||||||
Semiconductor Systems | $ | 2,151 | |
| $ | - | |
| $ | 2,151 | |
| $ | 2,151 | |
| $ | - | |
| $ | 2,151 | |
Applied Global Services | 1,010 | |
| 5 | |
| 1,015 | |
| 996 | |
| 5 | |
| 1,001 | | ||||||
Display and Adjacent Markets | 155 | |
| 20 | |
| 175 | |
| 155 | |
| 20 | |
| 175 | | ||||||
Carrying amount | $ | 3,316 | |
| $ | 25 | |
| $ | 3,341 | |
| $ | 3,302 | |
| $ | 25 | |
| $ | 3,327 | |
From time to time, Applied makes acquisitions of and investments in companies related to existing or new markets for Applied. During fiscal 2016 , goodwill and other indefinite lived intangible assets increased by $14 million primarily due to two acquisitions completed in fiscal 2016, which were not significant to Applied's results of operations, both individually and in the aggregate.
Other intangible assets that are not subject to amortization consist primarily of in-process technology, which will be subject to amortization upon commercialization. The fair value assigned to in-process technology was determined using the income approach taking into account estimates and judgments regarding risks inherent in the development process, including the likelihood of achieving technological success and market acceptance. If an in-process technology project is abandoned, the acquired technology attributable to the project will be written-off.
A summary of Applied's purchased technology and intangible assets is set forth below:
| October 30, |
| October 25, | ||||
|
|
|
| ||||
| (In millions) | ||||||
Purchased technology, net | $ | 409 | |
| $ | 575 | |
Intangible assets - finite-lived, net | 141 | |
| 162 | | ||
Intangible assets - indefinite-lived | 25 | |
| 25 | | ||
Total | $ | 575 | |
| $ | 762 | |
80
Table of Contents
APPLIED MATERIALS, INC.
NOTES TO CONSOLIDATED FINANCIAL STATEMENTS - (Continued)
Finite-Lived Purchased Intangible Assets
Applied amortizes purchased intangible assets with finite lives using the straight-line method over the estimated economic lives of the assets, ranging from 1 to 15 years.
Applied evaluates long-lived assets for impairment whenever events or changes in circumstances indicate the carrying value of an asset group may not be recoverable. Applied assesses the fair value of the assets based on the amount of the undiscounted future cash flow that the assets are expected to generate and recognizes an impairment loss when estimated undiscounted future cash flow expected to result from the use of the asset, plus net proceeds expected from disposition of the asset, if any, are less than the carrying value of the asset. When Applied identifies an impairment, Applied reduces the carrying value of the group of assets to comparable market values, when available and appropriate, or to its estimated fair value based on a discounted cash flow approach.
Intangible assets, such as purchased technology, are generally recorded in connection with a business acquisition. The value assigned to intangible assets is usually based on estimates and judgments regarding expectations for the success and life cycle of products and technology acquired. Applied evaluates the useful lives of its intangible assets each reporting period to determine whether events and circumstances require revising the remaining period of amortization. In addition, Applied reviews intangible assets for impairment when events or changes in circumstances indicate their carrying value may not be recoverable. Management considers such indicators as significant differences in actual product acceptance from the estimates, changes in the competitive and economic environments, technological advances, and changes in cost structure.
Details of finite-lived intangible assets were as follows:
| October 30, 2016 |
| October 25, 2015 | ||||||||||||||||||||
| Purchased Technology |
| Other Intangible Assets |
| Total |
| Purchased Technology |
| Other Intangible Assets |
| Total | ||||||||||||
|
|
|
|
|
|
|
|
|
|
|
| ||||||||||||
| (In millions) | ||||||||||||||||||||||
Gross carrying amount: |
|
|
|
|
|
|
|
|
|
|
| ||||||||||||
Semiconductor Systems | $ | 1,449 | |
| $ | 252 | |
| $ | 1,701 | |
| $ | 1,449 | |
| $ | 252 | |
| $ | 1,701 | |
Applied Global Services | 28 | |
| 44 | |
| 72 | |
| 28 | |
| 44 | |
| 72 | | ||||||
Display and Adjacent Markets | 115 | |
| 36 | |
| 151 | |
| 113 | |
| 36 | |
| 149 | | ||||||
Corporate and Other | 1 | |
| 9 | |
| 10 | |
| 1 | |
| 9 | |
| 10 | | ||||||
Gross carrying amount | $ | 1,593 | |
| $ | 341 | |
| $ | 1,934 | |
| $ | 1,591 | |
| $ | 341 | |
| $ | 1,932 | |
Accumulated amortization: |
|
|
|
|
|
|
|
|
|
|
| ||||||||||||
Semiconductor Systems | $ | (1,043 | ) |
| $ | (113 | ) |
| $ | (1,156 | ) |
| $ | (876 | ) |
| $ | (95 | ) |
| $ | (971 | ) |
Applied Global Services | (27 | ) |
| (44 | ) |
| (71 | ) |
| (26 | ) |
| (44 | ) |
| (70 | ) | ||||||
Display and Adjacent Markets | (113 | ) |
| (34 | ) |
| (147 | ) |
| (113 | ) |
| (34 | ) |
| (147 | ) | ||||||
Corporate and Other | (1 | ) |
| (9 | ) |
| (10 | ) |
| (1 | ) |
| (6 | ) |
| (7 | ) | ||||||
Accumulated amortization | $ | (1,184 | ) |
| $ | (200 | ) |
| $ | (1,384 | ) |
| $ | (1,016 | ) |
| $ | (179 | ) |
| $ | (1,195 | ) |
Carrying amount | $ | 409 | |
| $ | 141 | |
| $ | 550 | |
| $ | 575 | |
| $ | 162 | |
| $ | 737 | |
81
Table of Contents
APPLIED MATERIALS, INC.
NOTES TO CONSOLIDATED FINANCIAL STATEMENTS - (Continued)
Details of amortization expense for each fiscal year by segment were as follows:
| 2016 |
| 2015 |
| 2014 | ||||||
|
|
|
|
|
| ||||||
| (In millions) | ||||||||||
Semiconductor Systems | $ | 185 | |
| $ | 179 | |
| $ | 173 | |
Applied Global Services | 1 | |
| 1 | |
| 3 | | |||
Display and Adjacent Markets | - | |
| 3 | |
| 4 | | |||
Corporate and Other | 3 | |
| 3 | |
| 4 | | |||
Total | $ | 189 | |
| $ | 186 | |
| $ | 184 | |
Amortization expense for each fiscal year was charged to the following categories:
| 2016 |
| 2015 |
| 2014 | ||||||
|
|
|
|
|
| ||||||
| (In millions) | ||||||||||
Cost of products sold | $ | 167 | |
| $ | 163 | |
| $ | 159 | |
Research, development and engineering | 2 | |
| 1 | |
| 1 | | |||
Marketing and selling | 20 | |
| 20 | |
| 21 | | |||
General and administrative | - | |
| 2 | |
| 3 | | |||
Total | $ | 189 | |
| $ | 186 | |
| $ | 184 | |
As of October 30, 2016 , future estimated amortization expense is expected to be as follows:
| Amortization Expense | ||
| (In millions) | ||
2017 | 187 | | |
2018 | 185 | | |
2019 | 45 | | |
2020 | 39 | | |
2021 | 35 | | |
Thereafter | 59 | | |
Total | $ | 550 | |
82
Table of Contents
APPLIED MATERIALS, INC.
NOTES TO CONSOLIDATED FINANCIAL STATEMENTS - (Continued)
Note 9 | Borrowing Facilities and Debt |
Applied has credit facilities for unsecured borrowings in various currencies of up to $1.6 billion , of which $1.5 billion is comprised of a committed revolving credit agreement with a group of banks that is scheduled to expire in September 2020 . This credit agreement provides for borrowings in United States dollars at interest rates keyed to one of various benchmark rates selected by Applied for each advance, plus a margin based on Applied's public debt rating and includes financial and other covenants. Remaining credit facilities in the amount of approximately $77 million are with Japanese banks. Applied's ability to borrow under these facilities is subject to bank approval at the time of the borrowing request, and any advances will be at rates indexed to the banks' prime reference rate denominated in Japanese yen. No amounts were outstanding under any of these facilities at both October 30, 2016 and October 25, 2015 , and Applied has not utilized these credit facilities. In fiscal 2011, Applied established a short-term commercial paper program of up to $1.5 billion . At October 30, 2016 and October 25, 2015 , Applied did not have any commercial paper outstanding.
In September 2015, Applied issued senior unsecured notes in the aggregate principal amount of $1.8 billion and used a portion of the net proceeds to redeem $400 million in principal amount of its 2.650% senior notes due in 2016 at a redemption price of $ 405 million in November 2015. After adjusting for the carrying value of debt issuance costs and discounts, Applied recorded a $5 million loss on the prepayment of the $400 million debt, which is included in interest and other income, net in the Consolidated Statement of Operations for the first quarter of fiscal 2016.
In October 2015, a wholly-owned foreign subsidiary of Applied entered into a short-term loan agreement with multiple lenders, under which it borrowed $800 million to facilitate the return of capital to Applied. In January 2016, the $800 million aggregate principal amount of the loan was repaid.
Debt outstanding as of October 30, 2016 and October 25, 2015 was as follows:
| Principal Amount |
|
|
|
| ||||||
| October 30, |
| October 25, |
| Effective Interest Rate |
| Interest Pay Dates | ||||
| (In millions) |
|
|
|
| ||||||
Short-term debt: |
|
|
|
|
|
|
| ||||
7.125% Senior Notes Due 2017 | $ | 200 | |
| $ | - | |
| 7.190% |
| April 15, October 15 |
2.650% Senior Notes Due 2016 | - | |
| 400 | |
| 2.666% |
| June 15, December 15 | ||
Other debt | - | |
| 800 | |
| 1.0% - 1.25% |
|
| ||
Total short-term debt | 200 | |
| 1,200 | |
|
|
|
| ||
Long-term debt: |
|
|
|
|
|
|
| ||||
7.125% Senior Notes Due 2017 | - | |
| 200 | |
| 7.190% |
| April 15, October 15 | ||
2.625% Senior Notes Due 2020 | 600 | |
| 600 | |
| 2.640% |
| April 1, October 1 | ||
4.300% Senior Notes Due 2021 | 750 | |
| 750 | |
| 4.326% |
| June 15, December 15 | ||
3.900% Senior Notes Due 2025 | 700 | |
| 700 | |
| 3.944% |
| April 1, October 1 | ||
5.100% Senior Notes Due 2035 | 500 | |
| 500 | |
| 5.127% |
| April 1, October 1 | ||
5.850% Senior Notes Due 2041 | 600 | |
| 600 | |
| 5.879% |
| June 15, December 15 | ||
| 3,150 | |
| 3,350 | |
|
|
|
| ||
Total unamortized discount | (7 | ) |
| (8 | ) |
|
|
|
| ||
Total long-term debt | 3,143 | |
| 3,342 | |
|
|
|
| ||
|
|
|
|
|
|
|
| ||||
Total debt | $ | 3,343 | |
| $ | 4,542 | |
|
|
|
|
83
Table of Contents
APPLIED MATERIALS, INC.
NOTES TO CONSOLIDATED FINANCIAL STATEMENTS - (Continued)
Note 10 | Stockholders' Equity, Comprehensive Income and Share-Based Compensation |
Accumulated Other Comprehensive Income (Loss)
Changes in the components of AOCI, net of tax, were as follows:
| Unrealized Gain (Loss) on Investments, Net |
| Unrealized Gain (Loss) on Derivative Instruments Qualifying as Cash Flow Hedges |
| Defined and Postretirement Benefit Plans |
| Cumulative Translation Adjustments |
| Total | ||||||||||
| (In millions) | ||||||||||||||||||
Balance at October 27, 2013 | $ | 25 | |
| $ | 2 | |
| $ | (72 | ) |
| $ | 7 | |
| (38 | ) | |
Other comprehensive income (loss) before reclassifications | 8 | |
| 4 | |
| (36 | ) |
| (2 | ) |
| (26 | ) | |||||
Amounts reclassified out of accumulated other comprehensive income | (9 | ) |
| (6 | ) |
| 3 | |
| - | |
| (12 | ) | |||||
Other comprehensive income (loss), net of tax | (1 | ) |
| (2 | ) |
| (33 | ) |
| (2 | ) |
| (38 | ) | |||||
Balance at October 26, 2014 | $ | 24 | |
| $ | - | |
| $ | (105 | ) |
| $ | 5 | |
| $ | (76 | ) |
Other comprehensive income (loss) before reclassifications | (11 | ) |
| (9 | ) |
| (5 | ) |
| - | |
| (25 | ) | |||||
Amounts reclassified out of AOCI | 1 | |
| (6 | ) |
| 5 | |
| 9 | |
| 9 | | |||||
Other comprehensive income (loss), net of tax | (10 | ) |
| (15 | ) |
| - | |
| 9 | |
| (16 | ) | |||||
Balance at October 25, 2015 | $ | 14 | |
| $ | (15 | ) |
| $ | (105 | ) |
| $ | 14 | |
| $ | (92 | ) |
Other comprehensive income (loss) before reclassifications | 14 | |
| (33 | ) |
| (42 | ) |
| - | |
| (61 | ) | |||||
Amounts reclassified out of AOCI | 2 | |
| 30 | |
| 6 | |
| - | |
| 38 | | |||||
Other comprehensive income (loss), net of tax | 16 | |
| (3 | ) |
| (36 | ) |
| - | |
| (23 | ) | |||||
Balance at October 30, 2016 | $ | 30 | |
| $ | (18 | ) |
| $ | (141 | ) |
| $ | 14 | |
| $ | (115 | ) |
The tax effects on net income of amounts reclassified from AOCI for 2016 was $22 million . The tax effects on net income of amounts reclassified from AOCI for the fiscal years 2015, and 2014 were not material.
Stock Repurchase Program
On June 9, 2016, Applied's Board of Directors approved a new common stock repurchase program authorizing up to $2.0 billion in repurchases, which followed the completion of a $3.0 billion common stock repurchase program approved on April 26, 2015. At October 30, 2016 , $1.8 billion remained available for future stock repurchases under the new repurchase program.
The following table summarizes Applied's stock repurchases for each fiscal year:
| 2016 |
| 2015 |
| 2014 | ||||||
|
|
|
|
|
| ||||||
| (In millions, except per share amounts) | ||||||||||
Shares of common stock repurchased | 96 | |
| 76 | |
| - | | |||
Cost of stock repurchased | $ | 1,892 | |
| $ | 1,325 | |
| $ | - | |
Average price paid per share | $ | 19.82 | |
| $ | 17.33 | |
| $ | - | |
Applied records treasury stock purchases under the cost method using the first-in, first-out (FIFO) method. Upon reissuance of treasury stock, amounts in excess of the acquisition cost are credited to additional paid in capital. If Applied reissues treasury stock at an amount below its acquisition cost and additional paid in capital associated with prior treasury stock transactions is insufficient to cover the difference between the acquisition cost and the reissue price, this difference is recorded against retained earnings.
84
Table of Contents
APPLIED MATERIALS, INC.
NOTES TO CONSOLIDATED FINANCIAL STATEMENTS - (Continued)
Dividends
During each of fiscal 2016 , 2015 and 2014 , Applied's Board of Directors declared quarterly cash dividends in the amount of $0.10 per share. Dividends paid during fiscal 2016 , 2015 and 2014 amounted to $444 million , $487 million and $485 million , respectively. Applied currently anticipates that cash dividends will continue to be paid on a quarterly basis, although the declaration of any future cash dividend is at the discretion of the Board of Directors and will depend on Applied's financial condition, results of operations, capital requirements, business conditions and other factors, as well as a determination by the Board of Directors that cash dividends are in the best interests of Applied's stockholders.
Share-Based Compensation
Applied has a stockholder-approved equity plan, the Employee Stock Incentive Plan, which permits grants to employees of share-based awards, including stock options, restricted stock, restricted stock units, performance shares and performance units. In addition, the plan provides for the automatic grant of restricted stock units to non-employee directors and permits the grant of share-based awards to non-employee directors and consultants. Share-based awards made under the plan may be subject to accelerated vesting under certain circumstances in the event of a change in control of Applied. Applied also has two Employee Stock Purchase Plans, one generally for United States employees and a second for employees of international subsidiaries (collectively, ESPP), which enable eligible employees to purchase Applied common stock.
Applied recognized share-based compensation expense related to stock options, ESPP shares, restricted stock, restricted stock units, performance shares and performance units, and related tax benefits for each fiscal year as follows:
| 2016 |
| 2015 |
| 2014 | ||||||
|
|
|
|
|
| ||||||
| (In millions) | ||||||||||
Share-based compensation | $ | 201 | |
| $ | 187 | |
| $ | 177 | |
Tax benefit recognized | $ | 63 | |
| $ | 52 | |
| $ | 50 | |
The effect of share-based compensation on the results of operations for each fiscal year was as follows:
| 2016 |
| 2015 |
| 2014 | ||||||
|
|
|
|
|
| ||||||
| (In millions) | ||||||||||
Cost of products sold | $ | 62 | |
| $ | 57 | |
| $ | 53 | |
Research, development, and engineering | 76 | |
| 69 | |
| 66 | | |||
Marketing and selling | 26 | |
| 26 | |
| 23 | | |||
General and administrative | 37 | |
| 35 | |
| 35 | | |||
Total share-based compensation | $ | 201 | |
| $ | 187 | |
| $ | 177 | |
The cost associated with share-based awards that are subject solely to time-based vesting requirements, less expected forfeitures, is recognized over the awards' service period for the entire award on a straight-line basis. The cost associated with performance-based equity awards is recognized for each tranche over the service period, based on an assessment of the likelihood that the applicable performance goals will be achieved.
At October 30, 2016 , Applied had $270 million in total unrecognized compensation expense, net of estimated forfeitures, related to grants of share-based awards and shares issued under Applied's ESPP, which will be recognized over a weighted average period of 2.4 years . At October 30, 2016 , there were 107 million shares available for grants of share-based awards under the Employee Stock Incentive Plan, and an additional 23 million shares available for issuance under the ESPP.
85
Table of Contents
APPLIED MATERIALS, INC.
NOTES TO CONSOLIDATED FINANCIAL STATEMENTS - (Continued)
Stock Options
Stock options are rights to purchase, at future dates, shares of Applied common stock. The exercise price of each stock option equals the fair market value of Applied common stock on the date of grant. Options typically vest over three to four years, subject to the grantee's continued service with Applied through the scheduled vesting date, and expire no later than seven years from the grant date. There were no stock options granted during fiscal 2016, 2015 or 2014. Outstanding stock options at the end of fiscal 2016 were not material to the consolidated financial statements.
Restricted Stock Units, Restricted Stock, Performance Shares and Performance Units
Restricted stock units are converted into shares of Applied common stock upon vesting on a one-for-one basis. Restricted stock has the same rights as other issued and outstanding shares of Applied common stock except these shares generally have no right to dividends and are held in escrow until the award vests. Performance shares and performance units are awards that result in a payment to a grantee, generally in shares of Applied common stock on a one-for-one basis if performance goals and/or other vesting criteria established by the Human Resources and Compensation Committee of Applied's Board of Directors (the Committee) are achieved or the awards otherwise vest. Restricted stock units, restricted stock, performance shares and performance units typically vest over four years and vesting is usually subject to the grantee's continued service with Applied and, in some cases, achievement of specified performance goals. The compensation expense related to the service-based awards is determined using the fair market value of Applied common stock on the date of the grant, and the compensation expense is recognized over the vesting period.
Certain executive officers were granted awards that are subject to the achievement of specified performance goals (performance-based awards). These performance-based awards become eligible to vest only if performance goals are achieved and will vest only if the grantee remains employed by Applied through each applicable vesting date. These performance-based awards require the achievement of targeted levels of adjusted annual operating profit margin. For performance-based awards granted in fiscal 2016 and 2015 , additional shares become eligible for time-based vesting if Applied achieves certain levels of total shareholder return (TSR) relative to a peer group, comprised of companies in the Standard & Poor's 500 Information Technology Index, measured at the end of a two -year period.
The fair value of these performance-based awards is estimated on the date of grant and assumes that the specified performance goals will be achieved. If the goals are achieved, these awards vest over a specified remaining service period of generally three or four years, provided that the grantee remains employed by Applied through each scheduled vesting date. If the performance goals are not met as of the end of the performance period, no compensation expense is recognized and any previously recognized compensation expense is reversed. The expected cost of each award is reflected over the service period and is reduced for estimated forfeitures.
86
Table of Contents
APPLIED MATERIALS, INC.
NOTES TO CONSOLIDATED FINANCIAL STATEMENTS - (Continued)
A summary of the changes in restricted stock units, restricted stock, performance shares and performance units outstanding under Applied's equity compensation plans is presented below:
| Shares |
| Weighted Average Grant Date Fair Value |
| Weighted Average Remaining Contractual Term |
| Aggregate Intrinsic Value | |||||
|
|
|
|
|
|
|
| |||||
| (In millions, except per share amounts) | |||||||||||
Non-vested restricted stock units, restricted stock, performance shares and performance units at October 27, 2013 | 38 | |
| $ | 11.11 | |
| 2.4 years |
| $ | 662 | |
Granted | 11 | |
| $ | 16.58 | |
|
|
|
| ||
Vested | (13 | ) |
| $ | 11.13 | |
|
|
|
| ||
Canceled | (3 | ) |
| $ | 11.72 | |
|
|
|
| ||
Non-vested restricted stock units, restricted stock, performance shares and performance units at October 26, 2014 | 33 | |
| $ | 12.59 | |
| 2.3 years |
| $ | 698 | |
Granted | 10 | |
| $ | 22.60 | |
|
|
|
| ||
Vested | (15 | ) |
| $ | 12.04 | |
|
|
|
| ||
Canceled | (1 | ) |
| $ | 14.98 | |
|
|
|
| ||
Non-vested restricted stock units, restricted stock, performance shares and performance units at October 25, 2015 | 27 | |
| $ | 16.41 | |
| 2.2 years |
| $ | 440 | |
Granted | 11 | |
| $ | 18.54 | |
|
|
|
| ||
Vested | (11 | ) |
| $ | 14.25 | |
|
|
|
| ||
Canceled | (2 | ) |
| $ | 17.57 | |
|
|
|
| ||
Non-vested restricted stock units, restricted stock, performance shares and performance units at October 30, 2016 | 25 | |
| $ | 18.28 | |
| 2.3 years |
| $ | 718 | |
Non-vested restricted stock units, restricted stock, performance shares and performance units expected to vest | 23 | |
| $ | 18.06 | |
| 2.1 years |
| $ | 652 | |
At October 30, 2016 , 1 million additional performance-based awards could be earned upon certain levels of achievement of Applied's TSR relative to a peer group at a future date.
Employee Stock Purchase Plans
Under the ESPP, substantially all employees may purchase Applied common stock through payroll deductions at a price equal to 85 percent of the lower of the fair market value of Applied common stock at the beginning or end of each 6 -month purchase period, subject to certain limits. Applied issued 6 million , 5 million and 6 million shares during fiscal 2016 , 2015 and 2014 , respectively, under the ESPP. Compensation expense is calculated using the fair value of the employees' purchase rights under the Black-Scholes model. Underlying assumptions used in the model are outlined in the following table:
| 2016 |
| 2015 |
| 2014 | |||
ESPP: |
|
|
|
|
| |||
Dividend yield | 1.76 | % |
| 2.20 | % |
| 1.96 | % |
Expected volatility | 29.3 | % |
| 31.8 | % |
| 26.3 | % |
Risk-free interest rate | 0.47 | % |
| 0.19 | % |
| 0.06 | % |
Expected life (in years) | 0.5 | |
| 0.5 | |
| 0.5 | |
Weighted average estimated fair value | $5.48 |
| $4.55 |
| $4.56 | |||
87
Table of Contents
APPLIED MATERIALS, INC.
NOTES TO CONSOLIDATED FINANCIAL STATEMENTS - (Continued)
Note 11 Employee Benefit Plans
Employee Bonus Plans
Applied has various employee bonus plans. A discretionary bonus plan provides for the distribution of a percentage of pre-tax income to Applied employees who are not participants in other performance-based incentive plans, up to a maximum percentage of eligible compensation. Other plans provide for bonuses to Applied's executives and other key contributors based on the achievement of profitability and/or other specified performance criteria. Charges under these plans for fiscal 2016 , 2015 and 2014 were $312 million , $307 million and $290 million , respectively.
Employee Savings and Retirement Plan
Applied's Employee Savings and Retirement Plan (the 401(k) Plan) is qualified under Sections 401(a) and (k) of the Internal Revenue Code (the Code). Eligible employees may make salary deferral and catch-up contributions under the 401(k) Plan on a pre-tax basis and on a Roth basis, subject to an annual dollar limit established by the Code. Applied matches 100% of participant salary and/or Roth deferral contributions up to the first 3% of eligible contribution and then 50% of every dollar between 4% and 6% of eligible contribution. Applied does not make matching contributions on any catch-up contributions made by participants. Plan participants who were employed by Applied or any of its affiliates became 100% vested in their Applied matching contribution account balances. Applied's matching contributions under the 401(k) Plan were approximately $38 million for fiscal 2016 , $35 million , net of $1 million in forfeitures for fiscal 2015 , and $29 million , net of $1 million in forfeitures for fiscal 2014 .
Defined Benefit Pension Plans of Foreign Subsidiaries and Other Post-Retirement Benefits
Several of Applied's foreign subsidiaries have defined benefit pension plans covering substantially all of their eligible employees. Benefits under these plans are typically based on years of service and final average compensation levels. The plans are managed in accordance with applicable local statutes and practices. Applied deposits funds for certain of these plans with insurance companies, pension trustees, government-managed accounts, and/or accrues the expense for the unfunded portion of the benefit obligation on its Consolidated Financial Statements. Applied's practice is to fund the various pension plans in amounts sufficient to meet the minimum requirements as established by applicable local governmental oversight and taxing authorities. Depending on the design of the plan, local custom and market circumstances, the liabilities of a plan may exceed qualified plan assets. The differences between the aggregate projected benefit obligations and aggregate plan assets of these plans have been recorded as liabilities by Applied and are included in other liabilities and accrued expenses in the Consolidated Balance Sheets.
Through December 31, 2017, Applied also sponsors a U.S. post-retirement plan that provides covered medical and vision benefits to certain eligible retirees who are at least age 55 and whose years of service plus their age equals at least 65 at their date of retirement and who have elected coverage for 2017. An eligible retiree also may elect coverage for an eligible spouse or domestic partner who is not eligible for Medicare. Coverage under the plan generally ends for both the retiree and spouse or domestic partner upon becoming eligible for Medicare, and will end entirely for all participants when the plan terminates on December 31, 2017. In addition, Applied also has a post-retirement benefit plan as a result of the acquisition of Varian. Applied's liability under these post-retirement plans, which was included in other liabilities in the Consolidated Balance Sheets, was $1 million at October 30, 2016 and $21 million at October 25, 2015 .
88
Table of Contents
APPLIED MATERIALS, INC.
NOTES TO CONSOLIDATED FINANCIAL STATEMENTS - (Continued)
A summary of the changes in benefit obligations and plan assets, which includes post-retirement benefits, for each fiscal year is presented below:
| 2016 |
| 2015 |
| 2014 | ||||||
|
|
|
|
|
| ||||||
| (In millions, except percentages) | ||||||||||
Change in projected benefit obligation |
|
|
|
|
| ||||||
Beginning projected benefit obligation | $ | 471 | |
| $ | 479 | |
| $ | 445 | |
Service cost | 13 | |
| 15 | |
| 17 | | |||
Interest cost | 13 | |
| 13 | |
| 17 | | |||
Plan participants' contributions | 1 | |
| 1 | |
| 1 | | |||
Actuarial (gain) loss | 77 | |
| 12 | |
| 62 | | |||
Curtailments, settlements and special termination benefits | (6 | ) |
| (1 | ) |
| (26 | ) | |||
Foreign currency exchange rate changes | (42 | ) |
| (39 | ) |
| (22 | ) | |||
Benefits paid | (10 | ) |
| (9 | ) |
| (12 | ) | |||
Plan amendments and business combinations | (22 | ) |
| - | |
| (3 | ) | |||
Ending projected benefit obligation | $ | 495 | |
| $ | 471 | |
| $ | 479 | |
Ending accumulated benefit obligation | $ | 460 | |
| $ | 434 | |
| $ | 446 | |
Range of assumptions to determine benefit obligations |
|
|
|
|
| ||||||
Discount rate | 0.5% - 3.1% | |
| 0.9% - 4.4% | |
| 1.0% - 4.4% | | |||
Rate of compensation increase | 1.6% - 3.6% | |
| 1.9% - 3.6% | |
| 2.0% - 4.0% | | |||
Change in plan assets |
|
|
|
|
| ||||||
Beginning fair value of plan assets | $ | 281 | |
| $ | 268 | |
| $ | 248 | |
Return on plan assets | 37 | |
| 19 | |
| 20 | | |||
Employer contributions | 50 | |
| 21 | |
| 48 | | |||
Plan participants' contributions | 1 | |
| 1 | |
| 1 | | |||
Foreign currency exchange rate changes | (45 | ) |
| (18 | ) |
| (11 | ) | |||
Divestitures, settlements and business combinations | (4 | ) |
| (1 | ) |
| (26 | ) | |||
Benefits paid | (10 | ) |
| (9 | ) |
| (12 | ) | |||
Ending fair value of plan assets | $ | 310 | |
| $ | 281 | |
| $ | 268 | |
Funded status | $ | (185 | ) |
| $ | (190 | ) |
| $ | (211 | ) |
Amounts recognized in the consolidated balance sheets |
|
|
|
|
| ||||||
Noncurrent asset | $ | 11 | |
| $ | 19 | |
| $ | 17 | |
Current liability | (2 | ) |
| (3 | ) |
| (3 | ) | |||
Noncurrent liability | (194 | ) |
| (206 | ) |
| (225 | ) | |||
Total | $ | (185 | ) |
| $ | (190 | ) |
| $ | (211 | ) |
Estimated amortization from accumulated other comprehensive loss into net periodic benefit cost over the next fiscal period |
|
|
|
|
| ||||||
Actuarial loss | $ | 6 | |
| $ | 6 | |
| $ | 6 | |
Prior service credit | (16 | ) |
| (1 | ) |
| - | | |||
Total | $ | (10 | ) |
| $ | 5 | |
| $ | 6 | |
Amounts recognized in accumulated other comprehensive loss |
|
|
|
|
| ||||||
Net actuarial loss | $ | 186 | |
| $ | 135 | |
| $ | 134 | |
Prior service credit | (21 | ) |
| - | |
| (1 | ) | |||
Total | $ | 165 | |
| $ | 135 | |
| $ | 133 | |
Plans with projected benefit obligations in excess of plan assets |
|
|
|
|
| ||||||
Projected benefit obligation | $ | 341 | |
| $ | 308 | |
| $ | 326 | |
Fair value of plan assets | $ | 145 | |
| $ | 98 | |
| $ | 98 | |
Plans with accumulated benefit obligations in excess of plan assets |
|
|
|
|
| ||||||
Accumulated benefit obligation | $ | 307 | |
| $ | 274 | |
| $ | 297 | |
Fair value of plan assets | $ | 145 | |
| $ | 98 | |
| $ | 98 | |
89
Table of Contents
APPLIED MATERIALS, INC.
NOTES TO CONSOLIDATED FINANCIAL STATEMENTS - (Continued)
| 2016 |
| 2015 |
| ||
Plan assets - allocation |
|
|
|
| ||
Equity securities | 42 | % |
| 39 | % |
|
Debt securities | 40 | % |
| 42 | % |
|
Insurance contracts | 12 | % |
| 14 | % |
|
Other investments | 4 | % |
| 4 | % |
|
Cash | 2 | % |
| 1 | % |
|
The following table presents a summary of the ending fair value of the plan assets:
| October 30, 2016 |
| October 25, 2015 | ||||||||||||||||||||||||||||
| Level 1 |
| Level 2 |
| Level 3 |
| Total |
| Level 1 |
| Level 2 |
| Level 3 |
| Total | ||||||||||||||||
|
|
|
|
|
|
|
|
|
|
|
|
|
|
|
| ||||||||||||||||
| (In millions) | ||||||||||||||||||||||||||||||
Equity securities | $ | 59 | |
| $ | 71 | |
| $ | - | |
| $ | 130 | |
| $ | 42 | |
| $ | 66 | |
| $ | - | |
| $ | 108 | |
Debt securities | 12 | |
| 110 | |
| - | |
| 122 | |
| 8 | |
| 111 | |
| - | |
| 119 | | ||||||||
Insurance contracts | - | |
| - | |
| 38 | |
| 38 | |
| - | |
| - | |
| 40 | |
| 40 | | ||||||||
Other investments | - | |
| 12 | |
| - | |
| 12 | |
| - | |
| 12 | |
| - | |
| 12 | | ||||||||
Cash | 8 | |
| - | |
| - | |
| 8 | |
| 2 | |
| - | |
| - | |
| 2 | | ||||||||
Total | $ | 79 | |
| $ | 193 | |
| $ | 38 | |
| $ | 310 | |
| $ | 52 | |
| $ | 189 | |
| $ | 40 | |
| $ | 281 | |
The following table presents the activity in Level 3 instruments for each fiscal year:
| 2016 |
| 2015 |
| ||||
|
|
|
|
| ||||
| (In millions) | |||||||
Balance, beginning of year | $ | 40 | |
| $ | 41 | |
|
Actual return on plan assets: |
|
|
|
| ||||
Relating to assets still held at reporting date | (1 | ) |
| 2 | |
| ||
Purchases, sales, settlements, net | - | |
| 1 | |
| ||
Currency impact | (1 | ) |
| (4 | ) |
| ||
Balance, end of year | $ | 38 | |
| $ | 40 | |
|
Applied's investment strategy for its defined benefit plans is to invest plan assets in a prudent manner, maintaining well-diversified portfolios with the long-term objective of meeting the obligations of the plans as they come due. Asset allocation decisions are typically made by plan fiduciaries with input from Applied's international pension committee. Applied's asset allocation strategy incorporates a sufficient equity exposure in order for the plans to benefit from the expected better long-term performance of equities relative to the plans' liabilities. Applied retains investment managers, where appropriate, to manage the assets of the plans. Performance of investment managers is monitored by plan fiduciaries with the assistance of local investment consultants. The investment managers make investment decisions within the guidelines set forth by plan fiduciaries. Risk management practices include diversification across asset classes and investment styles, and periodic rebalancing toward target asset allocation ranges. Investment managers may use derivative instruments for efficient portfolio management purposes. Plan assets do not include any of Applied's own equity or debt securities.
90
Table of Contents
APPLIED MATERIALS, INC.
NOTES TO CONSOLIDATED FINANCIAL STATEMENTS - (Continued)
A summary of the components of net periodic benefit costs and the weighted average assumptions used for net periodic benefit cost and benefit obligation calculations for each fiscal year is presented below:
| 2016 |
| 2015 |
| 2014 | ||||||
|
|
|
|
|
| ||||||
| (In millions, except percentages) | ||||||||||
Components of net periodic benefit cost |
|
|
|
|
| ||||||
Service cost | $ | 13 | |
| $ | 15 | |
| $ | 17 | |
Interest cost | 13 | |
| 13 | |
| 17 | | |||
Expected return on plan assets | (14 | ) |
| (15 | ) |
| (14 | ) | |||
Amortization of actuarial loss and prior service credit | 3 | |
| 7 | |
| 4 | | |||
Settlement and curtailment loss | (5 | ) |
| (1 | ) |
| 3 | | |||
Net periodic benefit cost | $ | 10 | |
| $ | 19 | |
| $ | 27 | |
Weighted average assumptions |
|
|
|
|
| ||||||
Discount rate | 2.82 | % |
| 3.00 | % |
| 3.68 | % | |||
Expected long-term return on assets | 5.38 | % |
| 5.62 | % |
| 5.64 | % | |||
Rate of compensation increase | 2.71 | % |
| 2.74 | % |
| 3.29 | % | |||
Asset return assumptions are derived based on actuarial and statistical methodologies, from analysis of long-term historical data relevant to the country in which each plan is in effect and the investments applicable to the corresponding plan. The discount rate for each plan was derived by reference to appropriate benchmark yields on high quality corporate bonds, allowing for the approximate duration of both plan obligations and the relevant benchmark yields.
Future expected benefit payments for the pension plans and the post-retirement plan over the next ten fiscal years are as follows:
| Benefit Payments | ||
| (In millions) | ||
2017 | $ | 12 | |
2018 | 10 | | |
2019 | 11 | | |
2020 | 11 | | |
2021 | 11 | | |
2022-2026 | 68 | | |
| $ | 123 | |
Company contributions to these plans for fiscal 2017 are expected to be approximately $7 million .
Executive Deferred Compensation Plans
Applied sponsors two unfunded deferred compensation plans, the Executive Deferred Compensation Plan (Predecessor EDCP) and the 2016 Deferred Compensation Plan (2016 DCP) (formerly known as the 2005 Executive Deferred Compensation Plan), under which certain employees may elect to defer a portion of their following year's eligible earnings. The Predecessor EDCP was frozen as of December 31, 2004 such that no new deferrals could be made under the plan after that date and the plan would qualify for "grandfather" relief under Section 409A of the Code. The Predecessor EDCP participant accounts continue to be maintained under the plan and credited with deemed interest. The 2016 DCP was originally implemented by Applied effective as of January 1, 2005, and amended and restated as of October 12, 2015, and is intended to comply with the requirements of Section 409A of the Code. In addition, Applied also sponsors a non-qualified deferred compensation plan as a result of the acquisition of Varian. Amounts payable, including accrued deemed interest, totaled $40 million and $38 million at October 30, 2016 and October 25, 2015 , respectively, which were included in other liabilities in the Consolidated Balance Sheets.
91
Table of Contents
APPLIED MATERIALS, INC.
NOTES TO CONSOLIDATED FINANCIAL STATEMENTS - (Continued)
Note 12 | Income Taxes |
The components of income before income taxes for each fiscal year were as follows:
| 2016 |
| 2015 |
| 2014 | ||||||
|
|
|
|
|
| ||||||
| (In millions) | ||||||||||
U.S. | $ | 199 | |
| $ | 629 | |
| $ | 612 | |
Foreign | 1,814 | |
| 969 | |
| 836 | | |||
| $ | 2,013 | |
| $ | 1,598 | |
| $ | 1,448 | |
The components of the provision for income taxes for each fiscal year were as follows:
| 2016 |
| 2015 |
| 2014 | ||||||
|
|
|
|
|
| ||||||
| (In millions) | ||||||||||
Current: |
|
|
|
|
| ||||||
U.S. | $ | (36 | ) |
| $ | 134 | |
| $ | 270 | |
Foreign | 351 | |
| 199 | |
| 97 | | |||
State | (2 | ) |
| 18 | |
| 27 | | |||
| 313 | |
| 351 | |
| 394 | | |||
Deferred: |
|
|
|
|
| ||||||
U.S. | 55 | |
| (194 | ) |
| (9 | ) | |||
Foreign | (89 | ) |
| 69 | |
| (3 | ) | |||
State | 13 | |
| (5 | ) |
| (6 | ) | |||
| (21 | ) |
| (130 | ) |
| (18 | ) | |||
| $ | 292 | |
| $ | 221 | |
| $ | 376 | |
A reconciliation between the statutory U.S. federal income tax rate of 35 percent and Applied's actual effective income tax rate for each fiscal year is presented below:
| 2016 |
| 2015 |
| 2014 | |||
Tax provision at U.S. statutory rate | 35.0 | % |
| 35.0 | % |
| 35.0 | % |
Resolutions of prior years' income tax filings | 3.9 | |
| (4.9 | ) |
| 2.0 | |
Effect of foreign operations taxed at various rates | (24.1 | ) |
| (16.3 | ) |
| (10.9 | ) |
State income taxes, net of federal benefit | 0.6 | |
| 0.9 | |
| 1.0 | |
Research and other tax credits | (1.3 | ) |
| (0.2 | ) |
| (0.3 | ) |
U.S. domestic production deduction | (0.2 | ) |
| (0.6 | ) |
| (1.3 | ) |
Acquisition costs | - | |
| (1.1 | ) |
| 0.8 | |
Share-based compensation | 0.4 | |
| 0.8 | |
| 0.4 | |
Other | 0.2 | |
| 0.2 | |
| (0.7 | ) |
| 14.5 | % |
| 13.8 | % |
| 26.0 | % |
The effective tax rate for fiscal 2016 was higher than fiscal 2015 primarily due to resolutions and changes related to income tax liabilities for uncertain tax positions, partially offset by changes in the geographical composition of income.
The effective tax rate for fiscal 2015 was lower than fiscal 2014 due primarily to acquisition costs that became deductible in the second quarter of fiscal 2015 as a result of the termination of the proposed business combination with TEL, an adjustment in the second quarter of fiscal 2015 to correct an error in the recognition of cost of sales in the U.S. related to intercompany sales, reinstatement of the U.S. federal research and development tax credit during the first quarter of fiscal 2015 which was retroactive to its expiration in December 2013, resolutions and changes related to income tax liabilities for prior years, and changes in the geographical composition of income.
92
Table of Contents
APPLIED MATERIALS, INC.
NOTES TO CONSOLIDATED FINANCIAL STATEMENTS - (Continued)
In the reconciliation between the statutory U.S. federal income tax rate and the effective income tax rate for fiscal 2016 , the effect of foreign operations taxed at various rates represents the difference between an income tax provision at the U.S. federal statutory income tax rate and the recorded income tax provision, with the difference expressed as a percentage of worldwide income before income taxes. This effect is substantially related to the tax effect of pre-tax income in jurisdictions with lower statutory tax rates. The foreign operations with the most significant effective tax rate impact are Singapore and Israel. The statutory tax rates for fiscal 2016 for Singapore and Israel are 17% and 25% , respectively. Applied has been granted conditional reduced tax rates for both jurisdictions that expire in fiscal 2026 and fiscal 2017, respectively, excluding potential renewals and subject to certain conditions with which Applied expects to comply. The tax benefit arising from these tax rates was $ 254 million for fiscal 2016 or $ 0.23 per diluted share.
Deferred tax assets and liabilities are recognized for the estimated future tax effects of temporary differences between the book and tax bases of assets and liabilities. Deferred tax assets are also recognized for net operating loss and tax credit carryovers. Deferred tax assets are offset by a valuation allowance to the extent it is more likely than not that they are not expected to be realized. The components of deferred income tax assets and liabilities were as follows:
| October 30, |
| October 25, | ||||
|
|
|
| ||||
| (In millions) | ||||||
Deferred tax assets: |
|
|
| ||||
Allowance for doubtful accounts | $ | 20 | |
| $ | 20 | |
Inventory reserves and basis difference | 151 | |
| 155 | | ||
Installation and warranty reserves | 3 | |
| 11 | | ||
Accrued liabilities | 53 | |
| 106 | | ||
Deferred revenue | 17 | |
| 17 | | ||
Tax credits and net operating losses | 210 | |
| 196 | | ||
Deferred compensation | 45 | |
| 79 | | ||
Share-based compensation | 55 | |
| 53 | | ||
Other | 176 | |
| 150 | | ||
Gross deferred tax assets | 730 | |
| 787 | | ||
Valuation allowance | (207 | ) |
| (207 | ) | ||
Total deferred tax assets | 523 | |
| 580 | | ||
Deferred tax liabilities: |
|
|
| ||||
Fixed assets | (29 | ) |
| (15 | ) | ||
Intangible assets | (81 | ) |
| (91 | ) | ||
Undistributed foreign earnings | (42 | ) |
| (68 | ) | ||
Foreign exchange | - | |
| (4 | ) | ||
Total gross deferred tax liabilities | (152 | ) |
| (178 | ) | ||
Net deferred tax assets | $ | 371 | |
| $ | 402 | |
The following table presents the breakdown between current and non-current net deferred tax assets and liabilities:
| October 30, |
| October 25, | ||||
|
|
|
| ||||
| (In millions) | ||||||
Current deferred tax asset | $ | - | |
| $ | 403 | |
Non-current deferred tax asset | 372 | |
| 55 | | ||
Non-current deferred tax liability | (1 | ) |
| (56 | ) | ||
| $ | 371 | |
| $ | 402 | |
Non-current deferred tax liabilities are included in other liabilities on the Consolidated Balance Sheets.
93
Table of Contents
APPLIED MATERIALS, INC.
NOTES TO CONSOLIDATED FINANCIAL STATEMENTS - (Continued)
A valuation allowance is recorded to reflect the estimated amount of net deferred tax assets that may not be realized. Changes in the valuation allowance in each fiscal year were as follows:
| 2016 |
| 2015 |
| 2014 | ||||||
|
|
|
|
|
| ||||||
| (In millions) | ||||||||||
Beginning balance | $ | 207 | |
| $ | 173 | |
| $ | 116 | |
Increases | 27 | |
| 40 | |
| 60 | | |||
Decreases | (27 | ) |
| (6 | ) |
| (3 | ) | |||
Ending balance | $ | 207 | |
| $ | 207 | |
| $ | 173 | |
For fiscal 2016 , U.S. income taxes have not been provided for approximately $ 5.3 billion of cumulative undistributed earnings of several foreign subsidiaries. Applied intends to indefinitely reinvest these earnings in foreign operations. If these earnings were distributed to the U.S. in the form of dividends or otherwise, or if the shares of the relevant foreign subsidiaries were sold or otherwise transferred, Applied would be subject to additional U.S. income taxes (subject to an adjustment for foreign tax credits) and foreign withholding taxes. Determination of the amount of unrecognized deferred income tax liability related to these earnings is not practicable.
At October 30, 2016 , Applied has state research and development tax credit carryforwards of $207 million , including $171 million of credits that are carried over until exhausted and $36 million that are carried over for 15 years and begin to expire in fiscal 2021. Applied has net operating loss carryforwards in state jurisdictions of $16 million which begin to expire in fiscal 2018. Management believes it is more likely than not that all net operating loss and tax credit carryforwards at October 30, 2016 , net of valuation allowance, will be utilized.
Applied's income taxes payable have been reduced by the tax benefits associated with share-based compensation. These benefits, credited directly to additional paid-in capital with a corresponding reduction to taxes payable, amounted to $23 million , $56 million and $27 million for fiscal 2016 , 2015 and 2014 , respectively.
Applied maintains liabilities for uncertain tax positions. These liabilities involve considerable judgment and estimation and are continuously monitored by management based on the best information available. Gross unrecognized tax benefits are classified as non-current income taxes payable in other liabilities in the Consolidated Balance Sheets. A reconciliation of the beginning and ending balances of gross unrecognized tax benefits in each fiscal year is as follows:
| 2016 |
| 2015 |
| 2014 | ||||||
|
|
|
|
|
| ||||||
| (In millions) | ||||||||||
Beginning balance of gross unrecognized tax benefits | $ | 177 | |
| $ | 134 | |
| $ | 194 | |
Settlements with tax authorities | (25 | ) |
| (16 | ) |
| (143 | ) | |||
Lapses of statutes of limitation | (2 | ) |
| (1 | ) |
| (2 | ) | |||
Increases in tax positions for current year | 62 | |
| 43 | |
| 52 | | |||
Increases in tax positions for prior years | 109 | |
| 21 | |
| 42 | | |||
Decreases in tax positions for prior years | (1 | ) |
| (4 | ) |
| (9 | ) | |||
Ending balance of gross unrecognized tax benefits | $ | 320 | |
| $ | 177 | |
| $ | 134 | |
94
Table of Contents
APPLIED MATERIALS, INC.
NOTES TO CONSOLIDATED FINANCIAL STATEMENTS - (Continued)
In the provision for income taxes in the Consolidated Statements of Operations, a tax expense of $24 million , a tax benefit of $6 million , and a tax expense of $18 million , were realized in fiscal 2016 , 2015 and 2014 , respectively, related to interest and penalties on unrecognized tax benefits. The liability for interest and penalties for fiscal 2016 , 2015 and 2014 was $33 million , $14 million and $25 million , respectively, and was classified as non-current income taxes payable.
Included in the balance of unrecognized tax benefits for fiscal 2016 , 2015 and 2014 are $302 million , $167 million , and $124 million , respectively, of tax benefits that, if recognized, would affect the effective tax rate. Also included in the ending balance of unrecognized tax benefits for fiscal 2016 , 2015 and 2014 are $8 million , $9 million , and $9 million , respectively, of tax benefits that, if recognized, would result in adjustments to other tax accounts, primarily non-current deferred tax assets.
In fiscal 2016 , Applied accrued $25 million , including interest and penalties, as a result of a settlement of fiscal 2011 through fiscal 2015 in Switzerland. This settlement resulted in the recognition of a tax expense of $19 million . In fiscal 2015 , Applied paid $19 million , including interest and penalties, as a result of a settlement of fiscal 2009 through fiscal 2011 in Italy and paid $2 million , including interest, as a result of a settlement of fiscal 2013 in Switzerland related to Varian. These settlements resulted in the recognition of a tax benefit of $10 million . In fiscal 2014 , Applied received a refund of $18 million , including interest, as a result of a settlement of fiscal 2008 through fiscal 2012 in Korea, and received a refund of $17 million , including interest, as a result of a settlement with the Internal Revenue Service for fiscal 2010 related to Varian. These settlements resulted in the recognition of a tax benefit of $3 million .
A number of Applied's tax returns remain subject to examination by taxing authorities. These include U.S. federal and state returns for fiscal 2010 and later years , and foreign tax returns for fiscal 2009 and later years .
The timing of the resolution of income tax examinations, as well as the amounts and timing of various tax payments that may be part of the settlement process, is highly uncertain. This could cause fluctuations in Applied's financial condition and results of operations. Applied continues to have ongoing negotiations with various taxing authorities throughout the year.
Note 13 | Warranty, Guarantees, Commitments and Contingencies |
Leases
Applied leases some of its facilities and equipment under non-cancelable operating leases and has options to renew most leases, with rentals to be negotiated. Total rent expense for fiscal 2016 , 2015 and 2014 , was $38 million , $32 million and $37 million , respectively.
As of October 30, 2016 , future minimum lease payments are expected to be as follows:
| Lease Payments | ||
Fiscal | (In millions) | ||
2017 | $ | 26 | |
2018 | 17 | | |
2019 | 10 | | |
2020 | 5 | | |
2021 | 2 | | |
Thereafter | 6 | | |
| $ | 66 | |
95
Table of Contents
APPLIED MATERIALS, INC.
NOTES TO CONSOLIDATED FINANCIAL STATEMENTS - (Continued)
Warranty
Changes in the warranty reserves during each fiscal year were as follows:
| 2016 |
| 2015 |
| 2014 | ||||||
|
|
|
|
|
| ||||||
| (In millions) | ||||||||||
Beginning balance | $ | 126 | |
| $ | 113 | |
| $ | 102 | |
Provisions for warranty | 135 | |
| 127 | |
| 132 | | |||
Changes in reserves related to preexisting warranty | (12 | ) |
| (10 | ) |
| (17 | ) | |||
Consumption of reserves | (96 | ) |
| (104 | ) |
| (104 | ) | |||
Ending balance | $ | 153 | |
| $ | 126 | |
| $ | 113 | |
Applied products are generally sold with a warranty for a 12-month period following installation. The provision for the estimated cost of warranty is recorded when revenue is recognized. Parts and labor are covered under the terms of the warranty agreement. The warranty provision is based on historical experience by product, configuration and geographic region. Quarterly warranty consumption is generally associated with sales that occurred during the preceding four quarters, and quarterly warranty provisions are generally related to the current quarter's sales.
Guarantees
In the ordinary course of business, Applied provides standby letters of credit or other guarantee instruments to third parties as required for certain transactions initiated by either Applied or its subsidiaries. As of October 30, 2016 , the maximum potential amount of future payments that Applied could be required to make under these guarantee agreements was approximately $52 million . Applied has not recorded any liability in connection with these guarantee agreements beyond that required to appropriately account for the underlying transaction being guaranteed. Applied does not believe, based on historical experience and information currently available, that it is probable that any amounts will be required to be paid under these guarantee agreements.
Applied also has agreements with various banks to facilitate subsidiary banking operations worldwide, including overdraft arrangements, issuance of bank guarantees, and letters of credit. As of October 30, 2016 , Applied has provided parent guarantees to banks for approximately $100 million to cover these arrangements.
Legal Matters
Korea Criminal Proceedings
In 2010, the Seoul Eastern District Court began hearings on indictments brought by the Seoul Prosecutor's Office for the Eastern District of Korea (the Prosecutor's Office) alleging that employees of several companies improperly received and used confidential information belonging to Samsung Electronics Co., Ltd. (Samsung), a major Applied customer based in Korea. The individuals charged included the former head of Applied Materials Korea (AMK), who at the time of the indictment was a vice president of Applied Materials, Inc., and certain other AMK employees. Neither Applied nor any of its subsidiaries was named as a party to the proceedings. Hearings on these matters concluded in November 2012 and the Court issued its decision on February 7, 2013. As part of the ruling, nine AMK employees (including the former head of AMK) were acquitted of all charges, while one AMK employee was found guilty on some of the charges and received a suspended jail sentence. The Prosecutor's Office and various individuals appealed the matter to the High Court. On June 20, 2014, the High Court rendered its decision, finding all defendants not guilty, including all ten AMK employees. The prosecutor has appealed the High Court decision to the Korean Supreme Court.
Other Matters
From time to time, Applied receives notification from third parties, including customers and suppliers, seeking indemnification, litigation support, payment of money or other actions by Applied in connection with claims made against them. In addition, from time to time, Applied receives notification from third parties claiming that Applied may be or is infringing or misusing their intellectual property or other rights. Applied also is subject to various other legal proceedings and claims, both asserted and unasserted, that arise in the ordinary course of business.
Although the outcome of the above-described matters, claims and proceedings cannot be predicted with certainty, Applied does not believe that any will have a material effect on its consolidated financial condition or results of operations.
96
Table of Contents
APPLIED MATERIALS, INC.
NOTES TO CONSOLIDATED FINANCIAL STATEMENTS - (Continued)
Note 14 | Industry Segment Operations |
Applied's three reportable segments are: Semiconductor Systems, Applied Global Services, and Display and Adjacent Markets. As defined under the accounting literature, Applied's chief operating decision-maker has been identified as the President and Chief Executive Officer, who reviews operating results to make decisions about allocating resources and assessing performance for the entire Company. Segment information is presented based upon Applied's management organization structure as of October 30, 2016 and the distinctive nature of each segment. Future changes to this internal financial structure may result in changes to Applied's reportable segments.
Effective in the third quarter of fiscal 2016, Applied began to account for its flexible coating systems (previously included in the Energy and Environmental Solutions segment) and display upgrade equipment (previously included in the Applied Global Services segment) under the Display and Adjacent Markets segment (previously Display). As a result of these changes, Applied's solar business (previously in the Energy and Environmental Solutions segment) is included in Corporate and Other as it did not meet the threshold as a separate reportable segment. Results for prior periods have been recast to conform to the current presentation, which reflects the new organizational structure.
The Semiconductor Systems reportable segment includes semiconductor capital equipment for etch, rapid thermal processing, deposition, chemical mechanical planarization, metrology and inspection, wafer packaging, and ion implantation.
The Applied Global Services segment provides integrated solutions to optimize equipment and fab performance and productivity, including spares, upgrades, services, certain remanufactured earlier generation equipment and factory automation software for semiconductor, display and other products.
The Display and Adjacent Markets segment includes products for manufacturing liquid crystal displays (LCDs), organic light-emitting diodes (OLEDs), upgrades and flexible coating systems and other display technologies for TVs, personal computers, smart phones, and other consumer-oriented devices.
Each operating segment is separately managed and has separate financial results that are reviewed by Applied's chief operating decision-maker. Each reportable segment contains closely related products that are unique to the particular segment. Segment operating income is determined based upon internal performance measures used by Applied's chief operating decision-maker. The chief operating decision-maker does not evaluate operating segments using total asset information.
Applied derives the segment results directly from its internal management reporting system. The accounting policies Applied uses to derive reportable segment results are substantially the same as those used for external reporting purposes. Management measures the performance of each reportable segment based upon several metrics including orders, net sales and operating income. Management uses these results to evaluate the performance of, and to assign resources to, each of the reportable segments.
The Corporate and Other category includes revenues from products, as well as costs of products sold, for fabricating solar photovoltaic cells and modules, and certain operating expenses that are not allocated to its reportable segments and are managed separately at the corporate level. These operating expenses include costs related to share-based compensation; certain management, finance, legal, human resources, and research, development and engineering functions provided at the corporate level; and unabsorbed information technology and occupancy. In addition, Applied does not allocate to its reportable segments restructuring and asset impairment charges and any associated adjustments related to restructuring actions, unless these actions pertain to a specific reportable segment. Segment operating income also excludes interest income/expense and other financial charges and income taxes. Management does not consider the unallocated costs in measuring the performance of the reportable segments.
97
Table of Contents
APPLIED MATERIALS, INC.
NOTES TO CONSOLIDATED FINANCIAL STATEMENTS - (Continued)
Information for each reportable segment for and as of the end of each fiscal year were as follows:
| Net Sales |
| Operating Income (Loss) |
| Depreciation/ Amortization |
| Capital |
| Accounts Receivable |
| Inventories | ||||||||||||
|
|
|
|
|
|
|
|
|
|
|
| ||||||||||||
| (In millions) | ||||||||||||||||||||||
2016: |
|
|
|
|
|
|
|
|
|
|
| ||||||||||||
Semiconductor Systems | $ | 6,873 | |
| $ | 1,807 | |
| $ | 277 | |
| $ | 114 | |
| $ | 1,524 | |
| $ | 1,188 | |
Applied Global Services | 2,589 | |
| 682 | |
| 12 | |
| 14 | |
| 559 | |
| 594 | | ||||||
Display and Adjacent Markets | 1,206 | |
| 245 | |
| 5 | |
| 6 | |
| 238 | |
| 215 | | ||||||
Corporate and Other | 157 | |
| (582 | ) |
| 95 | |
| 119 | |
| (42 | ) |
| 53 | | ||||||
Total | $ | 10,825 | |
| $ | 2,152 | |
| $ | 389 | |
| $ | 253 | |
| $ | 2,279 | |
| $ | 2,050 | |
2015: |
|
|
|
|
|
|
|
|
|
|
| ||||||||||||
Semiconductor Systems | $ | 6,135 | |
| $ | 1,410 | |
| $ | 268 | |
| $ | 115 | |
| $ | 1,160 | |
| $ | 1,079 | |
Applied Global Services | 2,447 | |
| 630 | |
| 10 | |
| 12 | |
| 483 | |
| 555 | | ||||||
Display and Adjacent Markets | 944 | |
| 191 | |
| 6 | |
| 13 | |
| 129 | |
| 176 | | ||||||
Corporate and Other | 133 | |
| (538 | ) |
| 87 | |
| 75 | |
| (33 | ) |
| 23 | | ||||||
Total | $ | 9,659 | |
| $ | 1,693 | |
| $ | 371 | |
| $ | 215 | |
| $ | 1,739 | |
| $ | 1,833 | |
2014: |
|
|
|
|
|
|
|
|
|
|
| ||||||||||||
Semiconductor Systems | $ | 5,978 | |
| $ | 1,391 | |
| $ | 268 | |
| $ | 134 | |
| $ | 1,146 | |
| $ | 955 | |
Applied Global Services | 2,114 | |
| 538 | |
| 11 | |
| 7 | |
| 422 | |
| 431 | | ||||||
Display and Adjacent Markets | 848 | |
| 202 | |
| 7 | |
| 4 | |
| 157 | |
| 117 | | ||||||
Corporate and Other | 132 | |
| (611 | ) |
| 89 | |
| 96 | |
| (55 | ) |
| 64 | | ||||||
Total | $ | 9,072 | |
| $ | 1,520 | |
| $ | 375 | |
| $ | 241 | |
| $ | 1,670 | |
| $ | 1,567 | |
The reconciling items included in Corporate and Other were as follows:
| 2016 |
| 2015 |
| 2014 | ||||||
|
|
|
|
|
| ||||||
| (In millions) | ||||||||||
Unallocated net sales | $ | 157 | |
| $ | 133 | |
| $ | 132 | |
Unallocated cost of products sold and expenses | (538 | ) |
| (523 | ) |
| (523 | ) | |||
Share-based compensation | (201 | ) |
| (187 | ) |
| (177 | ) | |||
Certain items associated with terminated business combination | - | |
| (50 | ) |
| (73 | ) | |||
Gain (loss) on derivatives associated with terminated business combination | - | |
| 89 | |
| 30 | | |||
Total | $ | (582 | ) |
| $ | (538 | ) |
| $ | (611 | ) |
98
Table of Contents
APPLIED MATERIALS, INC.
NOTES TO CONSOLIDATED FINANCIAL STATEMENTS - (Continued)
For geographical reporting, revenue by geographic location is determined by the location of customers' facilities to which products were shipped. Long-lived assets consist primarily of property, plant and equipment and are attributed to the geographic location in which they are located. Net sales and long-lived assets by geographic region for and as of each fiscal year were as follows:
| 2016 |
| 2015 |
| 2014 | ||||||
|
|
|
|
|
| ||||||
| (In millions) | ||||||||||
Net sales: |
|
|
|
|
| ||||||
United States | $ | 1,143 | |
| $ | 1,630 | |
| $ | 1,966 | |
Taiwan | 2,843 | |
| 2,600 | |
| 2,702 | | |||
China | 2,259 | |
| 1,623 | |
| 1,608 | | |||
Korea | 1,883 | |
| 1,654 | |
| 965 | | |||
Japan | 1,279 | |
| 1,078 | |
| 817 | | |||
Europe | 615 | |
| 642 | |
| 658 | | |||
Southeast Asia | 803 | |
| 432 | |
| 356 | | |||
Total outside United States | 9,682 | |
| 8,029 | |
| 7,106 | | |||
Consolidated total | $ | 10,825 | |
| $ | 9,659 | |
| $ | 9,072 | |
| October 30, |
| October 25, | ||||
|
|
|
| ||||
| (In millions) | ||||||
Long-lived assets: |
|
|
| ||||
United States | $ | 798 | |
| $ | 705 | |
Taiwan | 34 | |
| 39 | | ||
China | 44 | |
| 46 | | ||
Korea | 12 | |
| 12 | | ||
Japan | 8 | |
| 6 | | ||
Europe | 34 | |
| 75 | | ||
Southeast Asia | 85 | |
| 73 | | ||
Total outside United States | 217 | |
| 251 | | ||
Consolidated total | $ | 1,015 | |
| $ | 956 | |
The following customers accounted for at least 10 percent of Applied's net sales in each fiscal year, which were for products in multiple reportable segments:
| 2016 |
| 2015 |
| 2014 | |||
Taiwan Semiconductor Manufacturing Company Limited | 16 | % |
| 15 | % |
| 21 | % |
Samsung Electronics Co., Ltd. | 13 | % |
| 18 | % |
| 12 | % |
Intel Corporation | 11 | % |
| * | |
| * | |
Micron Technology, Inc. | 11 | % |
| * | |
| * | |
99
Table of Contents
APPLIED MATERIALS, INC.
NOTES TO CONSOLIDATED FINANCIAL STATEMENTS - (Continued)
Note 15 | Unaudited Quarterly Consolidated Financial Data |
| Fiscal Quarter |
|
| ||||||||||||||||
| First |
| Second |
| Third |
| Fourth |
| Fiscal Year | ||||||||||
|
|
|
|
|
|
|
|
|
| ||||||||||
| (In millions, except per share amounts) | ||||||||||||||||||
2016: |
|
|
|
|
|
|
|
|
| ||||||||||
Net sales | $ | 2,257 | |
| $ | 2,450 | |
| $ | 2,821 | |
| $ | 3,297 | |
| $ | 10,825 | |
Gross profit | $ | 916 | |
| $ | 1,004 | |
| $ | 1,192 | |
| $ | 1,399 | |
| $ | 4,511 | |
Net income | $ | 286 | |
| $ | 320 | |
| $ | 505 | |
| $ | 610 | |
| $ | 1,721 | |
Earnings per diluted share | $ | 0.25 | |
| $ | 0.29 | |
| $ | 0.46 | |
| $ | 0.56 | |
| $ | 1.54 | |
2015: |
|
|
|
|
|
|
|
| |||||||||||
Net sales | $ | 2,359 | |
| $ | 2,442 | |
| $ | 2,490 | |
| $ | 2,368 | |
| $ | 9,659 | |
Gross profit | $ | 959 | |
| $ | 1,016 | |
| $ | 1,018 | |
| $ | 959 | |
| $ | 3,952 | |
Net income | $ | 348 | |
| $ | 364 | |
| $ | 329 | |
| $ | 336 | |
| $ | 1,377 | |
Earnings per diluted share | $ | 0.28 | |
| $ | 0.29 | |
| $ | 0.27 | |
| $ | 0.28 | |
| $ | 1.12 | |
100
Table of Contents
INDEX TO EXHIBITS
These Exhibits are numbered in accordance with the Exhibit Table of Item 601 of Regulation S-K:
|
| Incorporated by Reference | |||
Exhibit No. | Description | Form | File No. | Exhibit No. | Filing Date |
3.1 | Certificate of Incorporation of Applied Materials, Inc., as amended and restated through March 10, 2009 | 10-Q | 000-06920 | 3.1 | 6/3/2009 |
3.2 | Certificate of Designation, Preferences and Rights of the Terms of the Series A Junior Participating Preferred Stock dated as of July 9, 1999 | 10-Q | 000-06920 | 3(i)(a) | 9/14/1999 |
3.3 | Amended and Restated Bylaws of Applied Materials, Inc., amended as of December 8, 2015 | 8-K | 000-06920 | 3.1 | 12/11/2015 |
4.1 | Form of Indenture (including form of debt security) between Applied Materials, Inc. and Harris Trust Company of California, as Trustee | 8-K | 000-06920 | 4.1 | 8/17/1994 |
4.2 | Indenture, dated June 8, 2011, by and between Applied Materials, Inc. and U.S. Bank National Association, as Trustee | 8-K | 000-06920 | 4.1 | 6/10/2011 |
4.3 | First Supplemental Indenture, dated June 8, 2011, by and between Applied Materials, Inc. and U.S. Bank National Association, as Trustee | 8-K | 000-06920 | 4.2 | 6/10/2011 |
4.4 | Second Supplemental Indenture, dated September 24, 2015, by and between Applied Materials, Inc. and U.S. Bank National Association, as Trustee | 8-K | 000-06920 | 4.1 | 9/24/2015 |
10.1 | Form of Indemnification Agreement between Applied Materials, Inc. and Non-Employee Directors | 10-K | 000-06920 | 10.44 | 1/31/2000 |
10.2 | Form of Indemnification Agreement between Applied Materials, Inc. and certain of its officers | 10-K | 000-06920 | 10.46 | 1/31/2000 |
10.3 | Applied Materials, Inc. Profit Sharing Scheme (Ireland) | S-8 | 333-45011 | 4.1 | 1/27/1998 |
10.4* | Applied Materials, Inc. amended and restated Relocation Policy | 8-K | 000-06920 | 10.46 | 10/31/2005 |
10.5* | Applied Materials Inc. Employee Financial Assistance Plan, amended and restated as of December 18, 2008 | 10-Q | 000-06920 | 10.58 | 3/3/2009 |
10.6 | Deed of Amendment to Applied Materials Profit Sharing Scheme, dated February 7, 2006, to amend Clause 20 of the Trust Deed thereunder | 10-K | 000-06920 | 10.48 | 12/12/2008 |
10.7 | Deed of Amendment to Applied Materials Profit Sharing Scheme, dated February 7, 2006, to amend the definition of Eligible Employee in the First Schedule to the Trust Deed thereunder. | 10-K | 000-06920 | 10.49 | 12/12/2008 |
10.8* | Applied Materials, Inc. Employee Stock Incentive Plan, amended and restated effective March 6, 2012 | 8-K | 000-06920 | 10.1 | 3/9/2012 |
10.9* | Applied Materials, Inc. Senior Executive Bonus Plan, amended and restated effective March 6, 2012 | 8-K | 000-06920 | 10.2 | 3/9/2012 |
10.10* | Form of Restricted Stock Unit Agreement for use under the amended and restated Applied Materials, Inc. Employee Stock Incentive Plan | 10-Q | 000-06920 | 10.3 | 5/24/2012 |
10.11* | Form of Restricted Stock Unit Agreement for Nonemployee Directors for use under the amended and restated Applied Materials, Inc. Employee Stock Incentive Plan | 10-Q | 000-06920 | 10.4 | 5/24/2012 |
|
|
|
|
|
|
|
|
|
|
|
|
|
|
|
|
|
|
|
|
|
|
|
|
|
|
|
|
|
|
101
Table of Contents
|
| Incorporated by Reference | |||
Exhibit No. | Description | Form | File No. | Exhibit No. | Filing Date |
10.12* | Form of Performance Shares Agreement for use under the amended and restated Applied Materials, Inc. Employee Stock Incentive Plan | 10-Q | 000-06920 | 10.5 | 5/24/2012 |
10.13* | Form of Restricted Stock Agreement for use under the amended and restated Applied Materials, Inc. Employee Stock Incentive Plan | 10-Q | 000-06920 | 10.3 | 8/23/2012 |
10.14* | Applied Materials, Inc. Employees' Stock Purchase Plan, amended and restated effective October 28, 2012 | 10-K | 000-06920 | 10.54 | 12/5/2012 |
10.15* | Offer Letter, dated August 14, 2013, between Applied Materials, Inc. and Gary E. Dickerson | 10-Q | 000-06920 | 10.2 | 8/22/2013 |
10.16* | Form of Non-Qualified Stock Option Agreement for Employees for use under the Applied Materials, Inc. Employee Stock Incentive Plan, as amended | 10-Q | 000-06920 | 10.4 | 8/22/2013 |
10.17* | Form of Retention Bonus and Equity Award Amendment Agreement entered into between Applied Materials, Inc. and certain officers identified in the attached schedule | 10-K | 000-06920 | 10.53 | 12/4/2013 |
10.18* | Form of Performance Unit Agreement for use under the Applied Materials, Inc. Employee Stock Incentive Plan, as amended | 10-Q | 000-06920 | 10.2 | 2/20/2014 |
10.19* | Form of Letter of Understanding for Long-Term Assignment | 10-K | 000-06920 | 10.49 | 12/17/2014 |
10.20* | Form of Amendment to Retention Bonus and Equity Award Amendment Agreement entered into between Applied Materials, Inc. and certain officers identified in the attached schedule | 10-Q | 000-06920 | 10.2 | 2/19/2015 |
10.21* | Applied Materials, Inc. Applied Incentive Plan, amended and restated effective October 27, 2014 | 10-Q | 000-06920 | 10.4 | 2/19/2015 |
10.22* | Form of Performance Shares Agreement for fiscal 2015 performance-based equity awards for certain executive officers under the amended and restated Applied Materials, Inc. Employee Stock Incentive Plan | 10-Q | 000-06920 | 10.5 | 2/19/2015 |
10.23 | Credit Agreement, dated as of September 3, 2015, among Applied Materials, Inc., JPMorgan Chase Bank, N.A., as administrative agent, and other lenders named therein | 8-K | 000-06920 | 10.1 | 9/9/2015 |
10.24* | Separation Agreement and Release, dated as of August 7, 2015, by and between Randhir Thakur and Applied Materials, Inc. | 8-K | 000-06920 | 10.1 | 8/10/2015 |
10.25* | Applied Materials, Inc. Stock Purchase Plan for Offshore Employees, amended and restated effective July 15, 2015 | 10-K | 000-06920 | 10.32 | 12/9/2015 |
10.26* | Applied Materials, Inc. 2016 Deferred Compensation Plan | 10-K | 000-06920 | 10.33 | 12/9/2015 |
21 | Subsidiaries of Applied Materials, Inc.† |
|
|
|
|
23 | Consent of Independent Registered Public Accounting Firm, KPMG LLP† |
|
|
|
|
|
|
|
|
|
|
|
|
|
|
|
|
|
|
|
|
|
|
|
|
|
|
|
|
|
|
|
|
|
|
|
|
|
|
|
|
|
|
|
|
|
|
102
Table of Contents
|
| Incorporated by Reference | |||
Exhibit No. | Description | Form | File No. | Exhibit No. | Filing Date |
24 | Power of Attorney (included on the signature page of this Annual Report on Form 10-K)† |
|
|
|
|
31.1 | Certification of Chief Executive Officer Pursuant to Section 302 of the Sarbanes-Oxley Act of 2002† |
|
|
|
|
31.2 | Certification of Chief Financial Officer Pursuant to Section 302 of the Sarbanes-Oxley Act of 2002† |
|
|
|
|
32.1 | Certification Pursuant to 18 U.S.C. Section 1350, as adopted pursuant to Section 906 of the Sarbanes-Oxley Act of 2002‡ |
|
|
|
|
32.2 | Certification Pursuant to 18 U.S.C. Section 1350, as adopted pursuant to Section 906 of the Sarbanes-Oxley Act of 2002‡ |
|
|
|
|
101.INS | XBRL Instance Document‡ |
|
|
|
|
101.SCH | XBRL Taxonomy Extension Schema Document‡ |
|
|
|
|
101.CAL | XBRL Taxonomy Extension Calculation Linkbase Document‡ |
|
|
|
|
101.DEF | XBRL Taxonomy Extension Definition Linkbase Document‡ |
|
|
|
|
101.LAB | XBRL Taxonomy Extension Label Linkbase Document‡ |
|
|
|
|
101.PRE | XBRL Taxonomy Extension Presentation Linkbase Document‡ |
|
|
|
|
|
|
|
|
|
|
* | Indicates a management contract or compensatory plan or arrangement, as required by Item 15(a)(3). |
† | Filed herewith. |
‡ | Furnished herewith. |
103
Table of Contents
SIGNATURES
Pursuant to the requirements of Section 13 or 15(d) of the Securities Exchange Act of 1934, the registrant has duly caused this report to be signed on its behalf by the undersigned, thereunto duly authorized.
APPLIED MATERIALS, INC. | |
|
|
By: | / S / GARY E. DICKERSON |
| Gary E. Dickerson |
| President, Chief Executive Officer |
Dated: December 15, 2016
POWER OF ATTORNEY
KNOW ALL PERSONS BY THESE PRESENTS, that each person whose signature appears below constitutes and appoints Gary E. Dickerson, Robert J. Halliday and Thomas F. Larkins, jointly and severally, his or her attorneys-in-fact, each with the power of substitution, for him or her in any and all capacities, to sign any amendments to this Annual Report on Form 10-K, and to file the same, with exhibits thereto and other documents in connection therewith, with the Securities and Exchange Commission, hereby ratifying and confirming all that each of said attorneys-in-fact, or his substitute or substitutes, may do or cause to be done by virtue hereof.
******
Pursuant to the requirements of the Securities Exchange Act of 1934, this report has been signed below by the following persons on behalf of the registrant and in the capacities and on the dates indicated.
| Title | Date |
/ S / GARY E. DICKERSON | President, Chief Executive Officer and Director (Principal Executive Officer) | December 15, 2016 |
Gary E. Dickerson |
| |
/ S / ROBERT J. HALLIDAY | Senior Vice President, Chief Financial Officer (Principal Financial Officer) | December 15, 2016 |
Robert J. Halliday |
| |
/ S / CHARLES W. READ | Corporate Vice President, Corporate Controller and Chief Accounting Officer (Principal Accounting Officer) | December 15, 2016 |
Charles W. Read |
| |
|
|
|
/ S / WILLEM P. ROELANDTS |
|
|
Willem P. Roelandts | Chairman of the Board | December 15, 2016 |
/ S / JUDY BRUNER |
|
|
Judy Bruner | Director | December 15, 2016 |
/ S / XUN CHEN |
|
|
Xun Chen | Director | December 15, 2016 |
/ S / AART J. DE GEUS |
|
|
Aart J. de Geus | Director | December 15, 2016 |
/ S / STEPHEN R. FORREST |
|
|
Stephen R. Forrest | Director | December 15, 2016 |
/ S / THOMAS J. IANNOTTI |
|
|
Thomas J. Iannotti | Director | December 15, 2016 |
/ S / SUSAN M. JAMES |
|
|
Susan M. James | Director | December 15, 2016 |
/ S / ALEXANDER A. KARSNER |
|
|
Alexander A. Karsner | Director | December 15, 2016 |
/ S / ADRIANNA C. MA |
|
|
Adrianna C. Ma | Director | December 15, 2016 |
/ S / DENNIS D. POWELL |
|
|
Dennis D. Powell | Director | December 15, 2016 |
104