UNITED STATES
SECURITIES AND EXCHANGE COMMISSION
Washington, D.C. 20549
Form 10-K
☒ | ANNUAL REPORT PURSUANT TO SECTION 13 OR 15(d) OF THE SECURITIES EXCHANGE ACT OF 1934 |
For the Fiscal Year Ended January 28, 2017
OR
☐ | TRANSITION REPORT PURSUANT TO SECTION 13 OR 15(d) OF THE SECURITIES EXCHANGE ACT OF 1934 |
Commission File Number: 1-33338
American Eagle Outfitters, Inc.
(Exact name of registrant as specified in its charter)
Delaware (State or other jurisdiction of incorporation or organization) | No. 13-2721761 (I.R.S. Employer Identification No.) |
|
|
77 Hot Metal Street, Pittsburgh, PA | 15203-2329 |
(Address of principal executive offices) | (Zip Code) |
Registrant's telephone number, including area code:
(412) 432-3300
Securities registered pursuant to Section 12(b) of the Act:
Common Shares, $0.01 par value (Title of class) | New York Stock Exchange (Name of each exchange on which registered) |
Securities registered pursuant to Section 12(g) of the Act:
None
Indicate by check mark if the registrant is a well-known seasoned issuer, as defined in Rule 405 of the Securities Act. YES ☒ NO ☐
Indicate by check mark if the registrant is not required to file reports pursuant to Section 13 or Sections 15(d) of the Act. YES ☐ NO ☒
Indicate by check mark whether the registrant (1) has filed all reports required to be filed by Section 13 or 15(d) of the Securities Exchange Act of 1934 during the preceding 12 months (or for such shorter period that the registrant was required to file such reports), and (2) has been subject to the filing requirements for at the past 90 days. YES ☒ NO ☐
Indicate by check mark whether the registrant has submitted electronically and posted on its corporate Web site, if any, every Interactive Data File required to be submitted and posted pursuant to Rule 405 of Regulation S-T (§232.405 of this chapter) during the preceding 12 months (or for such shorter period that the registrant was required to submit and post such files). YES ☒ NO ☐
Indicate by check mark if disclosure of delinquent filers pursuant to Item 405 of Regulation S-K (§229.405 of this chapter) is not contained herein, and will not be contained, to the best of registrant's knowledge, in definitive proxy or information statements incorporated by reference in Part III of this Form 10-K or any amendment to this Form 10-K. ☐
Indicate by check mark whether the registrant is a large accelerated filer, an accelerated filer, a non-accelerated filer, or a smaller reporting company. See the definitions of "large accelerated filer," "accelerated filer" and "smaller reporting company" in Rule 12b-2 of the Exchange Act. (Check one):
Large accelerated filer | ☒ |
| Accelerated filer | ☐ |
Non-accelerated filer | ☐ | (Do not check if a smaller reporting company) | Smaller reporting company | ☐ |
Indicate by check mark whether the registrant is a shell company (as defined in Rule 12b-2 of the Act). YES ☐ NO ☒
The aggregate market value of voting and non-voting common equity held by non-affiliates of the registrant as of July 30, 2016 was $2,983,485,568.
Indicate the number of shares outstanding of each of the registrant's classes of common stock, as of the latest practicable date: 182,221,528 Common Shares were outstanding at March 6, 2017.
DOCUMENTS INCORPORATED BY REFERENCE
Part III - Proxy Statement for 2017 Annual Meeting of Stockholders, in part, as indicated.
AMERICAN EAGLE OUTFITTERS, INC.
TABLE OF CONTENTS
| Page Number |
PART I |
|
Item 1. Business | 3 |
Item 1A. Risk Factors | 9 |
Item 1B. Unresolved Staff Comments | 13 |
Item 2. Properties | 13 |
Item 3. Legal Proceedings | 14 |
Item 4. Mine Safety Disclosures | 14 |
|
|
PART II |
|
Item 5. Market for the Registrant's Common Equity, Related Stockholder Matters and Issuer Purchases of Equity Securities | 14 |
Item 6. Selected Consolidated Financial Data | 17 |
Item 7. Management's Discussion and Analysis of Financial Condition and Results of Operations | 18 |
Item 7A. Quantitative and Qualitative Disclosures About Market Risk | 31 |
Item 8. Financial Statements and Supplementary Data | 32 |
Item 9. Changes in and Disagreements with Accountants on Accounting and Financial Disclosure | 59 |
Item 9A. Controls and Procedures | 59 |
Item 9B. Other Information | 62 |
|
|
PART III |
|
Item 10. Directors, Executive Officers and Corporate Governance | 62 |
Item 11. Executive Compensation | 62 |
Item 12. Security Ownership of Certain Beneficial Owners and Management and Related Stockholder Matters | 62 |
Item 13. Certain Relationships and Related Transactions, and Director Independence | 62 |
Item 14. Principal Accounting Fees and Services | 62 |
|
|
PART IV |
|
Item 15. Exhibits, Financial Statement Schedules | 63 |
2
PART I
Item 1. Business.
General
American Eagle Outfitters, Inc., ("AEO Inc.," the "Company," "we," "our") a Delaware corporation, was founded in 1977. We are a leading multi-brand specialty retailer, operating over 1,000 retail stores and online at www.ae.com and www.aerie.com in the U.S. and internationally. We offer a broad assortment of apparel and accessories for men and women under the American Eagle Outfitters brand, and intimates, apparel and personal care products for women under the Aerie brand. AEO Inc. operates stores in the United States, Canada, Mexico, Hong Kong, China and the United Kingdom. We also have license agreements with third-parties to operate American Eagle Outfitters and Aerie stores throughout Asia, Europe, Latin America and the Middle East. As of January 28, 2017, we operated 943 American Eagle Outfitters stores and 102 Aerie stand-alone stores. Our licensed store base has grown to 176 locations in 23 countries. We also acquired two emerging brands to complement our existing brands, Tailgate, a vintage sports-inspired apparel brand, and Todd Snyder New York, a premium menswear brand.
Information concerning our segment and certain geographic information is contained in Note 2 of the Consolidated Financial Statements included in this Form 10-K and is incorporated herein by reference. Additionally, a five-year summary of certain financial and operating information can be found in Part II, Item 6, Selected Consolidated Financial Data, of this Form 10-K. See also Part II, Item 8, Financial Statements and Supplementary Data.
Brands
American Eagle Outfitters Brand ("AEO Brand")
We are an American brand rooted in our denim heritage and passionate about providing the highest-quality products. American Eagle Outfitters is a style movement that's 40 years in the making. Our innovative fabrics and fits have positioned us as America's favorite jeans brand-and while jeans are our heart and soul, we also design a high-quality assortment of apparel and accessories that reflects our customer's individual style-at a value that is approachable by all. AEO's brand platform, #WeAllCan TM , celebrates the power and individuality of young America.
As of January 28, 2017, the AEO brand operated 943 stores and online at www.ae.com.
Aerie
Aerie is an intimates brand in operation for over 10 years and is committed to making all girls feel good about their REAL selves. We offer bras, undies, swim, sleep, apparel and more and have grown into a body-positive movement that has changed the industry. Empowering. Honest. Fun. Smart. Strong and Sexy. #AerieREAL is a campaign that means more than no retouching, it's about loving your real self from the inside out .
As of January 28, 2017, the Aerie brand operates 102 stand-alone stores and 88 side-by-side stores connected to AEO brand stores. In addition, the Aerie brand merchandise is sold online at www.aerie.com and certain items are sold in AEO brand stores.
Other brands
Tailgate is a vintage, sports-inspired apparel brand with a college town store concept. As of January 28, 2017, the Tailgate brand operates 4 stand-alone stores and is available online at www.ae.com.
Todd Snyder New York is a premium menswear brand. As of January 28, 2017, the Todd Snyder brand operates 1 stand-alone store and online at www.ToddSnyder.com.
3
Business Priorities & Strategy
We are focused on driving our brands forward and delivering an exceptional customer experience across channels. Our current priorities include:
• | Delivering innovation, quality and outstanding value to our customers |
• | Strengthening our brands, customer experience and engagement |
• | Leveraging omni-channel and enhancing capabilities to gain market share through a focus on our customers and where they choose to shop |
• | Growing Aerie to be the leading intimates brand in the marketplace |
• | Strengthening our financial discipline including inventory and expense management, delivering profitable revenue growth and focus on high return investments among other areas |
Real Estate
We ended Fiscal 2016 with a total of 1,226 stores, consisting of 1,050 Company owned stores and 176 licensed store locations. Our AEO brand stores average approximately 6,600 gross square feet and approximately 4,600 on a selling square foot basis. Our Aerie brand stand-alone stores average approximately 3,800 gross square feet and approximately 3,000 on a selling square foot basis. The gross square footage of our Company owned stores increased by 0.3% to 6.6 million during Fiscal 2016.
Company-Owned Stores
Our Company owned retail stores are located in shopping malls, lifestyle centers and street locations in the U.S., Canada, Mexico, China, Hong Kong and the United Kingdom.
Refer to Note 16 to the Consolidated Financial Statements for additional information regarding impairment and restructuring charges in China, Hong Kong and the United Kingdom.
The following table provides the number of our Company-owned stores in operation as of January 28, 2017 and January 30, 2016.
|
| January 28, |
|
| January 30, |
| ||
|
| 2017 |
|
| 2016 |
| ||
AEO Brand: |
|
|
|
|
|
|
|
|
United States |
|
| 812 |
|
|
| 822 |
|
Canada |
|
| 84 |
|
|
| 86 |
|
Mexico |
|
| 28 |
|
|
| 23 |
|
China |
|
| 10 |
|
|
| 9 |
|
Hong Kong |
|
| 6 |
|
|
| 6 |
|
United Kingdom |
|
| 3 |
|
|
| 3 |
|
Total AEO Brand |
|
| 943 |
|
|
| 949 |
|
Aerie Brand: |
|
|
|
|
|
|
|
|
United States |
|
| 86 |
|
|
| 82 |
|
Canada |
|
| 16 |
|
|
| 15 |
|
Total Aerie Brand |
|
| 102 |
|
|
| 97 |
|
Tailgate |
|
| 4 |
|
|
| 1 |
|
Todd Snyder |
|
| 1 |
|
|
| - |
|
Total Consolidated |
|
| 1,050 |
|
|
| 1,047 |
|
4
The following table provides the changes in the number of our Company-owned stores for the past five fiscal years:
Fiscal Year |
| Beginning of Year |
|
| Opened |
|
| Closed |
|
| End of Year |
| ||||
2016 |
|
| 1,047 |
|
|
| 29 |
|
|
| (26 | ) |
|
| 1,050 |
|
2015 |
|
| 1,056 |
|
|
| 23 |
|
|
| (32 | ) |
|
| 1,047 |
|
2014 |
|
| 1,066 |
|
|
| 60 |
|
|
| (70 | ) |
|
| 1,056 |
|
2013 |
|
| 1,044 |
|
|
| 64 |
|
|
| (42 | ) |
|
| 1,066 |
|
2012 |
|
| 1,069 |
|
|
| 16 |
|
|
| (41 | ) |
|
| 1,044 |
|
Licensed Stores
In addition to our Company owned stores, our merchandise is sold at stores operated by third-party licensees. Under these agreements, our merchandise is sold at American Eagle Outfitters and Aerie stores owned and operated by third-party operators. Revenue recognized under license agreements generally consists of royalties earned and recognized upon sale of merchandise by license partners to retail customers.
As of January 28, 2017, our products were sold in 176 locations operated by licensees in 23 countries as provided in the following table. We continue to increase the number of locations under these types of arrangements as part of our disciplined approach to global expansion.
|
| January 28, |
|
| 2017 |
Israel |
| 41 |
Japan |
| 34 |
South Korea |
| 19 |
Chile |
| 12 |
Colombia |
| 12 |
Philippines |
| 9 |
UAE |
| 9 |
Saudi Arabia |
| 8 |
Thailand |
| 6 |
Egypt |
| 3 |
Greece |
| 3 |
Kuwait |
| 3 |
Lebanon |
| 3 |
Morocco |
| 2 |
Panama |
| 2 |
Qatar |
| 2 |
Singapore |
| 2 |
Bahrain |
| 1 |
Costa Rica |
| 1 |
Curacao |
| 1 |
Guatemala |
| 1 |
Jordan |
| 1 |
Oman |
| 1 |
Total Licensed Stores |
| 176 |
AEO Direct
We sell merchandise through our digital channels, ae.com, aerie.com and our AEO apps, both domestically and internationally in 81 countries. The digital channels reinforce each particular brand platform, and are designed to complement the in-store experience.
Over the past several years, we have invested in building our technologies and digital capabilities. We focused our investments in three key areas: making significant advances in mobile technology, investing in digital marketing and improving the desktop and tablet experience.
5
Omni-Channel
In addition to our investments in technology, we have invested in building omni-channel capabilities to better serve customers and gain operational efficiencies. These upgraded technologies have provided a single view of inventory across channels, connecting physical stores directly to our digital store, providing our customers with a more convenient and improved shopping experience. Our two distribution centers are fully omni-channel and service both stores and digital businesses. We offer the ability for customers to seamlessly return product via any channel regardless of where it was originally purchased. Our store-to-door capability enables store customers to make purchases from online inventory while shopping in our stores. Additionally, we fulfill online orders at stores through our buy online, ship from store capability, maximizing inventory exposure to digital traffic. We also offer a reserve online, pick up in store service to our customers and give them the ability to lookup in-store inventory from all digital channels. We will continue to optimize these tools and services to build ongoing improvements to the customer shopping experience.
Merchandise Suppliers
We design our merchandise, which is manufactured by third-party factories. During Fiscal 2016, we purchased substantially all of our merchandise from non-North American suppliers. For the year, we sourced merchandise through approximately 300 vendors located throughout the world, primarily in Asia, and did not source more than 10% of our merchandise from any single factory or supplier during the year.
We maintain a quality control department at our distribution centers to inspect incoming merchandise shipments for overall quality of manufacturing. Inspections are also made by our employees and agents at manufacturing facilities to identify quality issues prior to shipment of merchandise.
We uphold an extensive factory inspection program to monitor compliance with our Vendor Code of Conduct. New garment factories must pass an initial inspection in order to do business with us and we continue to review their social compliance performance both through internal audits by our compliance team and through the use of third-party monitors. We strive to partner with suppliers who respect local laws and share our dedication to utilize best practices in human rights, labor rights, environmental practices and workplace safety. We have been a certified member of the Customs-Trade Partnership Against Terrorism program ("C-TPAT") since 2004. C-TPAT is a voluntary program offered by the Bureau of Customs and Border Protection ("CBP") in which an importer agrees to work with CBP to strengthen overall supply chain security. As of September 2016, we were accepted into the Apparel, Footwear and Textiles Center, one of CBP's Centers of Excellence and Expertise ("CEE"). The CEE was created to ensure uniformity, create efficiencies, reduce redundancies, enhance industry expertise and facilitate trade, all with a final goal of reduced costs at the border and allowing CBP to focus on high-risk shipments.
Inventory and Distribution
Merchandise is shipped directly from our vendors to our U.S. distribution centers in Hazleton, Pennsylvania and Ottawa, Kansas, or to our Canadian distribution center in Mississauga, Ontario. Additionally, an increasing amount of product is shipped directly to stores which reduces transit times and lowers operating costs. We contract with third-party distribution centers in Mexico, Hong Kong, China and the Netherlands to service our Company owned stores in those regions.
Regulation
We and our products are subject to regulation by various federal, state, local and foreign regulatory authorities. Virtually all of our products are manufactured by foreign suppliers and imported by us, and we are subject to a variety of trade laws, customs regulations and international trade agreements. Apparel and other products sold by us are under the jurisdiction of multiple governmental agencies and regulations, including, in the U.S., the Federal Trade Commission and the Consumer Products Safety Commission. These regulations relate principally to product labeling, marketing, licensing requirements, and consumer product safety requirements and regulatory testing. We are also subject to regulations governing our employees both globally and in the U.S., and by disclosure and reporting requirements for publicly traded companies established under existing or new federal or state laws, including the Sarbanes-Oxley Act of 2002, the Securities and Exchange Commission ("SEC") and New York Stock Exchange ("NYSE").
Our licensing partners, buying/sourcing agents, and the vendors and factories with which we contract for the manufacture and distribution of our products are also subject to regulation. Our agreements require our licensing partners, buying/sourcing agents, vendors, and factories to operate in compliance with all applicable laws and regulations, and we
6
are not aware of any violations which could reasonably be expected to have a material adverse effect on our business or operating results.
Competition
The global retail apparel industry is highly competitive both in stores and online. We compete with various local, national, and global apparel retailers, as well as the casual apparel and footwear departments of department stores and discount retailers, primarily on the basis of quality, fashion, service, selection and price.
Trademarks and Service Marks
We have registered AMERICAN EAGLE OUTFITTERS ® , AMERICAN EAGLE ® , AE ® , AEO ® , #WeAllCan TM , LIVE YOUR LIFE ® , Aerie ® and the Flying Eagle Design with the United States Patent and Trademark Office. We also have registered or have applied to register substantially all of these trademarks with the registries of the foreign countries in which our stores and/or manufacturers are located and/or where our product is shipped.
We have registered AMERICAN EAGLE OUTFITTERS ® , AMERICAN EAGLE ® , AEO ® , LIVE YOUR LIFE ® , Aerie ® and the Flying Eagle Design with the Canadian Intellectual Property Office. In addition, we have acquired rights in AE TM for clothing products and registered AE ® in connection with certain non-clothing products.
In the U.S. and in other countries around the world, we also have registered, or have applied to register, a number of other marks used in our business, including our pocket stitch designs.
Our registered trademarks are renewable indefinitely, and their registrations are properly maintained in accordance with the laws of the country in which they are registered. We believe that the recognition associated with these trademarks makes them extremely valuable and, therefore, we intend to use and renew our trademarks in accordance with our business plans.
Employees
As of January 28, 2017, we had approximately 38,700 employees in the United States, Canada, Mexico, Hong Kong, China and the United Kingdom of whom approximately 32,100 were part-time or seasonal hourly employees.
Executive Officers of the Registrant
Jennifer M. Foyle, age 50, has served as our Global Brand President – Aerie since January 2015. Prior thereto, Ms. Foyle served as Executive Vice President, Chief Merchandising Officer – Aerie from February 2014 to January 2015 and Senior Vice President, Chief Merchandising Officer – Aerie from August 2010 to February 2014. Prior to joining us, Ms. Foyle was President of Calypso St. Barth from 2009 to 2010. In addition, she held various positions at J. Crew Group, Inc., including Chief Merchandising Officer, from 2003 to 2009. Early in her career Ms. Foyle was the Women's Divisional Merchandise Manager for Gap Inc. from 1999 – 2003 and held various roles at Bloomingdales from 1988-1999.
Peter Z. Horvath , age 59, has served as our Chief Global Commercial and Administrative Officer since May 2016. Prior to joining us, Mr. Horvath served as Chief Executive Officer and Chairman of Mission Essential Personnel, LLC, from January 2012 to June 2015. Prior to that time, he served as Executive Vice President and Chief Operating Officer of Victoria's Secret Stores, Limited Brands from July 2008 to December 2010. From January 2005 to June 2008, Mr. Horvath was President of DSW, Inc. From 1985 to 2004, he held a variety of positions at Limited Brands, including Chief Financial Officer, Apparel Merchandising from 1997 to 2002 and Senior Vice President, Enterprise Merchandise Planning and Allocation from 2002 to 2004. Early in his career, Mr. Horvath worked at Bristol Myers, Inc. and W.R. Grace and Co. Retail Group.
Charles F. Kessler , age 44, has served as our Global Brand President – American Eagle Outfitters since January 2015. Prior thereto, he served as our Executive Vice President, Chief Merchandising and Design Officer – American Eagle Outfitters from February 2014 to January 2015. Prior to joining us, Mr. Kessler served as Chief Merchandising Officer at Urban Outfitters, Inc. from October 2011 to November 2013 and as Senior Vice President, Corporate Merchandising at Coach, Inc. from July 2010 to October 2011. Prior to that time, Mr. Kessler held various positions with Abercrombie & Fitch Co. from 1994 to 2010, including Executive Vice President, Female Merchandising from 2008 to 2010.
7
Robert L. Madore , age 52, has served as our Executive Vice President and Chief Financial Officer since October 2016. Prior to joining us, Mr. Madore served as the Chief Financial Offi cer of Ralph Lauren Corporation from April 2015 to September 2016. Prior to that role, he held a number of key financial and operational roles at the Ralph Lauren Corporation, including Senior Vice President of Corporate Finance from December 2010 to March 2015, and Senior Vice President of Operations and Chief Financial Officer of its retail division from 2004 to December 2010. Prior to that time, Mr. Madore was Chief Financial Officer for New York & Company from 2003 to 2004, and served as Chief Operating Officer and Chief Financial Officer of FutureBrand, a division of McCann Erickson, from 2001 to 2003. Prior thereto, he held various executive management positions at Nine West Group, Inc. starting in 1995. Mr. Madore began his career in 1987 at Deloitte & Touche until 1995.
Michael R. Rempell, age 43, has served as our Executive Vice President and Chief Operations Officer since June 2012. Prior thereto, he served as our Executive Vice President and Chief Operating Officer, New York Design Center, from April 2009 to June 2012, as Senior Vice President and Chief Supply Chain Officer from May 2006 to April 2009, and in various other positions since joining us in February 2000.
Jay L. Schottenstein, age 62, has served as our Executive Chairman, Chief Executive Officer since December 2015. Prior thereto, Mr. Schottenstein served as our Executive Chairman, Interim Chief Executive Officer from January 2014 to December 2015. He has also served as the Chairman of the Company and its predecessors since March 1992. He served as our Chief Executive Officer from March 1992 until December 2002 and prior to that time, he served as a Vice President and Director of our predecessors since 1980. He has also served as Chairman of the Board and Chief Executive Officer of Schottenstein Stores Corporation ("SSC") since March 1992 and as President since 2001. Prior thereto, Mr. Schottenstein served as Vice Chairman of SSC from 1986 to 1992. He has been a Director of SSC since 1982. Mr. Schottenstein also served as Chief Executive Officer from March 2005 to April 2009 and as Chairman of the Board since March 2005 of DSW Inc., a company traded on the NYSE. He has also served as a member of the Board of Directors for AB Acquisition LLC (Albertsons/Safeway) since 2006. He has also served as an office and director of various other entities owned or controlled by members of his family since 1976.
Fiscal Year
Our fiscal year ends on the Saturday nearest to January 31. As used herein, "Fiscal 2017" refers to the 53-week period ending February 3, 2018. "Fiscal 2016", "Fiscal 2015" and "Fiscal 2014" refer to the 52-week periods ended January 28, 2017, January 30, 2016 and January 31, 2015, respectively.
Available Information
Our Annual Reports on Form 10-K, Quarterly Reports on Form 10-Q, Current Reports on Form 8-K and amendments to those reports are available under the Investors section of our website at www.ae.com. These reports are available as soon as reasonably practicable after such material is electronically filed with the SEC.
Our corporate governance materials, including our corporate governance guidelines, the charters of our audit, compensation, and nominating and corporate governance committees, and our code of ethics may also be found under the Investors section of our website at www.ae.com. Any amendments or waivers to our code of ethics will also be available on our website. A copy of the corporate governance materials is also available upon written request.
Additionally, our investor presentations are available under the Investors section of our website at www.ae.com. These materials are available as soon as reasonably practicable after they are presented at investor conferences.
Certifications
As required by the NYSE Corporate Governance Standards Section 303A.12(a), on June 2, 2016, our Chief Executive Officer submitted to the NYSE a certification that he was not aware of any violation by the Company of NYSE corporate governance listing standards. Additionally, we filed and furnished, as applicable, with this Form 10-K, the Principal Executive Officer and Principal Financial Officer certifications required under Sections 302 and 906 of the Sarbanes-Oxley Act of 2002.
8
Item 1A. Ri sk Factors
Our inability to anticipate and respond to changing consumer preferences, fashion trends and a competitive environment in a timely manner
Our future success depends, in part, upon our ability to identify and respond to fashion trends in a timely manner. The specialty retail apparel business fluctuates according to changes in the economy and customer preferences, dictated by fashion and season. These fluctuations especially affect the inventory owned by apparel retailers because merchandise typically must be ordered well in advance of the selling season. While we endeavor to test many merchandise items before ordering large quantities, we are still susceptible to changing fashion trends and fluctuations in customer demands.
In addition, the cyclical nature of the retail business requires that we carry a significant amount of inventory, especially during our peak selling seasons. We enter into agreements for the manufacture and purchase of our private label apparel well in advance of the applicable selling season. As a result, we are vulnerable to changes in consumer demand, pricing shifts and the timing and selection of merchandise purchases. The failure to enter into agreements for the manufacture and purchase of merchandise in a timely manner could, among other things, lead to a shortage of inventory and lower sales. Changes in fashion trends, if unsuccessfully identified, forecasted or responded to by us, could, among other things, lead to lower sales, excess inventories and higher markdowns, which in turn could have a material adverse effect on our results of operations and financial condition.
The effect of economic pressures and other business factors on consumer spending
The success of our operations depends to a significant extent upon a number of factors relating to discretionary consumer spending, including economic conditions affecting disposable consumer income such as income taxes, payroll taxes, employment, consumer debt, interest rates, increases in energy costs and consumer confidence. There can be no assurance that consumer spending will not be further negatively affected by general, local or international economic conditions, thereby adversely impacting our business and results of operations.
Seasonality
Historically, our operations have been seasonal, with a large portion of total net revenue and operating income occurring in the third and fourth fiscal quarters, reflecting increased demand during the back-to-school and year-end holiday selling seasons, respectively. As a result of this seasonality, any factors negatively affecting us during the third and fourth fiscal quarters of any year, including adverse weather or unfavorable economic conditions, could have a material adverse effect on our financial condition and results of operations for the entire year. Our quarterly results of operations also may fluctuate based upon such factors as the timing of certain holiday seasons, the number and timing of new store openings, the acceptability of seasonal merchandise offerings, the timing and level of markdowns, store closings and remodels, competitive factors, weather and general economic and political conditions.
Our efforts to execute on our key business priorities
Our success depends on our ability to execute on our key priorities, which are centered on driving our brands forward and delivering an exceptional customer experience across channels, including:
| • | Delivering innovation, quality and outstanding value to our customers |
| • | Strengthening our brands, customer experience and engagement |
| • | Leveraging omni-channel and enhancing capabilities to gain market share through a focus on our customers and where they choose to shop |
| • | Growing Aerie to be the leading intimates brand in the marketplace |
| • | Strengthening our financial discipline including inventory and expense management, delivering profitable revenue growth and focus on high return investments among other areas |
Our inability to react to raw material cost, labor and energy cost increases
Increases in our costs, such as raw materials, labor and energy may reduce our overall profitability. Specifically, fluctuations in the cost associated with the manufacture of merchandise we purchase from our suppliers impacts our cost
9
of sales. We have strategies in place to help mitigate these costs; however, our overall profitability depends on the success of those strategies. Additionally, inc reases in other costs, including labor, energy and additional duties and taxes on imports, could further reduce our profitability if not mitigated.
Our inability to achieve planned store financial performance
The results achieved by our stores may not be indicative of long-term performance or the potential performance of stores in other locations. The failure of stores to achieve acceptable results could result in store asset impairment charges, which could adversely affect our results of operations and financial condition.
Our ability to gain market share in the face of declining shopping center traffic
Customer shopping patterns have been evolving from shopping center and store locations to digital marketplaces. We have Company owned stores in shopping centers that have experienced declining traffic trends while our digital channels continue to grow. Our ability to grow revenue and acquire new customers is contingent on our ability to drive traffic to both store locations and digital channels so we are accessible to our customers when and where they want to shop.
We locate our brick and mortar stores in prominent locations within successful shopping malls or street locations. Our stores benefit from the ability of the malls' "anchor" tenants, generally large department stores and other area attractions, to generate consumer traffic in the vicinity of our stores. We cannot control the increasing impact of digital channels on shopping center traffic; the loss of an anchor or other significant tenant in a shopping mall in which we have a store; the development of new shopping malls in the U.S. or around the world; the availability or cost of appropriate locations; competition with other retailers for prominent locations; or the success of individual shopping malls. All of these factors may impact our ability to meet our productivity targets and could have a material adverse effect on our financial results.
Our inability to grow our e-commerce channel and leverage omni-channel capabilities
We sell merchandise through our digital channels, both domestically and internationally. We have invested in building technologies and digital capabilities in three key areas: mobile technology, digital marketing and desktop experience. We have made significant capital investments in these areas but there is no assurance that we will be able to continue to successfully maintain or expand our e-commerce business. As omni-channel retailing continues to evolve, our customers are increasingly more likely to shop across multiple channels that work in tandem to meet their needs. Our inability to respond to these changes and successfully maintain and expand our omni-channel business may have an adverse impact on our results of operations.
Our efforts to expand internationally
We are actively pursuing additional international expansion initiatives, which include Company owned stores and stores operated by third-parties in select international markets. The effect of international expansion arrangements on our business and results of operations is uncertain and will depend upon various factors, including the demand for our products in new markets internationally. Furthermore, although we provide store operation training, literature and support, to the extent that a licensee does not operate its stores in a manner consistent with our requirements regarding our brand and customer experience standards, our business results and the value of our brand could be negatively impacted.
A failure to properly implement our expansion initiatives, or the adverse impact of political or economic risks in these international markets, could have a material adverse effect on our results of operations and financial condition. We have limited prior experience operating internationally, where we face established competitors. In many of these locations, the real estate, labor and employment, transportation and logistics and other operating requirements differ dramatically from those in the locations where we have more experience. Consumer demand and behavior, as well as tastes and purchasing trends, may differ substantially, and as a result, sales of our products may not be successful, or the margins on those sales may not be in line with those we currently anticipate. Any differences that we encounter as we expand internationally may divert financial, operational and managerial resources from our existing operations, which could adversely impact our financial condition and results of operations. In addition, we are increasingly exposed to foreign currency exchange rate risk with respect to our revenue, profits, assets, and liabilities denominated in currencies other than the U.S. dollar. We may use instruments to hedge certain foreign currency risks; however, these measures may not
10
succeed in offsetting all of the negative impact of foreign currency rate movements on our business and results of operatio ns.
As we pursue our international expansion initiatives, we are subject to certain laws, including the Foreign Corrupt Practices Act, as well as the laws of the foreign countries in which we operate. Violations of these laws could subject us to sanctions or other penalties that could have an adverse effect on our reputation, operating results and financial condition.
Our international merchandise sourcing strategy
Our merchandise is manufactured by suppliers worldwide. Although we purchase a significant portion of our merchandise through a single international buying agent, we do not maintain any exclusive commitments to purchase from any one vendor. Because we have a global supply chain, any event causing the disruption of imports, including the insolvency of a significant supplier or a major labor slow-down, strike or dispute including any such actions involving ports, trans loaders, consolidators or shippers, could have an adverse effect on our operations. Given the volatility and risk in the current markets, our reliance on external vendors leaves us subject to certain risks should one or more of these external vendors become insolvent. Although we monitor the financial stability of our key vendors and plan for contingencies, the financial failure of a key vendor could disrupt our operations and have an adverse effect on our cash flows, results of operations and financial condition. Recently, uncertainty has increased with respect to tax and trade policies, border adjustments, tariffs and government regulations affecting trade between the U.S. and other countries. We source the majority of our merchandise from manufacturers located outside of the U.S., primarily in Asia. Major developments in tax policy or trade relations, such as the disallowance of tax deductions for imported merchandise or the imposition of unilateral tariffs on imported products, could have a material adverse effect on our business, results of operations and liquidity.
We have a Vendor Code of Conduct (the "Code") that provides guidelines for our vendors regarding working conditions, employment practices and compliance with local laws. A copy of the Code is posted on our website, www.ae.com , and is also included in our vendor manual in English and multiple other languages. We have a factory compliance program to audit for compliance with the Code. However, there can be no assurance that all violations can be eliminated in our supply chain. Publicity regarding violation of our Code or other social responsibility standards by any of our vendor factories could adversely affect our reputation, sales and financial performance.
There is a risk of terrorist activity on a global basis. Such activity might take the form of a physical act that impedes the flow of imported goods or the insertion of a harmful or injurious agent to an imported shipment. We have instituted policies and procedures designed to reduce the chance or impact of such actions. Examples include, but are not limited to, factory audits and self-assessments, including audit protocols on all critical security issues; the review of security procedures of our other international trading partners, including forwarders, consolidators, shippers and brokers; and the cancellation of agreements with entities who fail to meet our security requirements. In addition, CBP has recognized us as a validated participant of the C-TPAT program, a voluntary program in which an importer agrees to work with customs to strengthen overall supply chain security. However, there can be no assurance that terrorist activity can be prevented entirely and we cannot predict the likelihood of any such activities or the extent of their adverse impact on our operations.
Our reliance on our ability to implement and sustain information technology systems
We regularly evaluate our information technology systems and are currently implementing modifications and/or upgrades to the information technology systems that support our business. Modifications include replacing legacy systems with successor systems, making changes to legacy systems or acquiring new systems with new functionality. We are aware of inherent risks associated with operating, replacing and modifying these systems, including inaccurate system information and system disruptions. We believe we are taking appropriate action to mitigate the risks through testing, training, staging implementation and in-sourcing certain processes, as well as securing appropriate commercial contracts with third-party vendors supplying such replacement and redundancy technologies; however, there is a risk that information technology system disruptions and inaccurate system information, if not anticipated and/or promptly and appropriately mitigated, could have a material adverse effect on our results of operations.
11
Our inability to safeguard against security breaches with respect to our information technology systems
Our business employs systems and websites that allow for the storage and transmission of proprietary or confidential information regarding our business, customers and employees including credit card information. Security breaches could expose us to a risk of loss or misuse of this information and potential liability. We may not be able to anticipate or prevent rapidly evolving types of cyber-attacks. Actual or anticipated attacks may cause us to incur increasing costs including costs to deploy additional personnel and protection technologies, train employees and engage third-party experts and consultants. Advances in computer capabilities, new technological discoveries or other developments may result in the technology used by us to protect transaction or other data being breached or compromised. Data and security breaches can also occur as a result of non-technical issues including intentional or inadvertent breach by employees or persons with whom we have commercial relationships that result in the unauthorized release of personal or confidential information. Any compromise or breach could result in a violation of applicable privacy and other laws, significant financial exposure and a loss of confidence in our security measures, which could have an adverse effect on our results of operations and our reputation.
Our reliance on key personnel
Our success depends to a significant extent upon our ability to attract and retain qualified key personnel, including senior management. Collective or individual changes in our senior management and other key personnel could have an adverse effect on our ability to determine and execute our strategies, which could adversely affect our business and results of operations. There is a high level of competition for senior management and other key personnel, and we cannot be assured we will be able to attract, retain and develop a sufficient number of qualified senior managers and other key personnel.
Failure to comply with regulatory requirements
As a public company, we are subject to numerous regulatory requirements, including those imposed by the Sarbanes-Oxley Act of 2002, the SEC and the NYSE. In addition, we are subject to numerous domestic and foreign laws and regulations affecting our business, including those related to labor, employment, worker health and safety, competition, privacy, consumer protection, import/export and anti-corruption, including the Foreign Corrupt Practices Act. Although we have put into place policies and procedures aimed at ensuring legal and regulatory compliance, our employees, subcontractors, vendors and suppliers could take actions that violate these requirements, which could have a material adverse effect on our reputation, financial condition and on the market price of our common stock. In addition, regulatory developments regarding the use of "conflict minerals," certain minerals originating from the Democratic Republic of Congo and adjoining countries, could affect the sourcing and availability of raw materials used by suppliers and subject us to costs associated with the regulations, including for the diligence pertaining to the presence of any conflict minerals used in our products, possible changes to products, processes or sources of our inputs, and reporting requirements.
Fluctuations in foreign currency exchange rates
We have foreign currency exchange rate risk with respect to revenues, expenses, assets and liabilities denominated in currencies other than the U.S. dollar. We currently do not utilize hedging instruments to mitigate foreign currency exchange risks. Specifically, fluctuations in the value of the Canadian Dollar, Mexican Peso, Chinese Yuan, Hong Kong Dollar, British Pound and Euro against the U.S. Dollar could have a material adverse effect on our results of operations, financial condition and cash flows.
Fluctuations in our tax obligations and effective tax rate
We are subject to income taxes in many U.S. and certain foreign jurisdictions. We record tax expense based on our estimates of future payments, which include reserves for uncertain tax positions in multiple tax jurisdictions. At any one time, multiple tax years are subject to audit by various taxing authorities. The results of these audits and negotiations with taxing authorities may affect the ultimate settlement of these issues. In addition, the tax laws and regulations in the countries where we operate may change or there may be changes in interpretation and enforcement of existing tax laws. Significant tax law changes are being evaluated by the Federal Government of the United States, our most significant country of operation. Such tax law changes, including a border adjustment tax, if enacted, could materially increase our income tax expense, which would have a material adverse effect on our results of operations. As a result, we expect that throughout the year there could be ongoing variability in our quarterly tax rates as events occur and
12
exposures are evaluated. In addition, our effective tax rate in a given financial statement period may be materially impacted by changes in the mix and level of earnings by jurisdiction or by changes to existing accounting rules or regulations.
Impact of various legal proceedings, lawsuits, disputes, and claims
As a multinational company, we are subject to various proceedings, lawsuits, disputes, and claims ("Actions") arising in the ordinary course of our business. Many of these Actions raise complex factual and legal issues and are subject to uncertainties. Actions filed against us from time to time include commercial, intellectual property, customer, employment, and data privacy claims, including class action lawsuits. Actions are in various procedural stages and some are covered in part by insurance. We cannot predict with assurance the outcome of Actions brought against us. Accordingly, developments, settlements, or resolutions may occur and impact income in the quarter of such development, settlement, or resolution. An unfavorable outcome could have an adverse impact on our business, financial condition and results of operations.
Other risk factors
Additionally, other factors could adversely affect our financial performance, including factors such as: our ability to successfully acquire and integrate other businesses; any interruption of our key infrastructure systems, including exceeding capacity in our distribution centers; any disaster or casualty resulting in the interruption of service from our distribution centers or in a large number of our stores; any interruption of our business related to an outbreak of a pandemic disease in a country where we source or market our merchandise; extreme weather conditions or changes in climate conditions or weather patterns; the effects of changes in interest rates; and international and domestic acts of terror.
The impact of any of the previously discussed factors, some of which are beyond our control, may cause our actual results to differ materially from expected results in these statements and other forward-looking statements we may make from time-to-time.
Item 1B. Unresolved Staff Comments.
Not applicable.
Item 2. Properties.
We own two buildings in urban Pittsburgh, Pennsylvania which house our corporate headquarters. These buildings total 186,000 square feet and 150,000 square feet, respectively.
In suburban Pittsburgh, Pennsylvania, we own a 45,000 square foot building, which houses our data center and additional office space and lease an additional location of approximately 18,000 square feet, which is used for storage space. This lease expires in 2017.
We rent approximately 182,000 square feet of office space in New York, New York for our designers and sourcing and production teams. The lease for this space expires in 2026.
We lease 9,200 square feet of office space in San Francisco, California that functions as a technology center for our engineers and digital marketing team focused on our omni-channel strategy. The lease for this space expires in 2019.
We also lease offices in international locations including 6,600 square feet in Mexico City expiring in 2020, 15,400 square feet in Hong Kong expiring in 2017 and 11,300 square feet in Shanghai, China expiring in 2019.
We own distribution facilities in Ottawa, Kansas and Hazleton, Pennsylvania consisting of approximately 1.2 million and 1.0 million square feet, respectively. These facilities are used to support new and existing growth initiatives, including AEO Direct and Aerie.
We lease a building in Mississauga, Ontario with approximately 294,000 square feet, which houses our Canadian distribution center. The lease expires in 2028.
13
All of our stores are leased and generally have initial terms of 10 years. Certain leases also include early termination options, which can be exercised under specific conditions. Most of these leases provide for base rent and require the payment of a percentage of sales as additional contingent r ent when sales reach specified levels. Under our store leases, we are typically responsible for tenant occupancy costs, including maintenance and common area charges, real estate taxes and certain other expenses. We have generally been successful in negoti ating renewals as leases near expiration.
Item 3. Legal Proceedings.
We are involved, from time to time, in actions associated with or incidental to our business, including, among other things, matters involving credit card fraud, trademark and other intellectual property, licensing, importation of products, taxation, and employee relations. We believe at present that the resolution of currently pending matters will not individually or in the aggregate have a material adverse effect on our financial position or results of operations. However, our assessment of any litigation or other legal claims could potentially change in light of the discovery of facts not presently known or determinations by judges, juries, or other finders of fact which are not in accord with management's evaluation of the possible liability or outcome of such litigation or claims.
Item 4. Mine Safety Disclosures.
Not Applicable.
PART II
Item 5. Market for the Registrant's Common Equity, Related Stockholder Matters and Issuer Purchases of Equity Securities.
Our common stock is traded on the NYSE under the symbol "AEO". As of March 6, 2017, there were 511 stockholders of record. However, when including associates who own shares through our employee stock purchase plan, and others holding shares in broker accounts under street name, we estimate the stockholder base at approximately 50,000. The following table sets forth the range of high and low closing prices of the common stock as reported on the NYSE during the periods indicated.
|
| Market Price |
|
| Cash Dividends per |
| ||||||
For the Quarters Ended |
| High |
|
| Low |
|
| Common Share |
| |||
January 28, 2017 |
| $ | 18.91 |
|
| $ | 14.45 |
|
| $ | 0.125 |
|
October 29, 2016 |
| $ | 19.37 |
|
| $ | 16.80 |
|
| $ | 0.125 |
|
July 30, 2016 |
| $ | 17.92 |
|
| $ | 13.39 |
|
| $ | 0.125 |
|
April 30, 2016 |
| $ | 16.90 |
|
| $ | 13.12 |
|
| $ | 0.125 |
|
January 30, 2016 |
| $ | 16.64 |
|
| $ | 13.24 |
|
| $ | 0.125 |
|
October 31, 2015 |
| $ | 18.35 |
|
| $ | 14.68 |
|
| $ | 0.125 |
|
August 1, 2015 |
| $ | 18.31 |
|
| $ | 15.74 |
|
| $ | 0.125 |
|
May 2, 2015 |
| $ | 17.90 |
|
| $ | 13.96 |
|
| $ | 0.125 |
|
During Fiscal 2016 and Fiscal 2015, we paid quarterly dividends as shown in the table above. The payment of future dividends is at the discretion of our Board of Directors (the "Board") and is based on future earnings, cash flow, financial condition, capital requirements, changes in U.S. taxation and other relevant factors. It is anticipated that any future dividends paid will be declared on a quarterly basis.
14
Performan ce Graph
The following Performance Graph and related information shall not be deemed "soliciting material" or to be filed with the SEC, nor shall such information be incorporated by reference into any future filing under the Securities Act of 1933 or Securities Exchange Act of 1934, each as amended, except to the extent that we specifically incorporate it by reference into such filing.
The following graph compares the changes in the cumulative total return to holders of our common stock with that of the S&P Midcap 400, the Dynamic Retail Intellidex and our peer group as described below. The comparison of the cumulative total returns for each investment assumes that $100 was invested in our common stock and the respective index on January 28, 2012 and includes reinvestment of all dividends. The plotted points are based on the closing price on the last trading day of the fiscal year indicated.
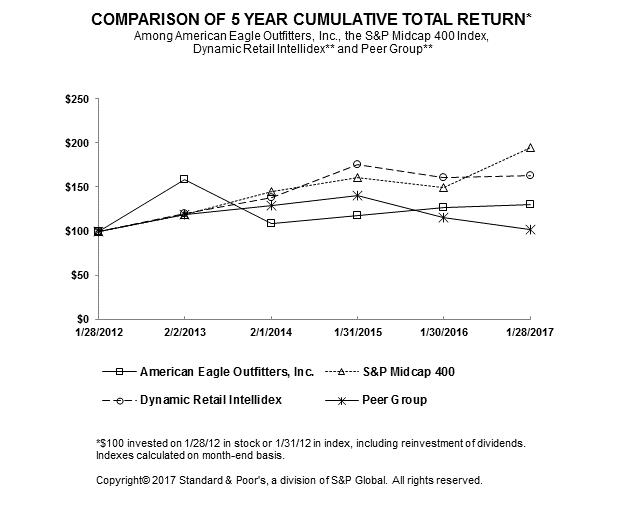
|
| 1/28/12 |
| 2/2/13 |
| 2/1/14 |
| 1/31/15 |
| 1/30/16 |
| 1/28/17 |
| ||||||
American Eagle Outfitters, Inc. |
|
| 100.00 |
|
| 158.72 |
|
| 109.00 |
|
| 117.59 |
|
| 126.39 |
|
| 130.52 |
|
S&P Midcap 400 |
|
| 100.00 |
|
| 118.56 |
|
| 144.48 |
|
| 160.22 |
|
| 149.49 |
|
| 194.59 |
|
Dynamic Retail Intellidex |
|
| 100.00 |
|
| 120.40 |
|
| 138.36 |
|
| 175.44 |
|
| 160.52 |
|
| 163.21 |
|
Peer Group |
|
| 100.00 |
|
| 118.50 |
|
| 128.89 |
|
| 140.18 |
|
| 115.04 |
|
| 102.18 |
|
**For Fiscal 2016, we compared our cumulative total return to a custom peer group that consisted of the following companies: Abercrombie & Fitch Co., Ascena Retail Group. Inc., Burberry Group PLC, Chico's FAS, Inc., Coach, Inc., Express, Inc., Gap, Inc., Guess?, Inc., Hanesbrands Inc., L Brands Inc., Lululemon Athletica, Inc., Michael Kors Holdings LTD, PVH Corp, Ralph Lauren Corp., Tailored Brands Inc., Under Armour Inc, and Urban Outfitters, Inc. Prior to Fiscal 2016, we compared our cumulative total return to the published Dynamic Retail Intellidex. We believe that the comparison
15
to a custom peer group provides a more accurate index of organizations that we benchmark against and therefore will provide a more accurate compa rison of stock performance.
The following table provides information regarding our repurchases of common stock during the three months ended January 28, 2017.
Issuer Purchases of Equity Securities
|
|
|
|
|
|
|
|
|
| Total Number of |
|
| Maximum Number of |
| ||
|
| Total |
|
| Average |
|
| Shares Purchased as |
|
| Shares that May |
| ||||
|
| Number of |
|
| Price Paid |
|
| Part of Publicly |
|
| Yet be Purchased |
| ||||
Period |
| Shares Purchased |
|
| Per Share |
|
| Announced Programs |
|
| Under the Program |
| ||||
|
| (1) |
|
| (2) |
|
| (1) (3) |
|
| (3) |
| ||||
Month #1 (October 30, 2016 through November 26, 2016) |
|
| 7,605 |
|
| $ | 16.53 |
|
|
| - |
|
|
| 27,837,016 |
|
Month #2 (November 27, 2016 through December 31, 2016) |
|
| 531 |
|
| $ | 16.54 |
|
|
|
|
|
|
| 27,837,016 |
|
Month #3 (January 1, 2017 through January 28, 2017) |
|
| 3 |
|
| $ | 15.17 |
|
|
|
|
|
|
| 25,000,000 |
|
Total |
|
| 8,139 |
|
| $ | 16.53 |
|
|
| - |
|
|
| 25,000,000 |
|
(1) | There were no shares repurchased as part of our publicly announced share repurchase program during the three months ended January 28, 2017 and there were 8,139 shares repurchased for the payment of taxes in connection with the vesting of share-based payments. |
(2) | Average price paid per share excludes any broker commissions paid. |
(3) | In January 2013, our Board authorized the repurchase of 20.0 million shares of our common stock. The authorization of the remaining 2.8 million shares that may yet be purchased expired on January 28, 2017. During Fiscal 2016 our Board authorized 25.0 million shares under a new share repurchase program which expires on January 30, 2021. |
The following table sets forth additional information as of the end of Fiscal 2016, about shares of our common stock that may be issued upon the exercise of options and other rights under our existing equity compensation plans and arrangements, divided between plans approved by our stockholders and plans or arrangements not submitted to our stockholders for approval. The information includes the number of shares covered by, and the weighted average exercise price of, outstanding options and other rights and the number of shares remaining available for future grants excluding the shares to be issued upon exercise of outstanding options, warrants and other rights.
Equity Compensation Plan Table
|
| Column (a) |
|
| Column (b) |
|
| Column (c) |
| |||
|
|
|
|
|
|
|
|
|
| Number of securities |
| |
|
|
|
|
|
|
|
|
|
| remaining available |
| |
|
| Number of securities |
|
| Weighted-average |
|
| for issuance under |
| |||
|
| to be issued upon |
|
| exercise price of |
|
| equity compensation |
| |||
|
| exercise of outstanding |
|
| outstanding options, |
|
| plans (excluding |
| |||
|
| options, |
|
| warrants and |
|
| securities reflected |
| |||
|
| warrants and rights (1) |
|
| rights (1) |
|
| in column (a)) (1) |
| |||
Equity compensation plans approved by stockholders |
|
| 2,313,889 |
|
| $ | 15.33 |
|
|
| 3,364,255 |
|
Equity compensation plans not approved by stockholders |
|
| - |
|
|
| - |
|
|
| - |
|
Total |
|
| 2,313,889 |
|
| $ | 15.33 |
|
|
| 3,364,255 |
|
(1) | Equity compensation plans approved by stockholders include the 2005 Stock Award and Incentive Plan, as amended (the "2005 Plan") and the 2014 Stock Award and Incentive Plan (the "2014 Plan"). |
16
Item 6. Selected Consol idated Financial Data.
The following Selected Consolidated Financial Data should be read in conjunction with "Management's Discussion and Analysis of Financial Condition and Results of Operations," included under Item 7 below and the Consolidated Financial Statements and Notes thereto, included in Item 8 below. Most of the selected Consolidated Financial Statements data presented below is derived from our Consolidated Financial Statements, if applicable, which are filed in response to Item 8 below. The selected Consolidated Statement of Operations data for the years ended February 1, 2014 and February 2, 2013 and the selected Consolidated Balance Sheet data as of January 31, 2015, February 1, 2014 and February 2, 2013 are derived from audited Consolidated Financial Statements not included herein.
|
| For the Years Ended (1) |
| |||||||||||||||||
(In thousands, except per share amounts, ratios and other |
| January 28 , |
|
| January 30, |
|
| January 31, |
|
| February 1, |
|
| February 2, |
| |||||
non-financial information) |
| 2017 |
|
| 2016 |
|
| 2015 |
|
| 2014 |
|
| 2013 |
| |||||
Summary of Operations (2) |
|
|
|
|
|
|
|
|
|
|
|
|
|
|
|
|
|
|
|
|
Total net revenue |
| $ | 3,609,865 |
|
| $ | 3,521,848 |
|
| $ | 3,282,867 |
|
| $ | 3,305,802 |
|
| $ | 3,475,802 |
|
Comparable sales increase (decrease) (3) |
|
| 3 | % |
|
| 7 | % |
|
| (5 | )% |
|
| (6 | )% |
|
| 9 | % |
Gross profit |
| $ | 1,366,927 |
|
| $ | 1,302,734 |
|
| $ | 1,154,674 |
|
| $ | 1,113,999 |
|
| $ | 1,390,322 |
|
Gross profit as a percentage of net sales |
|
| 37.9 | % |
|
| 37.0 | % |
|
| 35.2 | % |
|
| 33.7 | % |
|
| 40.0 | % |
Operating income |
| $ | 331,476 |
|
| $ | 319,878 |
|
| $ | 155,765 |
|
| $ | 141,055 |
|
| $ | 394,606 |
|
Operating income as a percentage of net sales |
|
| 9.2 | % |
|
| 9.1 | % |
|
| 4.7 | % |
|
| 4.3 | % |
|
| 11.4 | % |
Income from continuing operations |
| $ | 212,449 |
|
| $ | 213,291 |
|
| $ | 88,787 |
|
| $ | 82,983 |
|
| $ | 264,098 |
|
Income from continuing operations as a percentage of net sales |
|
| 5.9 | % |
|
| 6.1 | % |
|
| 2.6 | % |
|
| 2.5 | % |
|
| 7.6 | % |
|
|
|
|
|
|
|
|
|
|
|
|
|
|
|
|
|
|
|
|
|
Per Share Results |
|
|
|
|
|
|
|
|
|
|
|
|
|
|
|
|
|
|
|
|
Income from continuing operations per common share-basic |
| $ | 1.17 |
|
| $ | 1.10 |
|
| $ | 0.46 |
|
| $ | 0.43 |
|
| $ | 1.35 |
|
Income from continuing operations per common share-diluted |
| $ | 1.16 |
|
| $ | 1.09 |
|
| $ | 0.46 |
|
| $ | 0.43 |
|
| $ | 1.32 |
|
Weighted average common shares outstanding – basic |
|
| 181,429 |
|
|
| 194,351 |
|
|
| 194,437 |
|
|
| 192,802 |
|
|
| 196,211 |
|
Weighted average common shares outstanding – diluted |
|
| 183,835 |
|
|
| 196,237 |
|
|
| 195,135 |
|
|
| 194,475 |
|
|
| 200,665 |
|
Cash dividends per common share |
| $ | 0.50 |
|
| $ | 0.50 |
|
| $ | 0.50 |
|
| $ | 0.38 |
|
| $ | 2.05 |
|
|
|
|
|
|
|
|
|
|
|
|
|
|
|
|
|
|
|
|
|
|
Balance Sheet Information |
|
|
|
|
|
|
|
|
|
|
|
|
|
|
|
|
|
|
|
|
Total cash and short-term investments |
| $ | 378,613 |
|
| $ | 260,067 |
|
| $ | 410,697 |
|
| $ | 428,935 |
|
| $ | 630,992 |
|
Long-term investments |
| $ | - |
|
| $ | - |
|
| $ | - |
|
| $ | - |
|
| $ | - |
|
Total assets |
| $ | 1,782,660 |
|
| $ | 1,612,246 |
|
| $ | 1,696,908 |
|
| $ | 1,694,164 |
|
| $ | 1,756,053 |
|
Long & short-term debt |
| $ | - |
|
| $ | - |
|
| $ | - |
|
| $ | - |
|
| $ | - |
|
Stockholders' equity |
| $ | 1,204,569 |
|
| $ | 1,051,376 |
|
| $ | 1,139,746 |
|
| $ | 1,166,178 |
|
| $ | 1,221,187 |
|
Working capital |
| $ | 407,446 |
|
| $ | 259,693 |
|
| $ | 368,947 |
|
| $ | 462,604 |
|
| $ | 647,668 |
|
Current ratio |
|
| 1.83 |
|
|
| 1.56 |
|
|
| 1.80 |
|
|
| 2.11 |
|
|
| 2.49 |
|
Average return on stockholders' equity (5) |
|
| 18.8 | % |
|
| 19.9 | % |
|
| 7.0 | % |
|
| 7.0 | % |
|
| 17.6 | % |
|
|
|
|
|
|
|
|
|
|
|
|
|
|
|
|
|
|
|
|
|
Other Financial Information (2) |
|
|
|
|
|
|
|
|
|
|
|
|
|
|
|
|
|
|
|
|
Total stores at year-end |
|
| 1,050 |
|
|
| 1,047 |
|
|
| 1,056 |
|
|
| 1,066 |
|
|
| 1,044 |
|
Capital expenditures |
| $ | 161,494 |
|
| $ | 153,256 |
|
| $ | 245,002 |
|
| $ | 278,499 |
|
| $ | 93,939 |
|
Total net revenue per average selling square foot (4) |
| $ | 534 |
|
| $ | 545 |
|
| $ | 525 |
|
| $ | 547 |
|
| $ | 602 |
|
Total selling square feet at end of period |
|
| 5,311,659 |
|
|
| 5,285,025 |
|
|
| 5,294,744 |
|
|
| 5,205,948 |
|
|
| 4,962,923 |
|
Total net revenue per average gross square foot (4) |
| $ | 428 |
|
| $ | 436 |
|
| $ | 420 |
|
| $ | 444 |
|
| $ | 489 |
|
Total gross square feet at end of period |
|
| 6,619,267 |
|
|
| 6,601,112 |
|
|
| 6,613,100 |
|
|
| 6,503,486 |
|
|
| 6,023,278 |
|
Number of employees at end of period |
|
| 38,700 |
|
|
| 37,800 |
|
|
| 38,000 |
|
|
| 40,400 |
|
|
| 40,100 |
|
(1) | Except for the fiscal year ended February 2, 2013, which includes 53 weeks, a ll fiscal years presented include 52 weeks. |
17
(2) | All amounts presented are from continuing operations for all periods presented. Refer to Note 15 to the accompanying Consolidated Financial Statements for additional information regarding the discontinued operations of 77kids in 2012. |
(3) | The comparable sales increase for Fiscal 2012 ended February 2, 2013 is compared to the corresponding 53 week period in Fiscal 2011. Additionally, comparable sales for all periods include AEO Direct sales. |
(4) | Total net revenue per average square foot is calculated using retail store sales for the year divided by the straight average of the beginning and ending square footage for the year. |
(5) | Average return on stockholders' equity is calculated by using the annual reported net income divided by the straight average of the beginning and ending stockholders' equity balances from the consolidated balance sheets. |
Item 7. Management's Discussion and Analysis of Financial Condition and Results of Operations.
The following discussion and analysis of financial condition and results of operations are based upon our Consolidated Financial Statements and should be read in conjunction with those statements and notes thereto.
This report contains various "forward-looking statements" within the meaning of Section 27A of the Securities Act of 1933, as amended, and Section 21E of the Securities Exchange Act of 1934, as amended, which represent our expectations or beliefs concerning future events, including the following:
• | the planned opening of approximately 15 to 20 American Eagle Outfitters stores and 15 Aerie stores, and conversion of 30 to 35 Aerie side-by-side format stores in North America during Fiscal 2017; |
• | the success of our efforts to expand internationally, engage in future franchise/license agreements, and/or growth through acquisitions or joint ventures; |
• | the selection of approximately 60 to 65 American Eagle Outfitters stores in the United States and Canada for remodeling and refurbishing during Fiscal 2017; |
• | the potential closure of approximately 15 to 20 American Eagle Outfitters and 8 to 10 Aerie stores primarily in North America during Fiscal 2017; |
• | the planned opening of approximately 30 new international third-party operated American Eagle Outfitters stores during Fiscal 2017; |
• | the success of our core American Eagle Outfitters and Aerie brands through our omni-channel and licensed outlets within North America and internationally; |
• | the success of our business priorities and strategies; |
• | the expected payment of a dividend in future periods; |
• | the possibility that our credit facilities may not be available for future borrowings; |
• | the possibility that rising prices of raw materials, labor, energy and other inputs to our manufacturing process, if unmitigated, will have a significant impact to our profitability; and |
• | the possibility that we may be required to take additional store impairment charges related to underperforming stores. |
We caution that these forward-looking statements, and those described elsewhere in this report, involve material risks and uncertainties and are subject to change based on factors beyond our control, as discussed within Part I, Item 1A of this Form 10-K. Accordingly, our future performance and financial results may differ materially from those expressed or implied in any such forward-looking statement.
Critical Accounting Policies
Our Consolidated Financial Statements are prepared in accordance with accounting principles generally accepted in the United States ("GAAP"), which require us to make estimates and assumptions that may affect the reported financial condition and results of operations should actual results differ from these estimates. We base our estimates and assumptions on the best available information and believe them to be reasonable for the circumstances. We believe that of our significant accounting policies, the following involve a higher degree of judgment and complexity. Refer to Note 2 to the Consolidated Financial Statements for a complete discussion of our significant accounting policies. Management has reviewed these critical accounting policies and estimates with the Audit Committee of our Board.
18
Revenue Recognition. We record revenue for store sales upon the purchase of merchandise by customers. Our e-commerce operation records revenue upon the estimated customer receipt date of the merchandise. Revenue is not recorde d on the purchase of gift cards. A current liability is recorded upon purchase, and revenue is recognized when the gift card is redeemed for merchandise.
We estimate gift card breakage and recognize revenue in proportion to actual gift card redemptions as a component of total net revenue. We determine an estimated gift card breakage rate by continuously evaluating historical redemption data and the time when there is a remote likelihood that a gift card will be redeemed.
Revenue is recorded net of estimated and actual sales returns and deductions for coupon redemptions and other promotions. The estimated sales return reserve is based on projected merchandise returns determined through the use of historical average return percentages. We do not believe there is a reasonable likelihood that there will be a material change in the future estimates or assumptions we use to calculate our sales return reserve. However, if the actual rate of sales returns increases significantly, our operating results could be adversely affected.
We recognize royalty revenue generated from our license or franchise agreements based upon a percentage of merchandise sales by the licensee/franchisee. This revenue is recorded as a component of total net revenue when earned.
Merchandise Inventory. Merchandise inventory is valued at the lower of average cost or market, utilizing the retail method. Average cost includes merchandise design and sourcing costs and related expenses. We record merchandise receipts at the time which both title and risk of loss for the merchandise transfers to us.
We review our inventory in order to identify slow-moving merchandise and generally use markdowns to clear merchandise. Additionally, we estimate a markdown reserve for future planned markdowns related to current inventory. If inventory exceeds customer demand for reasons of style, seasonal adaptation, changes in customer preference, lack of consumer acceptance of fashion items, competition, or if it is determined that the inventory in stock will not sell at its currently ticketed price, additional markdowns may be necessary. These markdowns may have a material adverse impact on earnings, depending on the extent and amount of inventory affected.
We estimate an inventory shrinkage reserve for anticipated losses for the period between the last physical count and the balance sheet date. The estimate for the shrinkage reserve is calculated based on historical percentages and can be affected by changes in merchandise mix and changes in actual shrinkage trends. We do not believe there is a reasonable likelihood that there will be a material change in the future estimates or assumptions we use to calculate our inventory shrinkage reserve. However, if actual physical inventory losses differ significantly from our estimate, our operating results could be adversely affected.
Asset Impairment. In accordance with Financial Accounting Standards Board ("FASB") Accounting Standard Codification ("ASC") 360, Property, Plant, and Equipment ("ASC 360"), we evaluate long-lived assets for impairment at the individual store level, which is the lowest level at which individual cash flows can be identified. Impairment losses are recorded on long-lived assets used in operations when events and circumstances indicate that the assets might be impaired and the undiscounted cash flows estimated to be generated by those assets are less than the carrying amounts of the assets. When events such as these occur, the impaired assets are adjusted to their estimated fair value and an impairment loss is recorded separately as a component of operating income.
Our impairment loss calculations require management to make assumptions and to apply judgment to estimate future cash flows and asset fair values, including forecasting useful lives of the assets and selecting the discount rate that reflects the risk inherent in future cash flows. We do not believe there is a reasonable likelihood that there will be a material change in the estimates or assumptions we use to calculate long-lived asset impairment losses. However, if actual results are not consistent with our estimates and assumptions, our operating results could be adversely affected.
Share-Based Payments. We account for share-based payments in accordance with the provisions of ASC 718, Compensation – Stock Compensation ("ASC 718"). To determine the fair value of our stock option awards, we use the Black-Scholes option pricing model, which requires management to apply judgment and make assumptions to determine the fair value of our awards. These assumptions include estimating the length of time employees will retain their vested stock options before exercising them (the "expected term") and the estimated volatility of the price of our common stock over the expected term.
19
We calculate a weighted-averag e expected term based on historical experience. Expected stock price volatility is based on a combination of historical volatility of our common stock and implied volatility. We choose to use a combination of historical and implied volatility as we believe that this combination is more representative of future stock price trends than historical volatility alone. Changes in these assumptions can materially affect the estimate of the fair value of our share-based payments and the related amount recognized in our Consolidated Financial Statements.
Income Taxes. We calculate income taxes in accordance with ASC 740, Income Taxes ("ASC 740"), which requires the use of the asset and liability method. Under this method, deferred tax assets and liabilities are recognized based on the difference between the Consolidated Financial Statement carrying amounts of existing assets and liabilities and their respective tax bases as computed pursuant to ASC 740. Deferred tax assets and liabilities are measured using the tax rates, based on certain judgments regarding enacted tax laws and published guidance, in effect in the years when those temporary differences are expected to reverse. A valuation allowance is established against the deferred tax assets when it is more likely than not that some portion or all of the deferred taxes may not be realized. Changes in our level and composition of earnings, tax laws or the deferred tax valuation allowance, as well as the results of tax audits, may materially impact the effective income tax rate.
We evaluate our income tax positions in accordance with ASC 740 which prescribes a comprehensive model for recognizing, measuring, presenting and disclosing in the financial statements tax positions taken or expected to be taken on a tax return, including a decision whether to file or not to file in a particular jurisdiction. Under ASC 740, a tax benefit from an uncertain position may be recognized only if it is "more likely than not" that the position is sustainable based on its technical merits.
The calculation of the deferred tax assets and liabilities, as well as the decision to recognize a tax benefit from an uncertain position and to establish a valuation allowance require management to make estimates and assumptions. We believe that our assumptions and estimates are reasonable, although actual results may have a positive or negative material impact on the balances of deferred tax assets and liabilities, valuation allowances or net income.
Key Performance Indicators
Our management evaluates the following items, which are considered key performance indicators, in assessing our performance:
Comparable sales - Comparable sales provide a measure of sales growth for stores and channels open at least one year over the comparable prior year period. In fiscal years following those with 53 weeks, including Fiscal 2013, the prior year period is shifted by one week to compare similar calendar weeks. A store is included in comparable sales in the thirteenth month of operation. However, stores that have a gross square footage increase of 25% or greater due to a remodel are removed from the comparable sales base, but are included in total sales. These stores are returned to the comparable sales base in the thirteenth month following the remodel. Sales from American Eagle Outfitters and Aerie stores, as well as sales from AEO Direct, are included in total comparable sales. Sales from licensed stores are not included in comparable sales. Individual American Eagle Outfitters and Aerie brand comparable sales disclosures represent sales from stores and AEO Direct.
AEO Direct sales are included in the individual American Eagle Outfitters and Aerie brand comparable sales metric for the following reasons:
• | Our approach to customer engagement is "omni-channel", which provides a seamless customer experience through both traditional and non-traditional channels, including four wall store locations, web, mobile/tablet devices, social networks, email, in-store displays and kiosks. Additionally, we fulfill online orders at stores through our buy online, ship from store capability, maximizing store inventory exposure to digital traffic. We also offer a reserve online, pick up in store service to our customers and give them the ability to look up in store inventory from all digital channels; and |
• | Shopping behavior has continued to evolve across multiple channels that work in tandem to meet customer needs. Management believes that presenting a brand level performance metric that includes all channels (i.e., stores and AEO Direct) to be the most appropriate given customer behavior. |
Our management considers comparable sales to be an important indicator of our current performance. Comparable sales results are important to achieve leveraging of our costs, including store payroll, store supplies, rent, etc. Comparable sales also have a direct impact on our total net revenue, cash and working capital.
20
Gross profit - Gross profit measures whether we are optimizing the profitability of our sales. Gross profit is the difference between total net revenue and cost of sales. Cost of sales consists of: merchandise costs, including design, sourcing, importing and inbound freight costs, as well as markdowns, shrinkage and certain promotional costs (collectively "merchandise costs") and buying, occupancy and warehousing costs. Design costs consist of: compensation, rent, depreciation, travel, supplies and samples.
Buying, occupancy and warehousing costs consist of: compensation, employee benefit expenses and travel for our buyers and certain senior merchandising executives; rent and utilities related to our stores, corporate headquarters, distribution centers and other office space; freight from our distribution centers to the stores; compensation and supplies for our distribution centers, including purchasing, receiving and inspection costs; and shipping and handling costs related to our e-commerce operation.
The inability to obtain acceptable levels of sales, initial markups or any significant increase in our use of markdowns could have an adverse effect on our gross profit and results of operations.
Operating income - Our management views operating income as a key indicator of our performance. The key drivers of operating income are comparable sales, gross profit, our ability to control selling, general and administrative expenses, and our level of capital expenditures. Management also uses earnings before interest and taxes as an indicator of operating results.
Return on invested capital - Our management uses return on invested capital as a key measure to assess our efficiency at allocating capital to profitable investments. This measure is critical in determining which strategic alternatives to pursue.
Omni-channel sales performance - Our management utilizes the following quality of sales metrics in evaluating our omni-channel sales performance: Comparable sales, average unit retail price ("AUR"), units per transaction ("UPT"), average transaction value, transactions, customer traffic and conversion rates.
Inventory turnover - Our management evaluates inventory turnover as a measure of how productively inventory is bought and sold. Inventory turnover is important as it can signal slow-moving inventory. This can be critical in determining the need to take markdowns on merchandise.
Cash flow and liquidity - Our management evaluates cash flow from operations, investing and financing in determining the sufficiency of our cash position. Cash flow from operations has historically been sufficient to cover our uses of cash. Our management believes that cash flow from operations will be sufficient to fund anticipated capital expenditures, dividends and working capital requirements.
Our goals are to drive improvements to our gross profit performance, bring greater consistency to our results and deliver profitable growth over the long term.
Results of Operations
Overview
Our Fiscal 2016 performance was strong, as we executed on our key business priorities and strategy. Shifting consumer demand slowed the pace of store sales, specifically over the holiday season, and created more brick-and-mortar traffic volatility than expected. We maintained very good momentum in the digital channel, where we saw much greater consistency in consumer shopping patterns.
Our priorities are centered on superior merchandise, infused with innovation, quality fabrics and outstanding value. Product cost improvements and expense discipline led to the overall profit increase this year. We ended the year with $378.6 million in cash and no long-term debt, a 46% increase from $260.1 million in cash last year after the repurchase of 15.6 million shares for $227.1 million.
Total net revenue for the year increased 2% to $3.610 billion, compared to $3.522 billion last year. Total comparable sales increased 3%. By brand, American Eagle Outfitters brand comparable sales rose 1% and comparable sales for the Aerie brand increased 23%. Consolidated gross margin increased 90 basis points to 37.9%, compared to 37.0% last year, as a result of higher merchandise margins on increased product markup.
21
Income from continuing operations was $1.16 per diluted share this year, compared to $1.09 per diluted share last year. On an adjusted basis, income from continuing operations this year rose 24% to $1.25 per diluted share, which excludes a ($0.09) per diluted share impact from impairment and restructuring charges. These charges were the result of business performance and the company exploring an initiative to convert the UK, China, and Hong Kong markets to licensed partnerships. This compares to adjust ed income from continuing opera tions per diluted share of $1.01 last year, which excludes a $0.04 per diluted share gain from the sale of a distribution center and a $0.04 per diluted share gain from income tax settlements, higher federal tax credits and t ax strategies.
The preceding paragraph contains non-GAAP financial measures ("non-GAAP" or "adjusted"), comprised of earnings per share information excluding non-GAAP items. This financial measure is not based on any standardized methodology prescribed by U.S. generally accepted accounting principles ("GAAP") and is not necessarily comparable to similar measures presented by other companies. We believe that this non-GAAP information is useful as an additional means for investors to evaluate our operating performance, when reviewed in conjunction with our GAAP financial statements. These amounts are not determined in accordance with GAAP and, therefore, should not be used exclusively in evaluating our business and operations. The table below reconciles the GAAP financial measure to the non-GAAP financial measure discussed above.
|
| Earnings per Share |
| |
|
| For the Fiscal Year Ended |
| |
|
| January 28, 2017 |
| |
Income from continuing operations per diluted share - GAAP Basis |
| $ | 1.16 |
|
|
|
|
|
|
Add: Asset impairments & restructuring (1) |
|
| 0.07 |
|
Add: Tax (2) |
|
| 0.02 |
|
Income from continuing operations per diluted share - Non-GAAP Basis |
| $ | 1.25 |
|
|
|
|
|
|
(1) $21.2 million pre-tax asset impairments and restructuring charges relating to our operations in the United Kingdom and Asia. |
| |||
|
|
|
|
|
(2) GAAP effective tax rate included the impact of valuation allowances on asset impairment and restructuring charges. Excluding the impact of those items resulted in a 35.6% effective tax rate for the year, compared to a 36.6% GAAP effective tax rate. |
| |||
|
|
|
|
|
|
| Earnings per Share |
| |
|
| For the Fiscal Year Ended |
| |
|
| January 30, 2016 |
| |
Income from continuing operations per diluted share - GAAP Basis |
| $ | 1.09 |
|
Less: Gain on sale of Warrendale DC (1) |
|
| (0.04 | ) |
Less: Tax (2) |
|
| (0.04 | ) |
Income from continuing operations per diluted share - Non-GAAP Basis |
| $ | 1.01 |
|
|
|
|
|
|
(1) $9.4 million pre-tax gain on sale of previously closed Warrendale Distribution Center. |
| |||
|
|
|
|
|
(2) GAAP effective tax rate included the impact of income tax settlements and a decrease to the valuation allowance on foreign deferred tax assets. Excluding the impact of those items resulted in a 36.3% effective tax rate for the year, compared to a 33.7% GAAP effective tax rate. |
| |||
We ended Fiscal 2016 with $378.6 million in cash and cash equivalents, an increase of $118.5 million, or 46% from last year. During the year, we generated $365.6 million of cash from operations. The cash from operations was offset by $161.5 million of capital expenditures and $90.7 million for payment of dividends. Merchandise inventory at the end of Fiscal 2016 was $358.4 million, an increase of 17% to last year, reflecting a significantly higher level of in-transit inventory. On-hand inventory at cost was up 6% to last year and on-hand units down 3%.
22
The following table shows, for the periods indicated, the percentage relationship to total net revenue of the lis ted items included in our Consolidated Statements of Operations.
|
| For the Fiscal Years Ended |
|
| |||||||||
|
| January 28, |
|
| January 30, |
|
| January 31, |
|
| |||
|
| 2017 |
|
| 2016 |
|
| 2015 |
|
| |||
Total net revenue |
|
| 100.0 |
| % |
| 100.0 |
| % |
| 100.0 |
| % |
Cost of sales, including certain buying, occupancy and warehousing expenses |
|
| 62.1 |
|
|
| 63.0 |
|
|
| 64.8 |
|
|
Gross profit |
|
| 37.9 |
|
|
| 37.0 |
|
|
| 35.2 |
|
|
Selling, general and administrative expenses |
|
| 23.8 |
|
|
| 23.7 |
|
|
| 24.6 |
|
|
Impairment and restructuring charges |
|
| 0.6 |
|
|
| 0.0 |
|
|
| 1.6 |
|
|
Depreciation and amortization expense |
|
| 4.3 |
|
|
| 4.2 |
|
|
| 4.3 |
|
|
Operating income |
|
| 9.2 |
|
|
| 9.1 |
|
|
| 4.7 |
|
|
Other income, net |
|
| 0.1 |
|
|
| 0.1 |
|
|
| 0.1 |
|
|
Income before income taxes |
| 9.3 |
|
| 9.2 |
|
| 4.8 |
|
| |||
Provision for income taxes |
|
| 3.4 |
|
|
| 3.1 |
|
|
| 2.2 |
|
|
Income from continuing operations |
|
| 5.9 |
|
|
| 6.1 |
|
|
| 2.6 |
|
|
Gain (Loss) from discontinued operations, net of tax |
|
| - |
|
|
| 0.1 |
|
|
| (0.2 | ) |
|
Net income |
|
| 5.9 |
| % |
| 6.2 |
| % |
| 2.4 |
| % |
Comparison of Fiscal 2016 to Fiscal 2015
Total Net Revenue
Total net revenue this year increased 2% to $3.610 billion compared to $3.522 billion. For Fiscal 2016, total comparable sales increased 3% compared to a 7% increase for Fiscal 2015. By brand, including the respective AEO Direct revenue, American Eagle Outfitters brand comparable sales were up 1% or $28.5 million, and Aerie brand increased 23%, or $54.8 million. AEO brand men's comparable sales decreased in the mid-single digits and AEO brand women's comparable sales increased in the mid-single digits.
For the year, total transactions decreased in the low-single digits. Units per transaction increased slightly and AUR increased in the mid-single digits, driving the overall comparable sales increase.
Gross Profit
Gross profit increased 5% to $1.367 billion from $1.303 billion last year. On a consolidated basis, gross profit as a percent to total net revenue increased by 90 basis points to 37.9% from 37.0% last year. The improvement in gross margin reflected improved merchandise margins from higher product markup levels and flat cost of markdowns as compared to last year.
Buying, occupancy and warehousing ("BOW") costs were flat as a rate to revenue compared to last year as higher delivery costs from increased AEO Direct penetration were offset by occupany cost leverage from positive comparable sales.
There was $15.1 million of share-based payment expense, consisting of both time and performance-based awards, included in gross profit this year. This is compared to $21.0 million of share-based payment expense included in gross profit last year.
Our gross profit may not be comparable to that of other retailers, as some retailers include all costs related to their distribution network, as well as design costs in cost of sales. Other retailers may exclude a portion of these costs from cost of sales, including them in a line item such as selling, general and administrative expenses. Refer to Note 2 to the Consolidated Financial Statements for a description of our accounting policy regarding cost of sales, including certain buying, occupancy and warehousing expenses.
23
Selling, General and Administrative Expenses
Selling, general and administrative expense increased 3% to $857.6 million, compared to $834.7 million last year. As a rate to total net revenue, selling, general and administrative expenses deleveraged 10 basis points to 23.8%, compared to 23.7% last year. Last year included a $9.4 million gain on the sale of the previously closed Warrendale distribution center, which accounted for 30 basis points of deleverage year-over-year. Fiscal 2016 experienced higher advertising expense from brand campaigns, offset by lower incentive compensation.
There was $14.0 million of share-based payment expense, consisting of time and performance-based awards, included in selling, general and administrative expenses this year compared to $14.0 million last year.
Impairment and Restructuring Charges
In Fiscal 2016, impairment and restructuring charges were $21.2 million, or 0.6% as a rate to total net revenue. This amount consists of $7.2 million for the impairment of owned retail stores in the United Kingdom, Hong Kong and China, as well as $11.5 million of impairment and restructuring charges related to non-store corporate assets that support the international retail stores and e-commerce operations and $2.5 million of goodwill impairment for the China and Hong Kong retail operations. These charges are the result of business performance and exploring an initiative to convert these markets to licensed partnerships. We expect to incur additional restructuring charges in Fiscal 2017. The timing and magnitude of these charges is dependent on a number of factors, including negotiating third-party agreements, adherence to notification requirements and local laws. There were no restructuring charges in Fiscal 2015.
Depreciation and Amortization Expense
Depreciation and amortization expense increased 6% to $156.7 million from $148.2 million last year, driven by omni-channel and information technology investments, new and remodeled mainline AEO Brand stores. As a rate to total net revenue, depreciation and amortization increased 10 basis points to 4.3% from 4.2% last year.
Other Income, Net
Other income increased to $3.8 million this year, compared to $2.0 million last year, primarily as a result of foreign currency fluctuations.
Provision for Income Taxes
The effective income tax rate from continuing operations increased to 36.6% this year from 33.7% last year. This year included a 100 basis point impact to the tax rate primarily from valuation allowances on the $21.2 million of impairment and restructuring charges. Last year's effective income tax rate included a 260 basis point benefit from income tax settlements and a decrease to the valuation allowance on foreign deferred tax assets.
Refer to Note 14 to the Consolidated Financial Statements for additional information regarding our accounting for income taxes.
Income from Continuing Operations
Income from continuing operations this year was $212.4 million, or $1.16 per diluted share, and included $21.2 million of pre-tax impairment and restructuring charges, resulting in a ($0.09) per diluted share impact. Income from continuing operations last year was $213.3 million, or $1.09 per diluted share. This includes a $0.04 per diluted share gain from the sale of a distribution center and a $0.04 per diluted share gain from income tax settlements, higher federal tax credits and tax strategies.
Discontinued Operations
In 2012, we exited the 77kids business and sold the stores and related e-commerce operations to a third-party purchaser. In Fiscal 2014, we became primarily liable for 21 store leases as the third-party purchaser did not fulfill its obligations and incurred $13.7 million in pre-tax expense ($8.5 million net of tax) to terminate store leases. During Fiscal 2015, we recorded a $7.8 million pre-tax gain ($4.8 million net of tax) as a result of favorably settling lease termination obligations.
24
Refer to Note 15 to the Consolidated Financial Statements for additional information regarding the discontinued operations of 77kids.
Net Income
Net income decreased to $212.4 million this year from $218.1 million last year. As a percent to total net revenue, net income was 5.9% and 6.2% for Fiscal 2016 and Fiscal 2015, respectively. Net income per diluted share was $1.16, compared to $1.11 last year. The change in net income was attributable to the factors noted above.
Comparison of Fiscal 2015 to Fiscal 2014
Total Net Revenue
Total net revenue for Fiscal 2015 increased 7% to $3.522 billion compared to $3.283 billion for Fiscal 2014. By brand, including the respective AEO Direct revenue, American Eagle Outfitters brand comparable sales increased 7%, or $189.8 million, and Aerie brand increased 20%, or $34.6 million. AEO brand men's comparable sales increased in the low single-digits and AEO brand women's comparable sales increased in the high-single digits.
For Fiscal 2015, store transactions decreased in the low-single digits while units per transaction increased in the low-single digits and AUR increased in the high-single digits.
Gross Profit
Gross profit increased 13% to $1.303 billion in Fiscal 2015 from $1.155 billion in Fiscal 2014. On a consolidated basis, gross profit as a percent to total net revenue increased by 180 basis points to 37.0% from 35.2% in Fiscal 2014.
The improvement in gross margin was primarily due to 270 basis points of markdown improvement and 30 basis points of buying, occupancy, and warehousing ("BOW") cost leverage. This was partially offset by 120 basis points deleverage as a result of higher incentive costs.
There was $21.0 million of share-based payment expense, consisting of both time and performance-based awards, included in gross profit in Fiscal 2015. This is compared to $8.2 million of share-based payment expense included in gross in Fiscal 2014.
Our gross profit may not be comparable to that of other retailers, as some retailers include all costs related to their distribution network, as well as design costs in cost of sales. Other retailers may exclude a portion of these costs from cost of sales, including them in a line item such as selling, general and administrative expenses. Refer to Note 2 to the Consolidated Financial Statements for a description of our accounting policy regarding cost of sales, including certain buying, occupancy and warehousing expenses.
Selling, General and Administrative Expenses
Selling, general and administrative expense increased 3% to $834.7 million in Fiscal 2015, compared to $806.5 million in Fiscal 2014. The increase in Fiscal 2015 was primarily due to higher incentive costs and investments in digital marketing, which were offset by a gain of $9.4 million on the sale of the previously closed Warrendale distribution center and savings from expense reduction initiatives. As a rate to total net revenue, selling, general, and administrative expenses improved 90 basis points to 23.7%, compared to 24.6% in Fiscal 2014.
There was $14.0 million of share-based payment expense, consisting of time and performance-based awards, included in selling, general and administrative expenses in Fiscal 2015 compared to $7.9 million in Fiscal 2014.
Impairment and Restructuring Charges
Impairment charges in Fiscal 2014 was the result of a store fleet and corporate location review and challenging performance in Fiscal 2014, and consisted of $25.1 million for the impairment of 48 AEO Brand and 31 Aerie stores and $8.4 million for corporate items.
25
The restructuring charges of $17.8 million consisted of corporate overhead reductions and office space consolidation. These charges were aimed at strengthening our corporate assets. Corporate overhead expenses eliminated redundancies at the h ome office. These changes were aimed at driving efficiencies and aligning investments in areas that help fuel the business. There were no impairment and restructuring charges in Fiscal 2015.
Depreciation and Amortization Expense
Depreciation and amortization expense increased to $148.2 million in Fiscal 2015 from $141.2 million in Fiscal 2014, driven by omni-channel and IT investments, new factory and international stores, and a new fulfillment center.
Other Income, Net
Other income was $2.0 million in Fiscal 2015, compared to $3.7 million in Fiscal 2014, primarily as a result of foreign currency fluctuations.
Provision for Income Taxes
The effective income tax rate from continuing operations decreased to 33.7% in Fiscal 2015 from 44.3% in Fiscal 2014. The lower effective income tax rate in Fiscal 2015 was primarily due to an increase in world-wide earnings, income tax settlements, higher federal tax credits, and a decrease to the valuation allowance on foreign deferred tax assets. The impact of income tax settlements and a decrease to the valuation on foreign deferred tax assets in Fiscal 2015 was a 260 basis point decrease in the effective income tax rate.
Refer to Note 14 to the Consolidated Financial Statements for additional information regarding our accounting for income taxes.
Income from Continuing Operations
Income from continuing operations for Fiscal 2015 was $213.3 million, or $1.09 per diluted share. Income from continuing operations in Fiscal 2014 was $88.8 million, or $0.46 per diluted share. This includes $51.2 million, or ($0.17) per diluted share, of after-tax impairment charges, asset write-offs, corporate charges and tax related items.
Discontinued Operations
We completed the sale of the 77kids stores and related e-commerce operations during 2012. Accordingly, the after-tax operating results appear in Loss from Discontinued Operations on the Consolidated Statements of Operations for all periods presented.
In Fiscal 2014, we became primarily liable for 21 store leases as the third-party purchaser did not fulfill its obligations. We incurred $13.7 million in pre-tax expense to terminate store leases. Loss from Discontinued Operations, net of tax, was $8.5 million or ($0.04) per diluted share for Fiscal 2014. During Fiscal 2015, we recorded a $7.8 million pre-tax gain ($4.8 million net of tax) as a result of favorably settling lease termination obligations.
Refer to Note 15 to the Consolidated Financial Statements for additional information regarding the discontinued operations of 77kids.
Net Income
Net income increased to $218.1 million in Fiscal 2015 from $80.3 million in Fiscal 2014. As a percent to total net revenue, net income was 6.2% and 2.4% for Fiscal 2015 and Fiscal 2014, respectively. Net income per diluted share was $1.11, compared to $0.42 in Fiscal 2014. The change in net income was attributable to the factors noted above.
Fair Value Measurements
ASC 820 defines fair value, establishes a framework for measuring fair value in accordance with GAAP, and expands disclosures about fair value measurements. Fair value is defined under ASC 820 as the exit price associated with the sale of an asset or transfer of a liability in an orderly transaction between market participants at the measurement date:
26
Financial Instruments
Valuation techniques used to measure fair value under ASC 820 must maximize the use of observable inputs and minimize the use of unobservable inputs. In addition, ASC 820 establishes this three-tier fair value hierarchy, which prioritizes the inputs used in measuring fair value. These tiers include:
• | Level 1 - Quoted prices in active markets for identical assets or liabilities. |
• | Level 2 - Inputs other than Level 1 that are observable, either directly or indirectly, such as quoted prices for similar assets or liabilities; quoted prices in markets that are not active; or other inputs that are observable or can be corroborated by observable market data for substantially the full term of the assets or liabilities. |
• | Level 3 - Unobservable inputs (i.e., projections, estimates, interpretations, etc.) that are supported by little or no market activity and that are significant to the fair value of the assets or liabilities. |
As of January 28, 2017 and January 30, 2016, we held certain assets that are required to be measured at fair value on a recurring basis. These include cash equivalents and investments.
In accordance with ASC 820, the following tables represent the fair value hierarchy for our financial assets (cash equivalents and investments) measured at fair value on a recurring basis as of January 28, 2017.
| Fair Value Measurements at January 28, 2017 |
| |||||||||||||
(In thousands) | Carrying Amount |
|
| Quoted Market Prices in Active Markets for Identical Assets (Level 1) |
|
| Significant Other Observable Inputs (Level 2) |
|
| Significant Unobservable Inputs (Level 3) |
| ||||
Cash and cash equivalents |
|
|
|
|
|
|
|
|
|
|
|
|
|
|
|
Cash | $ | 265,332 |
|
| $ | 265,332 |
|
|
|
|
|
|
|
|
|
Interest bearing deposits |
| 83,281 |
|
|
| 83,281 |
|
|
| - |
|
|
| - |
|
Commercial paper |
| 30,000 |
|
|
| 30,000 |
|
|
| - |
|
|
| - |
|
Total cash and cash equivalents | $ | 378,613 |
|
|
| 378,613 |
|
|
| - |
|
|
| - |
|
Percent to total |
| 100 | % |
|
| 100 | % |
|
| - |
|
|
| - |
|
In the event we hold Level 3 investments, a discounted cash flow model is used to value those investments. There were no Level 3 investments at January 28, 2017.
Liquidity and Capital Resources
Our uses of cash are generally for working capital, the construction of new stores and remodeling of existing stores, information technology upgrades, distribution center improvements and expansion and the return of value to shareholders through the repurchase of common stock and the payment of dividends. Historically, these uses of cash have been funded with cash flow from operations and existing cash on hand. Also, we hold a five-year asset-based revolving credit facility that allows us to borrow up to $400 million. Additionally, our uses of cash include the development of the Aerie brand, investments in technology and omni-channel capabilities, and our international expansion efforts. We expect to be able to fund our future cash requirements in North America through current cash holdings as well as cash generated from operations.
Our growth strategy includes fortifying our brands and further international expansion or acquisitions. We periodically consider and evaluate these options to support future growth. In the event we do pursue such options, we could require additional equity or debt financing. There can be no assurance that we would be successful in closing any potential transaction, or that any endeavor we undertake would increase our profitability.
The following sets forth certain measures of our liquidity:
|
| January 28, |
|
| January 30, |
| ||
|
| 2017 |
|
| 2016 |
| ||
Working Capital (in 000's) |
| $ | 407,446 |
|
| $ | 259,693 |
|
Current Ratio |
|
| 1.83 |
|
|
| 1.56 |
|
27
The $147.8 million increase in our working capital and corresponding increase in the current ratio as of January 28, 2017 compared to January 30, 2016, is driven by our cash flow from operations of $365.4 million, partially offset by ou r capital expenditures of $161.5 million and dividends of $90.7 million. Operating c ash flow from continuing operations and capital expenditur es were $341.9 million and $153.2 million, respectively, last year. In Fiscal 2015, we repurchased 15.6 million shares for $227.1 million under public ly announced programs. There were no shares repurcha sed under publically announced programs in Fiscal 2016.
Cash Flows from Operating Activities of Continuing Operations
Net cash provided by operating activities totaled $365.6 million during Fiscal 2016, compared to $341.9 million during Fiscal 2015 and $338.4 during Fiscal 2014. Our major source of cash from operations was merchandise sales. Our primary outflows of cash from operations were for the payment of operational costs. The year-over-year increase in cash flows from operations this year was primarily driven by the increase in income from continuing operations, net of non-cash adjustments.
Cash Flows from Investing Activities of Continuing Operations
Investing activities for Fiscal 2016 included $161.5 million in capital expenditures for property and equipment. Investing activities for Fiscal 2015 included $153.3 million in capital expenditures for property and equipment, cash paid for our acquisition of Tailgate Clothing Company of $10.4 million, and the purchase of intangible assets of $2.4 million, partially offset by $12.6 million of proceeds from the sale of the Warrendale Distribution Center. Investing activities for Fiscal 2014 included $245.0 million in capital expenditures for property and equipment, partially offset by $10.0 million of proceeds from the sale of investments classified as available-for-sale. For further information on capital expenditures, refer to the Capital Expenditures for Property and Equipment caption below.
Cash Flows from Financing Activities of Continuing Operations
During Fiscal 2016, cash used for financing activities resulted primarily from $90.7 million for the payment of dividends and $7.0 million for the repurchase of common stock from employees for the payment of taxes in connection with the vesting of share-based payments. This was partially offset by $16.2 million of net proceeds received from the exercise of stock options. During Fiscal 2015, cash used for financing activities resulted primarily from $227.1 million for the repurchase of shares as part of our publicly announced repurchase program, $97.2 million for the payment of dividends and $5.2 million for the repurchase of common stock from employees for the payment of taxes in connection with the vesting of share-based payments. During Fiscal 2014, cash used for financing activities resulted primarily from $97.2 million for the payment of dividends and $7.5 million for the repurchase of common stock from employees for the payment of taxes in connection with the vesting of share-based payments.
Cash returned to shareholders through dividends and share repurchases was $90.7 million, $324.3 million and $97.2 million in Fiscal 2016, Fiscal 2015 and Fiscal 2014, respectively.
ASC 718 requires that cash flows resulting from the benefits of tax deductions in excess of recognized compensation cost for share-based payments be classified as financing cash flows. Accordingly, for Fiscal 2016, Fiscal 2015 and Fiscal 2014, the excess tax benefits from share-based payments of $0.8 million, $0.7 million and $0.7 million, respectively, are classified as financing cash flows.
Capital Expenditures for Property and Equipment
Fiscal 2016 capital expenditures were $161.5 million, compared to $153.3 million in Fiscal 2015. Fiscal 2016 expenditures included $74.3 million related to investments in our AEO stores, including 29 new AEO stores, 63 remodeled and refurbished stores, and fixtures and visual investments. Additionally, we continued to support our infrastructure growth by investing in information technology ($36.4 million), the improvement of our distribution centers ($10.3 million) and investments in e-commerce ($28.8 million) and other home office projects ($11.7 million).
For Fiscal 2017, we expect capital expenditures to remain relatively flat related to the continued support of our expansion efforts, stores, information technology upgrades to support growth and investments in e-commerce.
28
Credit Facilities
In 2014, we entered into a Credit Agreement ("Credit Agreement") for a five-year, syndicated, asset-based revolving credit facilities (the "Credit Facilities"). The Credit Agreement provides senior secured revolving credit for loans and letters of credit up to $400 million, subject to customary borrowing base limitations. The Credit Facilities provide increased financial flexibility and take advantage of a favorable credit environment.
All obligations under the Credit Facilities are unconditionally guaranteed by certain subsidiaries. The obligations under the Credit Agreement are secured by a first-priority security interest in certain working capital assets of the borrowers and guarantors, consisting primarily of cash, receivables, inventory and certain other assets and have been further secured by first-priority mortgages on certain real property.
As of January 28, 2017, we were in compliance with the terms of the Credit Agreement and had $5.7 million outstanding in stand-by letters of credit. No loans were outstanding under the Credit Agreement as of January 28, 2017.
Additionally, we have a borrowing agreement with one financial institution under which we may borrow an aggregate of $5 million USD for the purposes of trade letter of credit issuances. The availability of any future borrowings under the trade letter of credit facilities is subject to acceptance by the respective financial institutions.
As of January 28, 2017, we had no outstanding trade letters of credit.
Stock Repurchases
During Fiscal 2015, as part of our publicly announced share repurchase program, we repurchased 15.6 million shares for approximately $227.1 million, at a weighted average price of $14.57 per share. During Fiscal 2016 and Fiscal 2014, there were no share repurchases as a part of our publicly announced repurchase programs. On January 28, 2017, 2.8 million shares remaining authorized for repurchase under the program authorized by our Board in January 2013 expired. In Fiscal 2016, our Board authorized 25.0 million shares under a new share repurchase program which expires on January 30, 2021.
During Fiscal 2016, Fiscal 2015 and Fiscal 2014, we repurchased approximately 0.5 million, 0.3 million and 0.5 million shares, respectively, from certain employees at market prices totaling $7.0 million, $5.2 million and $7.5 million, respectively. These shares were repurchased for the payment of taxes, not in excess of the minimum statutory withholding requirements, in connection with the vesting of share-based payments.
The aforementioned share repurchases have been recorded as treasury stock.
Dividends
A $0.125 per share dividend was paid for each quarter of Fiscal 2016, resulting in a dividend yield of 3.1% for the trailing twelve months ended January 28, 2017. During Fiscal 2015, a $0.125 per share dividend was paid for each quarter, resulting in a dividend yield of 3.4% for the trailing twelve months ended January 30, 2016. Subsequent to the fourth quarter of Fiscal 2016, our Board declared a quarterly cash dividend of $0.125 per share, payable on April 21, 2017 to stockholders of record at the close of business on April 7, 2017. The payment of future dividends is at the discretion of our Board and is based on future earnings, cash flow, financial condition, capital requirements, changes in U.S. taxation and other relevant factors. It is anticipated that any future dividends paid will be declared on a quarterly basis.
29
Obligations and Commitments
Disclosure about Contractual Obligations
The following table summarizes our significant contractual obligations as of January 28, 2017:
|
| Payments Due by Period |
| |||||||||||||||||
|
|
|
|
|
| Less than |
|
| 1-3 |
|
| 3-5 |
|
| More than |
| ||||
(In thousands) |
| Total |
|
| 1 Year |
|
| Years |
|
| Years |
|
| 5 Years |
| |||||
Operating leases (1) |
| $ | 1,655,742 |
|
| $ | 287,822 |
|
| $ | 488,932 |
|
| $ | 389,249 |
|
| $ | 489,739 |
|
Unrecognized tax benefits (2) |
|
| 8,444 |
|
|
| 3,907 |
|
|
| - |
|
|
| - |
|
|
| 4,537 |
|
Purchase obligations (3) |
|
| 495,482 |
|
|
| 493,409 |
|
|
| 1,481 |
|
|
| 592 |
|
|
| - |
|
Total contractual obligations |
| $ | 2,159,668 |
|
| $ | 785,138 |
|
| $ | 490,413 |
|
| $ | 389,841 |
|
| $ | 494,276 |
|
(1) | Operating lease obligations consist primarily of future minimum lease commitments related to store operating leases (Refer to Note 10 to the Consolidated Financial Statements). Operating lease obligations do not include common area maintenance, insurance or tax payments for which we are also obligated. |
(2) | The amount of unrecognized tax benefits as of January 28, 2017 was $8.4 million, including approximately $1.4 million of accrued interest and penalties. Unrecognized tax benefits are positions taken or expected to be taken on an income tax return that may result in additional payments to tax authorities. We anticipate $3.9 million of unrecognized tax benefits will be realized within one year. The remaining balance of unrecognized tax benefits of $4.5 million is included in the "More than 5 Years" column as we are not able to reasonably estimate the timing of the potential future payouts. |
(3) | Purchase obligations primarily include binding commitments to purchase merchandise inventory, as well as other legally binding commitments, made in the normal course of business that are enforceable and specify all significant terms. |
Disclosure about Commercial Commitments
The following table summarizes our significant commercial commitments as of January 28, 2017:
|
| Amount of Commitment Expiration Per Period |
| |||||||||||||||||
|
| Total Amount |
|
| Less than |
|
| 1-3 |
|
| 3-5 |
|
| More than |
| |||||
(In thousands) |
| Committed |
|
| 1 Year |
|
| Years |
|
| Years |
|
| 5 Years |
| |||||
Standby letters of credit (1) |
|
| 5,674 |
|
|
| 5,674 |
|
|
| - |
|
|
| - |
|
|
| - |
|
Total commercial commitments |
| $ | 5,674 |
|
| $ | 5,674 |
|
|
| - |
|
|
| - |
|
|
| - |
|
(1) | Standby letters of credit represent commitments, guaranteed by a bank, to pay vendors to the extent previously agreed criteria are not met. |
Off-Balance Sheet Arrangements
We are not a party to any off-balance sheet arrangements.
Recent Accounting Pronouncements
Recent accounting pronouncements are disclosed in Note 2 of the Consolidated Financial Statements.
Impact of Inflation
Historically, fluctuations in the price of raw materials used in the manufacture of merchandise we purchase from suppliers have impacted our cost of sales. Future changes in these costs, in addition to increases in the price of labor, energy and other inputs to the manufacture of our merchandise, could negatively impact our business and the industry in the future.
30
Item 7A. Quantitative and Qualita tive Disclosures about Market Risk
We have market risk exposure related to interest rates and foreign currency exchange rates. Market risk is measured as the potential negative impact on earnings, cash flows or fair values resulting from a hypothetical change in interest rates or foreign currency exchange rates over the next year.
Interest Rate Risk
Our earnings are not materially affected by changes in market interest rates. If our Fiscal 2016 average yield rate decreases by 10% in Fiscal 2017, our income before taxes will decrease by approximately $0.1 million. Comparatively, if our Fiscal 2015 average yield rate had decreased by 10% in Fiscal 2016, our income before taxes would have decreased by approximately $0.1 million. These amounts are determined by considering the impact of the hypothetical yield rates on our cash and investment balances and assumes no change in our investment structure.
Foreign Exchange Rate Risk
We are primarily exposed to the impact of foreign exchange rate risk primarily through our Canadian and Mexican operations where the functional currency is the Canadian dollar and Mexican peso, respectively. The impact of all other foreign currencies is currently immaterial to our financial results. We do not utilize hedging instruments to mitigate foreign currency exchange risks. A hypothetical 10% movement in the Canadian dollar and Mexican peso exchange rate could result in a $15.2 million foreign currency translation fluctuation, which would be recorded in accumulated other comprehensive income within the consolidated balance sheets. An unrealized loss of $36.5 million is included in accumulated other comprehensive income as of January 28, 2017. Additionally, a hypothetical 10% movement in the Canadian dollar and Mexican Peso exchange rate could result in a $5.9 million foreign currency re-measurement fluctuation, which is recorded in other income, net within the consolidated statements of operations.
31
Item 8. Financial Statemen ts and Supplementary Data.
Index to Consolidated Financial Statements
Report of Independent Registered Public Accounting Firm | 33 |
Consolidated Balance Sheets | 34 |
Consolidated Statements of Operations | 35 |
Consolidated Statements of Comprehensive Income | 36 |
Consolidated Statements of Stockholders' Equity | 37 |
Consolidated Statements of Cash Flows | 38 |
Notes to Consolidated Financial Statements | 39 |
32
Report of Independent Regist ered Public Accounting Firm
The Board of Directors and Stockholders of
American Eagle Outfitters, Inc.
We have audited the accompanying consolidated balance sheets of American Eagle Outfitters, Inc. as of January 28, 2017 and January 30, 2016, and the related consolidated statements of operations, comprehensive income, stockholders' equity and cash flows for each of the three years in the period ended January 28, 2017. These financial statements are the responsibility of the Company's management. Our responsibility is to express an opinion on these financial statements based on our audits.
We conducted our audits in accordance with the standards of the Public Company Accounting Oversight Board (United States). Those standards require that we plan and perform the audit to obtain reasonable assurance about whether the financial statements are free of material misstatement. An audit includes examining, on a test basis, evidence supporting the amounts and disclosures in the financial statements. An audit also includes assessing the accounting principles used and significant estimates made by management, as well as evaluating the overall financial statement presentation. We believe that our audits provide a reasonable basis for our opinion.
In our opinion, the financial statements referred to above present fairly, in all material respects, the consolidated financial position of American Eagle Outfitters, Inc. at January 28, 2017 and January 30, 2016, and the consolidated results of its operations and its cash flows for each of the three years in the period ended January 28, 2017, in conformity with U.S. generally accepted accounting principles.
We also have audited, in accordance with the standards of the Public Company Accounting Oversight Board (United States), American Eagle Outfitters, Inc. 's internal control over financial reporting as of January 28, 2017, based on criteria established in Internal Control-Integrated Framework issued by the Committee of Sponsoring Organizations of the Treadway Commission (2013 framework) and our report dated March 10, 2017 expressed an unqualified opinion thereon.
/s/ Ernst & Young LLP
Pittsburgh, Pennsylvania
March 10, 2017
33
AMERICAN EAGLE OUTFITTERS, INC.
Consolidated Balance Sheets
|
| January 28, |
|
| January 30, |
| ||
(In thousands, except per share amounts) |
| 2017 |
|
| 2016 |
| ||
Assets |
|
|
|
|
|
|
|
|
Current assets: |
|
|
|
|
|
|
|
|
Cash and cash equivalents |
| $ | 378,613 |
|
| $ | 260,067 |
|
Merchandise inventory |
|
| 358,446 |
|
|
| 305,178 |
|
Accounts receivable |
|
| 86,634 |
|
|
| 80,912 |
|
Prepaid expenses and other |
|
| 77,536 |
|
|
| 77,218 |
|
Total current assets |
|
| 901,229 |
|
|
| 723,375 |
|
Property and equipment, at cost, net of accumulated depreciation |
|
| 707,797 |
|
|
| 703,586 |
|
Intangible assets, at cost, net of accumulated amortization |
|
| 49,373 |
|
|
| 51,832 |
|
Goodwill |
|
| 14,887 |
|
|
| 17,186 |
|
Deferred income taxes |
|
| 49,250 |
|
|
| 64,927 |
|
Other assets |
|
| 60,124 |
|
|
| 51,340 |
|
Total assets |
| $ | 1,782,660 |
|
| $ | 1,612,246 |
|
|
|
|
|
|
|
|
|
|
Liabilities and Stockholders' Equity |
|
|
|
|
|
|
|
|
Current liabilities: |
|
|
|
|
|
|
|
|
Accounts payable |
| $ | 246,204 |
|
| $ | 182,789 |
|
Accrued compensation and payroll taxes |
|
| 54,184 |
|
|
| 79,302 |
|
Accrued rent |
|
| 78,619 |
|
|
| 77,482 |
|
Accrued income and other taxes |
|
| 12,220 |
|
|
| 22,223 |
|
Unredeemed gift cards and gift certificates |
|
| 52,966 |
|
|
| 48,274 |
|
Current portion of deferred lease credits |
|
| 12,780 |
|
|
| 12,711 |
|
Other liabilities and accrued expenses |
|
| 36,810 |
|
|
| 40,901 |
|
Total current liabilities |
|
| 493,783 |
|
|
| 463,682 |
|
Non-current liabilities: |
|
|
|
|
|
|
|
|
Deferred lease credits |
|
| 45,114 |
|
|
| 50,104 |
|
Non-current accrued income taxes |
|
| 4,537 |
|
|
| 4,566 |
|
Other non-current liabilities |
|
| 34,657 |
|
|
| 42,518 |
|
Total non-current liabilities |
|
| 84,308 |
|
|
| 97,188 |
|
Commitments and contingencies |
|
| - |
|
|
| - |
|
Stockholders' equity: |
|
|
|
|
|
|
|
|
Preferred stock, $0.01 par value; 5,000 shares authorized; none issued and outstanding |
|
| - |
|
|
| - |
|
Common stock, $0.01 par value; 600,000 shares authorized; 249,566 shares issued; 181,886 and 180,135 shares outstanding, respectively |
|
| 2,496 |
|
|
| 2,496 |
|
Contributed capital |
|
| 603,890 |
|
|
| 590,820 |
|
Accumulated other comprehensive loss, net of tax |
|
| (36,462 | ) |
|
| (29,868 | ) |
Retained earnings |
|
| 1,775,775 |
|
|
| 1,659,267 |
|
Treasury stock, 67,680 and 69,431 shares, respectively, at cost |
|
| (1,141,130 | ) |
|
| (1,171,339 | ) |
Total stockholders' equity |
|
| 1,204,569 |
|
|
| 1,051,376 |
|
Total liabilities and stockholders' equity |
| $ | 1,782,660 |
|
| $ | 1,612,246 |
|
Refer to Notes to Consolidated Financial Statements
34
AMERICAN EAGLE O UTFITTERS, INC.
Consolidated Statements of Operations
|
| For the Years Ended |
| |||||||||
|
| January 28, |
|
| January 30, |
|
| January 31, |
| |||
(In thousands, except per share amounts) |
| 2017 |
|
| 2016 |
|
| 2015 |
| |||
Total net revenue |
| $ | 3,609,865 |
|
| $ | 3,521,848 |
|
| $ | 3,282,867 |
|
Cost of sales, including certain buying, occupancy and warehousing expenses |
|
| 2,242,938 |
|
|
| 2,219,114 |
|
|
| 2,128,193 |
|
Gross profit |
|
| 1,366,927 |
|
|
| 1,302,734 |
|
|
| 1,154,674 |
|
Selling, general and administrative expenses |
|
| 857,562 |
|
|
| 834,700 |
|
|
| 806,498 |
|
Impairment and restructuring charges |
|
| 21,166 |
|
|
| - |
|
|
| 51,220 |
|
Depreciation and amortization expense |
|
| 156,723 |
|
|
| 148,156 |
|
|
| 141,191 |
|
Operating income |
|
| 331,476 |
|
|
| 319,878 |
|
|
| 155,765 |
|
Other income, net |
|
| 3,786 |
|
|
| 1,993 |
|
|
| 3,737 |
|
Income before income taxes |
|
| 335,262 |
|
|
| 321,871 |
|
|
| 159,502 |
|
Provision for income taxes |
|
| 122,813 |
|
|
| 108,580 |
|
|
| 70,715 |
|
Income from continuing operations |
|
| 212,449 |
|
|
| 213,291 |
|
|
| 88,787 |
|
Discontinued operations, net of tax |
|
| - |
|
|
| 4,847 |
|
|
| (8,465 | ) |
Net income |
| $ | 212,449 |
|
| $ | 218,138 |
|
| $ | 80,322 |
|
|
|
|
|
|
|
|
|
|
|
|
|
|
Basic income per common share: |
|
|
|
|
|
|
|
|
|
|
|
|
Income from continuing operations |
| $ | 1.17 |
|
| $ | 1.10 |
|
| $ | 0.46 |
|
Discontinued operations |
|
| - |
|
|
| 0.02 |
|
|
| (0.04 | ) |
Basic net income per common share |
| $ | 1.17 |
|
| $ | 1.12 |
|
| $ | 0.42 |
|
|
|
|
|
|
|
|
|
|
|
|
|
|
Diluted income per common share: |
|
|
|
|
|
|
|
|
|
|
|
|
Income from continuing operations |
| $ | 1.16 |
|
| $ | 1.09 |
|
| $ | 0.46 |
|
Discontinued operations |
|
| - |
|
|
| 0.02 |
|
|
| (0.04 | ) |
Diluted net income per common share |
| $ | 1.16 |
|
| $ | 1.11 |
|
| $ | 0.42 |
|
|
|
|
|
|
|
|
|
|
|
|
|
|
Weighted average common shares outstanding - basic |
|
| 181,429 |
|
|
| 194,351 |
|
|
| 194,437 |
|
Weighted average common shares outstanding - diluted |
|
| 183,835 |
|
|
| 196,237 |
|
|
| 195,135 |
|
Refer to Notes to Consolidated Financial Statements
35
AMERICAN EAGLE OUTFITTERS, INC.
Consolidated Statements of Comprehensive Income
|
| For the Years Ended |
| |||||||||
|
| January 28, |
|
| January 30, |
|
| January 31, |
| |||
(In thousands) |
| 2017 |
|
| 2016 |
|
| 2015 |
| |||
Net income |
| $ | 212,449 |
|
| $ | 218,138 |
|
| $ | 80,322 |
|
Other comprehensive loss: |
|
|
|
|
|
|
|
|
|
|
|
|
Foreign currency translation loss |
|
| (6,594 | ) |
|
| (19,924 | ) |
|
| (22,101 | ) |
Other comprehensive loss |
|
| (6,594 | ) |
|
| (19,924 | ) |
|
| (22,101 | ) |
Comprehensive income |
| $ | 205,855 |
|
| $ | 198,214 |
|
| $ | 58,221 |
|
Refer to Notes to Consolidated Financial Statements
36
AMERICAN EAGLE OUTFITTERS, INC.
Consolidated Statements of Stockholders' Equity
(In thousands, except per share amounts) |
| Shares Outstanding (1) |
|
| Common Stock |
|
| Contributed Capital |
|
| Retained Earnings |
|
| Treasury Stock (2) |
|
| Accumulated Other Comprehensive Income (Loss) |
|
| Stockholders' Equity |
| |||||||
Balance at February 1, 2014 |
|
| 193,149 |
|
| $ | 2,496 |
|
| $ | 573,008 |
|
| $ | 1,569,851 |
|
| $ | (991,334 | ) |
| $ | 12,157 |
|
| $ | 1,166,178 |
|
Stock awards |
|
| - |
|
|
| - |
|
|
| 12,372 |
|
|
| - |
|
|
| - |
|
|
| - |
|
|
| 12,372 |
|
Repurchase of common stock as part of publicly announced programs |
|
| - |
|
|
| - |
|
|
| - |
|
|
| - |
|
|
| - |
|
|
| - |
|
|
| - |
|
Repurchase of common stock from employees |
|
| (517 | ) |
|
| - |
|
|
| - |
|
|
| - |
|
|
| (7,464 | ) |
|
| - |
|
|
| (7,464 | ) |
Reissuance of treasury stock |
|
| 1,884 |
|
|
| - |
|
|
| (17,988 | ) |
|
| (7,503 | ) |
|
| 33,232 |
|
|
| - |
|
|
| 7,741 |
|
Net income |
|
| - |
|
|
| - |
|
|
| - |
|
|
| 80,322 |
|
|
| - |
|
|
| - |
|
|
| 80,322 |
|
Other comprehensive loss |
|
| - |
|
|
| - |
|
|
| - |
|
|
| - |
|
|
| - |
|
|
| (22,101 | ) |
|
| (22,101 | ) |
Cash dividends and dividend equivalents ($0.50 per share) |
|
| - |
|
|
| - |
|
|
| 2,283 |
|
|
| (99,585 | ) |
|
| - |
|
|
| - |
|
|
| (97,302 | ) |
Balance at January 31, 2015 |
|
| 194,516 |
|
| $ | 2,496 |
|
| $ | 569,675 |
|
| $ | 1,543,085 |
|
| $ | (965,566 | ) |
| $ | (9,944 | ) |
| $ | 1,139,746 |
|
Stock awards |
|
| - |
|
|
| - |
|
|
| 31,937 |
|
|
| - |
|
|
| - |
|
|
| - |
|
|
| 31,937 |
|
Repurchase of common stock as part of publicly announced programs |
|
| (15,563 | ) |
|
| - |
|
|
| - |
|
|
| - |
|
|
| (227,071 | ) |
|
| - |
|
|
| (227,071 | ) |
Repurchase of common stock from employees |
|
| (324 | ) |
|
| - |
|
|
| - |
|
|
| - |
|
|
| (5,163 | ) |
|
| - |
|
|
| (5,163 | ) |
Reissuance of treasury stock |
|
| 1,506 |
|
|
| - |
|
|
| (13,237 | ) |
|
| (2,332 | ) |
|
| 26,461 |
|
|
| - |
|
|
| 10,892 |
|
Net income |
|
| - |
|
|
| - |
|
|
| - |
|
|
| 218,138 |
|
|
| - |
|
|
| - |
|
|
| 218,138 |
|
Other comprehensive loss |
|
| - |
|
|
| - |
|
|
| - |
|
|
| - |
|
|
| - |
|
|
| (19,924 | ) |
|
| (19,924 | ) |
Cash dividends and dividend equivalents ($0.50 per share) |
|
| - |
|
|
| - |
|
|
| 2,445 |
|
|
| (99,624 | ) |
|
| - |
|
|
| - |
|
|
| (97,179 | ) |
Balance at January 30, 2016 |
|
| 180,135 |
|
| $ | 2,496 |
|
| $ | 590,820 |
|
| $ | 1,659,267 |
|
| $ | (1,171,339 | ) |
| $ | (29,868 | ) |
| $ | 1,051,376 |
|
Stock awards |
|
| - |
|
|
| - |
|
|
| 27,877 |
|
|
| - |
|
|
| - |
|
|
| - |
|
|
| 27,877 |
|
Repurchase of common stock as part of publicly announced programs |
|
| - |
|
|
| - |
|
|
| - |
|
|
| - |
|
|
| - |
|
|
| - |
|
|
| - |
|
Repurchase of common stock from employees |
|
| (455 | ) |
|
| - |
|
|
| - |
|
|
| - |
|
|
| (7,032 | ) |
|
| - |
|
|
| (7,032 | ) |
Reissuance of treasury stock |
|
| 2,206 |
|
|
| - |
|
|
| (17,247 | ) |
|
| (2,821 | ) |
|
| 37,241 |
|
|
| - |
|
|
| 17,174 |
|
Net income |
|
| - |
|
|
| - |
|
|
| - |
|
|
| 212,449 |
|
|
| - |
|
|
| - |
|
|
| 212,449 |
|
Other comprehensive loss |
|
| - |
|
|
| - |
|
|
| - |
|
|
| - |
|
|
| - |
|
|
| (6,594 | ) |
|
| (6,594 | ) |
Cash dividends and dividend equivalents ($0.50 per share) |
|
| - |
|
|
| - |
|
|
| 2,440 |
|
|
| (93,120 | ) |
|
| - |
|
|
| - |
|
|
| (90,680 | ) |
Balance at January 28, 2017 |
|
| 181,886 |
|
| $ | 2,496 |
|
| $ | 603,890 |
|
| $ | 1,775,775 |
|
| $ | (1,141,130 | ) |
| $ | (36,462 | ) |
| $ | 1,204,569 |
|
(1) | 600,000 authorized, 249,566 issued and 181,886 outstanding, $0.01 par value common stock at January 28, 2017; 600,000 authorized, 249,566 issued and 180,135 outstanding, $0.01 par value common stock at January 30, 2016; 600,000 authorized, 249,566 issued and 194,516 outstanding, $0.01 par value common stock at January 31, 2015; 600,000 authorized 249,566 issued and 193,149 outstanding, $0.01 par value common stock at February 1, 2014. The Company has 5,000 authorized, with none issued or outstanding, $0.01 par value preferred stock for all periods presented. |
(2) | 67,680 shares, 69,431 shares and 55,050 shares at January 28, 2017, January 30, 2016 and January 31, 2015 respectively. During Fiscal 2016, Fiscal 2015, and Fiscal 2014, 2,206 shares, 1,506 shares, and 1,884 shares, respectively, were reissued from treasury stock for the issuance of share-based payments. |
Refer to Notes to Consolidated Financial Statements
37
AMERICAN EAGLE OUTFITTERS, INC.
Consolidated Statements of Cash Flows
|
| For the Years Ended |
| |||||||||
|
| January 28, |
|
| January 30, |
|
| January 31, |
| |||
(In thousands) |
| 2017 |
|
| 2016 |
|
| 2015 |
| |||
Operating activities: |
|
|
|
|
|
|
|
|
|
|
|
|
Net income |
| $ | 212,449 |
|
| $ | 218,138 |
|
| $ | 80,322 |
|
(Gain) loss from discontinued operations, net of tax |
|
| - |
|
|
| (4,847 | ) |
|
| 8,465 |
|
Income from continuing operations |
| $ | 212,449 |
|
| $ | 213,291 |
|
| $ | 88,787 |
|
Adjustments to reconcile net income to net cash provided by operating activities |
|
|
|
|
|
|
|
|
|
|
|
|
Depreciation and amortization |
|
| 158,174 |
|
|
| 148,858 |
|
|
| 142,351 |
|
Share-based compensation |
|
| 29,137 |
|
|
| 34,977 |
|
|
| 16,070 |
|
Deferred income taxes |
|
| 14,838 |
|
|
| 4,680 |
|
|
| (2,279 | ) |
Foreign currency transaction (gain) loss |
|
| (835 | ) |
|
| 2,977 |
|
|
| (495 | ) |
Loss on impairment of assets |
|
| 20,576 |
|
|
| - |
|
|
| 33,468 |
|
Gain on sale of assets |
|
| - |
|
|
| (9,422 | ) |
|
| - |
|
Changes in assets and liabilities: |
|
|
|
|
|
|
|
|
|
|
|
|
Merchandise inventory |
|
| (53,613 | ) |
|
| (22,259 | ) |
|
| 8,586 |
|
Accounts receivable |
|
| (7,705 | ) |
|
| (10,093 | ) |
|
| 3,084 |
|
Prepaid expenses and other |
|
| (332 | ) |
|
| (7,027 | ) |
|
| 14,282 |
|
Other assets |
|
| (6,705 | ) |
|
| (10,017 | ) |
|
| 6,612 |
|
Accounts payable |
|
| 52,347 |
|
|
| (3,189 | ) |
|
| (5,280 | ) |
Unredeemed gift cards and gift certificates |
|
| 4,465 |
|
|
| 755 |
|
|
| 1,238 |
|
Deferred lease credits |
|
| (5,229 | ) |
|
| (4,099 | ) |
|
| (4,528 | ) |
Accrued compensation and payroll taxes |
|
| (25,809 | ) |
|
| 34,234 |
|
|
| 20,716 |
|
Accrued income and other taxes |
|
| (10,695 | ) |
|
| (17,615 | ) |
|
| 24,826 |
|
Accrued liabilities |
|
| (15,467 | ) |
|
| (14,133 | ) |
|
| (9,012 | ) |
Total adjustments |
|
| 153,147 |
|
|
| 128,627 |
|
|
| 249,639 |
|
Net cash provided by operating activities from continuing operations |
|
| 365,596 |
|
|
| 341,918 |
|
|
| 338,426 |
|
Investing activities: |
|
|
|
|
|
|
|
|
|
|
|
|
Capital expenditures for property and equipment |
|
| (161,494 | ) |
|
| (153,256 | ) |
|
| (245,002 | ) |
Acquisitions and purchase of long-lived assets in business combination |
|
| - |
|
|
| (10,442 | ) |
|
| - |
|
Proceeds from sale of assets |
|
| - |
|
|
| 12,579 |
|
|
| - |
|
Acquisition of intangible assets |
|
| (1,528 | ) |
|
| (2,382 | ) |
|
| (1,264 | ) |
Sale of available-for-sale securities |
|
| - |
|
|
| - |
|
|
| 10,002 |
|
Net cash used for investing activities from continuing operations |
|
| (163,022 | ) |
|
| (153,501 | ) |
|
| (236,264 | ) |
Financing activities: |
|
|
|
|
|
|
|
|
|
|
|
|
Payments on capital leases and other |
|
| (4,375 | ) |
|
| (7,635 | ) |
|
| (7,143 | ) |
Repurchase of common stock as part of publicly announced programs |
|
| - |
|
|
| (227,071 | ) |
|
| - |
|
Repurchase of common stock from employees |
|
| (7,032 | ) |
|
| (5,163 | ) |
|
| (7,464 | ) |
Net proceeds from stock options exercised |
|
| 16,260 |
|
|
| 7,283 |
|
|
| 7,305 |
|
Excess tax benefit from share-based payments |
|
| 763 |
|
|
| 657 |
|
|
| 742 |
|
Cash dividends paid |
|
| (90,680 | ) |
|
| (97,237 | ) |
|
| (97,224 | ) |
Net cash used for financing activities from continuing operations |
|
| (85,064 | ) |
|
| (329,166 | ) |
|
| (103,784 | ) |
Effect of exchange rates on cash |
|
| 1,036 |
|
|
| (3,076 | ) |
|
| (7,578 | ) |
Cash flows of discontinued operations |
|
|
|
|
|
|
|
|
|
|
|
|
Net cash (used for) provided by operating activities |
|
| - |
|
|
| (6,805 | ) |
|
| 963 |
|
Net cash used for investing activities |
|
| - |
|
|
| - |
|
|
| - |
|
Net cash used for financing activities |
|
| - |
|
|
| - |
|
|
| - |
|
Effect of exchange rates on cash |
|
| - |
|
|
| - |
|
|
| - |
|
Net cash (used for) provided by discontinued operations |
|
| - |
|
|
| (6,805 | ) |
|
| 963 |
|
Net increase (decrease) in cash and cash equivalents |
|
| 118,546 |
|
|
| (150,630 | ) |
|
| (8,237 | ) |
Cash and cash equivalents - beginning of period |
| $ | 260,067 |
|
| $ | 410,697 |
|
| $ | 418,933 |
|
Cash and cash equivalents - end of period |
|
| 378,613 |
|
|
| 260,067 |
|
|
| 410,697 |
|
Refer to Notes to Consolidated Financial Statements
38
AMERICAN EAGLE OUTFITTERS, INC.
Notes to Consolidated Financial Statements
For the Year Ended January 28, 2017
1. Business Operations
American Eagle Outfitters, Inc. (the "Company" or "AEO, Inc."), a Delaware corporation, operates under the American Eagle Outfitters ® ("AEO") and Aerie ® by American Eagle Outfitters ® ("Aerie") brands.
Founded in 1977, AEO, Inc. is a leading multi-brand specialty retailer that operates more than 1,000 retail stores in the U.S. and internationally, online at www.ae.com and www.aerie.com and international store locations managed by third-party operators. Through its portfolio of brands, the Company offers high quality, on-trend clothing, accessories and personal care products at affordable prices. The Company's online business, AEO Direct, ships to 81 countries worldwide.
In Fiscal 2015 , AEO Inc. acquired Tailgate Clothing Company ("Tailgate"), which owns and operates Tailgate, a vintage, sports-inspired apparel brand with a college town store concept, and Todd Snyder New York, a premium menswear brand.
Merchandise Mix
The following table sets forth the approximate consolidated percentage of total net revenue from continuing operations attributable to each merchandise group for each of the periods indicated:
|
| For the Years Ended |
| |||||||||
|
| January 28, |
|
| January 30, |
|
| January 31, |
| |||
|
| 2017 |
|
| 2016 |
|
| 2015 |
| |||
Men's apparel and accessories |
|
| 35 | % |
|
| 37 | % |
|
| 39 | % |
Women's apparel and accessories (excluding Aerie) |
|
| 54 | % |
|
| 54 | % |
|
| 53 | % |
Aerie |
|
| 11 | % |
|
| 9 | % |
|
| 8 | % |
Total |
|
| 100 | % |
|
| 100 | % |
|
| 100 | % |
2. Summary of Significant Accounting Policies
Principles of Consolidation
The Consolidated Financial Statements include the accounts of the Company and its wholly-owned subsidiaries. All intercompany transactions and balances have been eliminated in consolidation. At January 28, 2017, the Company operated in one reportable segment.
The Company exited its 77kids brand in 2012. These Consolidated Financial Statements reflect the results of 77kids as discontinued operations for all periods presented.
Fiscal Year
Our fiscal year ends on the Saturday nearest to January 31. As used herein, "Fiscal 2017" refers to the 53-week period ending February 3, 2018. "Fiscal 2016", "Fiscal 2015" and "Fiscal 2014" refer to the 52-week periods ended January 28, 2017, January 30, 2016 and January 31, 2015, respectively.
Estimates
The preparation of financial statements in conformity with accounting principles generally accepted in the United States of America ("GAAP") requires the Company's management to make estimates and assumptions that affect the reported amounts of assets and liabilities and disclosure of contingent assets and liabilities at the date of the financial statements and the reported amounts of revenues and expenses during the reporting period. Actual results could differ from those estimates. On an ongoing basis, our management reviews its estimates based on currently available information. Changes in facts and circumstances may result in revised estimates.
39
Recent Accounting P ronouncements
In May 2014, the Financial Accounting Standard Board ("FASB") issued Accounting Standards Update ("ASU") No. 2014-09, Revenue from Contracts with Customers ("ASU 2014-09"). ASU 2014-09 is a comprehensive new revenue recognition model that expands disclosure requirements and requires a company to recognize revenue to depict the transfer of goods or services to a customer at an amount that reflects the consideration it expects to receive in exchange for those goods or services. Originally, ASU 2014-09 was effective for annual reporting periods beginning after December 15, 2016. In July 2015, the FASB voted to approve amendments deferring the effective date by one year to be effective for annual reporting periods beginning after December 15, 2017. Accordingly, the Company will adopt ASU 2014-09 on February 4, 2018. The Company does not expect a material impact of the adoption of this guidance on the Company's consolidated financial condition, results of operations or cash flows.
In November 2015, the FASB issued ASU No. 2015-17, Balance Sheet Classification of Deferred Taxes ("ASU 2015-17"), which requires entities to present deferred tax assets and deferred tax liabilities as noncurrent in a classified balance sheet. The ASU may be applied prospectively or retrospectively. The Company adopted the ASU on January 30, 2016, applied retrospectively.
In February 2016, the FASB issued ASU No. 2016-02, Leases ("ASU 2016–02") which replaces the existing guidance in ASC 840, Leases . The new standard establishes a right-of-use (ROU) model that requires a lessee to record a ROU asset and a lease liability on the balance sheet for all leases with terms longer than 12 months. Leases will be classified as either finance or operating, with classification affecting the pattern of expense recognition in the income statement. The guidance is effective for fiscal years beginning after December 15, 2018, including interim periods within those fiscal years and requires retrospective application. The Company will adopt in Fiscal 2019 and is currently evaluating the impact of ASU 2016-02 to its Consolidated Financial Statements .
In March 2016, the FASB issued ASU No. 2016-09, Compensation-Stock Compensation ( Topic 718 ) ("ASU 2016-09"). ASU 2016-09 makes several modifications to Topic 718 related to the accounting for forfeitures, employer tax withholding on share-based compensation and the financial statement presentation of excess tax benefits or deficiencies. ASU 2016-09 also clarifies the statement of cash flows presentation for certain components of share-based awards. The standard is effective for interim and annual reporting periods beginnings after December 15, 2016. The Company will adopt in Fiscal 2017 and does not expect a material impact of the adoption of this guidance on the Company's consolidated financial statements.
Foreign Currency Translation
In accordance with Accounting Standards Codification ("ASC") 830, Foreign Currency Matters , assets and liabilities denominated in foreign currencies were translated into United States dollars ("USD") (the reporting currency) at the exchange rates prevailing at the balance sheet date. Revenues and expenses denominated in foreign currencies were translated into USD at the monthly average exchange rates for the period. Gains or losses resulting from foreign currency transactions are included in the results of operations, whereas, related translation adjustments are reported as an element of other comprehensive income in accordance with ASC 220, Comprehensive Income (refer to Note 11 to the Consolidated Financial Statements).
Cash and Cash Equivalents
The Company considers all highly liquid investments purchased with a remaining maturity of three months or less to be cash equivalents.
As of January 28, 2017 and January 30, 2016, the Company held no short-term investments.
Refer to Note 3 to the Consolidated Financial Statements for information regarding cash and cash equivalents and investments.
Merchandise Inventory
Merchandise inventory is valued at the lower of average cost or market, utilizing the retail method. Average cost includes merchandise design and sourcing costs and related expenses. The Company records merchandise receipts at the time which both title and risk of loss for the merchandise transfers to the Company.
40
The Company reviews its inventory levels to identify slow-moving merchandise and generally uses markdowns to clear merchandise. Additionally, the Company estimates a markdown reserve for future planned permanent markdowns related to current inv entory. Markdowns may occur when inventory exceeds customer demand for reasons of style, seasonal adaptation, changes in customer preference, lack of consumer acceptance of fashion items, competition, or if it is determined that the inventory in stock will not sell at its currently ticketed price. Such markdowns may have a material adverse impact on earnings, depending on the extent and amount of inventory affected. The Company also estimates a shrinkage reserve for the period between the last physical coun t and the balance sheet date. The estimate for the shrinkage reserve, based on historical results, can be affected by changes in merchandise mix and changes in actual shrinkage trends.
Property and Equipment
Property and equipment is recorded on the basis of cost with depreciation computed utilizing the straight-line method over the assets' estimated useful lives. The useful lives of our major classes of assets are as follows:
Buildings | 25 years |
Leasehold improvements | Lesser of 10 years or the term of the lease |
Fixtures and equipment | 5 years |
In accordance with ASC 360, Property, Plant, and Equipment , the Company's management evaluates the value of leasehold improvements and store fixtures associated with retail stores, which have been open for a period of time sufficient to reach maturity. The Company evaluates long-lived assets for impairment at the individual store level, which is the lowest level at which individual cash flows can be identified. Impairment losses are recorded on long-lived assets used in operations when events and circumstances indicate that the assets might be impaired and the undiscounted cash flows estimated to be generated by those assets are less than the carrying amounts of the assets. When events such as these occur, the impaired assets are adjusted to their estimated fair value and an impairment loss is recorded separately as a component of operating income under loss on impairment of assets. During Fiscal 2015, the Company recorded no asset impairment charges.
During Fiscal 2016, the Company recorded pre-tax asset impairment charges of $20.5 million that includes $7.2 million for the impairment of all Company owned retail stores in the United Kingdom, Hong Kong and China. This amount is included within impairment and restructuring charges in the Consolidated Statements of Operations. These charges are the result of business performance and exploring an initiative to convert these markets to licensed partnerships. Retail stores in these markets no longer are able to generate sufficient cash flow over the expected remaining lease term to recover the carrying value of the respective stores' assets. Additionally, the Company recorded $10.8 million of impairment charges related to non-store corporate assets that support the United Kingdom, Hong Kong and China Company owned retail store and e-commerce operations and $2.5 million of goodwill impairment for the China and Hong Kong retail operations.
During Fiscal 2014, the Company recorded pre-tax asset impairment charges of $33.5 million that includes $25.1 million for the impairment of 79 retail stores recorded as a loss on impairment of assets in the Consolidated Statements of Operations. Based on the Company's evaluation of current and future projected performance, it was determined that these stores would not be able to generate sufficient cash flow over the expected remaining lease term to recover the carrying value of the respective stores' assets. Additionally, the Company recorded $8.4 million of impairment charges related to corporate assets.
When the Company closes, remodels or relocates a store prior to the end of its lease term, the remaining net book value of the assets related to the store is recorded as a write-off of assets within depreciation and amortization expense.
Refer to Note 7 to the Consolidated Financial Statements for additional information regarding property and equipment and Note 16 for additional information regarding impairment charges.
Goodwill
The Company's goodwill is primarily related to the acquisition of its importing operations, Canadian, Hong Kong and China businesses and the recent acquisition of Tailgate and Todd Snyder. In accordance with ASC 350, Intangibles-Goodwill and Other ("ASC 350"), the Company evaluates goodwill for possible impairment on at least an annual basis and last performed an annual impairment test as of January 28, 2017. During Fiscal 2016, the Company concluded the
41
goodwill was impaired for the Hong Kong and China businesses, resulting in a $2.5 million charge includ ed within impairment and restructuring charges in the Consolidated Statements of Operations as a result of the Company's plans to convert these markets to licensed partnerships. All other goodwill for the Company was not impaired as a result of the annual goodwill impairment test.
Refer to Note 17 to the Consolidated Financial Statements for additional information on the acquisition of Tailgate.
Intangible Assets
Intangible assets are recorded on the basis of cost with amortization computed utilizing the straight-line method over the assets' estimated useful lives. The Company's intangible assets, which primarily include trademark assets, are amortized over 15 to 25 years.
The Company evaluates intangible assets for impairment in accordance with ASC 350 when events or circumstances indicate that the carrying value of the asset may not be recoverable. Such an evaluation includes the estimation of undiscounted future cash flows to be generated by those assets. If the sum of the estimated future undiscounted cash flows are less than the carrying amounts of the assets, then the assets are impaired and are adjusted to their estimated fair value. No intangible asset impairment charges were recorded for all periods presented.
Refer to Note 8 to the Consolidated Financial Statements for additional information regarding intangible assets.
Deferred Lease Credits
Deferred lease credits represent the unamortized portion of construction allowances received from landlords related to the Company's retail stores. Construction allowances are generally comprised of cash amounts received by the Company from its landlords as part of the negotiated lease terms. The Company records a receivable and a deferred lease credit liability at the lease commencement date (date of initial possession of the store). The deferred lease credit is amortized on a straight-line basis as a reduction of rent expense over the term of the original lease (including the pre-opening build-out period). The receivable is reduced as amounts are received from the landlord.
Self-Insurance Liability
The Company is self-insured for certain losses related to employee medical benefits and worker's compensation. Costs for self-insurance claims filed and claims incurred but not reported are accrued based on known claims and historical experience. Management believes that it has adequately reserved for its self-insurance liability, which is capped through the use of stop loss contracts with insurance companies. However, any significant variation of future claims from historical trends could cause actual results to differ from the accrued liability.
Co-branded Credit Card and Customer Loyalty Program
The Company offers a co-branded credit card (the "AEO Visa Card") and a private label credit card (the "AEO Credit Card") under the AEO and Aerie brands. These credit cards are issued by a third-party bank (the "Bank") in accordance with a credit card agreement ("the Agreement"). The Company has no liability to the Bank for bad debt expense, provided that purchases are made in accordance with the Bank's procedures. We receive additional funding from the bank based on the Agreement and card activity. We recognize revenue for the additional funding when the amounts are fixed or determinable and collectability is reasonably assured. This revenue is recorded in other revenue, which is a component of total net revenue in our Consolidated Statements of Operations.
Once a customer is approved to receive the AEO Visa Card or the AEO Credit Card and the card is activated, the customer is eligible to participate in the credit card rewards program. Customers who make purchases at AEO and Aerie earn discounts in the form of savings certificates when certain purchase levels are reached. Also, AEO Visa Card customers who make purchases at other retailers where the card is accepted earn additional discounts. Savings certificates are valid for 90 days from issuance.
Points earned under the credit card rewards program on purchases at AEO and Aerie are accounted for by analogy to ASC 605-25, Revenue Recognition, Multiple Element Arrangements ("ASC 605-25"). The Company believes that points earned under its point and loyalty programs represent deliverables in a multiple element arrangement rather than a rebate or refund of cash. Accordingly, the portion of the sales revenue attributed to the award points is deferred and recognized
42
when the award is redeemed or when the points expire. Additionally, credit card reward points earned on non-AEO or Aerie purchases are accounted for in accordance with ASC 605-25. As the points are earned, a current liability is recorded for the estimated cost of the award through cost of sales.
The Company offers its customers the AEREWARDS ® loyalty program (the "Program"). Under the Program, customers accumulate points based on purchase activity and earn rewards by reaching certain point thresholds during three-month earning periods. Rewards earned during these periods are valid through the stated expiration date, which is approximately one month from the mailing date of the reward. These rewards can be redeemed for a discount on a purchase of merchandise. Rewards not redeemed during the one-month redemption period are forfeited. The Company determined that rewards earned using the Program should be accounted for in accordance with ASC 605-25. Accordingly, the portion of the sales revenue attributed to the award credits is deferred and recognized when the awards are redeemed or expire.
Income Taxes
The Company calculates income taxes in accordance with ASC 740, Income Taxes ("ASC 740"), which requires the use of the asset and liability method. Under this method, deferred tax assets and liabilities are recognized based on the difference between the Consolidated Financial Statement carrying amounts of existing assets and liabilities and their respective tax bases as computed pursuant to ASC 740. Deferred tax assets and liabilities are measured using the tax rates, based on certain judgments regarding enacted tax laws and published guidance, in effect in the years when those temporary differences are expected to reverse. A valuation allowance is established against the deferred tax assets when it is more likely than not that some portion or all of the deferred taxes may not be realized. Changes in the Company's level and composition of earnings, tax laws or the deferred tax valuation allowance, as well as the results of tax audits, may materially impact the Company's effective income tax rate.
The Company evaluates its income tax positions in accordance with ASC 740 which prescribes a comprehensive model for recognizing, measuring, presenting and disclosing in the financial statements tax positions taken or expected to be taken on a tax return, including a decision whether to file or not to file in a particular jurisdiction. Under ASC 740, a tax benefit from an uncertain position may be recognized only if it is "more likely than not" that the position is sustainable based on its technical merits.
The calculation of the deferred tax assets and liabilities, as well as the decision to recognize a tax benefit from an uncertain position and to establish a valuation allowance require management to make estimates and assumptions. The Company believes that its assumptions and estimates are reasonable, although actual results may have a positive or negative material impact on the balances of deferred tax assets and liabilities, valuation allowances or net income.
Revenue Recognition
Revenue is recorded for store sales upon the purchase of merchandise by customers. The Company's e-commerce operation records revenue upon the estimated customer receipt date of the merchandise. Shipping and handling revenues are included in total net revenue. Sales tax collected from customers is excluded from revenue and is included as part of accrued income and other taxes on the Company's Consolidated Balance Sheets.
Revenue is recorded net of estimated and actual sales returns and deductions for coupon redemptions and other promotions. The Company records the impact of adjustments to its sales return reserve quarterly within total net revenue and cost of sales. The sales return reserve reflects an estimate of sales returns based on projected merchandise returns determined through the use of historical average return percentages.
|
| For the Years Ended |
| |||||||||
|
| January 28, |
|
| January 30, |
|
| January 31, |
| |||
(In thousands) |
| 2017 |
|
| 2016 |
|
| 2015 |
| |||
Beginning balance |
| $ | 3,349 |
|
| $ | 3,249 |
|
| $ | 2,205 |
|
Returns |
|
| (97,126 | ) |
|
| (90,719 | ) |
|
| (79,813 | ) |
Provisions |
|
| 97,416 |
|
|
| 90,819 |
|
|
| 80,857 |
|
Ending balance |
| $ | 3,639 |
|
| $ | 3,349 |
|
| $ | 3,249 |
|
Revenue is not recorded on the purchase of gift cards. A current liability is recorded upon purchase, and revenue is recognized when the gift card is redeemed for merchandise. Additionally, the Company recognizes revenue on
43
un redeemed gift cards based on an estimate of the amounts that will not be redeemed ("gift card breakage"), determined through historical redemption trends. Gift card breakage revenue is recognized in proportion to actual gift card redemptions as a component of total net revenue. For further information on the Company's gift card program, refer to the Gift Cards caption below.
The Company recognizes royalty revenue generated from its license or franchise agreements based upon a percentage of merchandise sales by the licensee/franchisee. This revenue is recorded as a component of total net revenue when earned.
Cost of Sales, Including Certain Buying, Occupancy and Warehousing Expenses
Cost of sales consists of merchandise costs, including design, sourcing, importing and inbound freight costs, as well as markdowns, shrinkage and certain promotional costs (collectively "merchandise costs") and buying, occupancy and warehousing costs.
Design costs are related to the Company's Design Center operations and include compensation and employee benefit expenses, including salaries, incentives, travel, supplies and samples for our design teams, as well as rent and depreciation for the Company's Design Center. These costs are included in cost of sales as the respective inventory is sold.
Buying, occupancy and warehousing costs consist of compensation, employee benefit expenses and travel for the Company's buyers and certain senior merchandising executives; rent and utilities related to the Company's stores, corporate headquarters, distribution centers and other office space; freight from the Company's distribution centers to the stores; compensation and supplies for the Company's distribution centers, including purchasing, receiving and inspection costs; and shipping and handling costs related to our e-commerce operation. Gross profit is the difference between total net revenue and cost of sales.
Selling, General and Administrative Expenses
Selling, general and administrative expenses consist of compensation and employee benefit expenses, including salaries, incentives and related benefits associated with the Company's stores and corporate headquarters. Selling, general and administrative expenses also include advertising costs, supplies for our stores and home office, communication costs, travel and entertainment, leasing costs and services purchased. Selling, general and administrative expenses do not include compensation, employee benefit expenses and travel for the Company's design, sourcing and importing teams, the Company's buyers and the Company's distribution centers as these amounts are recorded in cost of sales.
Advertising Costs
Certain advertising costs, including direct mail, in-store photographs and other promotional costs are expensed when the marketing campaign commences. As of January 28, 2017 and January 30, 2016, the Company had prepaid advertising expense of $8.4 million and $6.1 million, respectively. All other advertising costs are expensed as incurred. The Company recognized $124.5 million, $104.1 million and $94.2 million in advertising expense during Fiscal 2016, Fiscal 2015 and Fiscal 2014, respectively.
Store Pre-Opening Costs
Store pre-opening costs consist primarily of rent, advertising, supplies and payroll expenses. These costs are expensed as incurred.
Other Income, Net
Other income, net consists primarily of foreign currency transaction gain/loss, interest income/expense and realized investment gains/losses.
44
Gift Cards
The value of a gift card is recorded as a current liability upon purchase and revenue is recognized when the gift card is redeemed for merchandise. The Company estimates gift card breakage and recognizes revenue in proportion to actual gift card redemptions as a component of total net revenue. The Company determines an estimated gift card breakage rate by continuously evaluating historical redemption data and the time when there is a remote likelihood that a gift card will be redeemed. The Company recorded gift card breakage of $9.1 million, $8.2 million and $7.0 million during Fiscal 2016, Fiscal 2015 and Fiscal 2014, respectively.
Legal Proceedings and Claims
The Company is subject to certain legal proceedings and claims arising out of the conduct of its business. In accordance with ASC 450, Contingencies ("ASC 450"), the Company records a reserve for estimated losses when the loss is probable and the amount can be reasonably estimated. If a range of possible loss exists and no anticipated loss within the range is more likely than any other anticipated loss, the Company records the accrual at the low end of the range, in accordance with ASC 450. As the Company believes that it has provided adequate reserves, it anticipates that the ultimate outcome of any matter currently pending against the Company will not materially affect the consolidated financial position, results of operations or consolidated cash flows of the Company. However, our assessment of any litigation or other legal claims could potentially change in light of the discovery of facts not presently known or determinations by judges, juries, or other finders of fact which are not in accord with management's evaluation of the possible liability or outcome of such litigation or claims.
Supplemental Disclosures of Cash Flow Information
The table below shows supplemental cash flow information for cash amounts paid during the respective periods:
|
| For the Years Ended |
| |||||||||
|
| January 28, |
|
| January 30, |
|
| January 31, |
| |||
(In thousands) |
| 2017 |
|
| 2016 |
|
| 2015 |
| |||
Cash paid during the periods for: |
|
|
|
|
|
|
|
|
|
|
|
|
Income taxes |
| $ | 126,592 |
|
| $ | 116,765 |
|
| $ | 38,501 |
|
Interest |
| $ | 1,155 |
|
| $ | 1,173 |
|
| $ | 638 |
|
Segment Information
In accordance with ASC 280, Segment Reporting ("ASC 280"), the Company has identified two operating segments (American Eagle Outfitters ® Brand and Aerie ® by American Eagle Outfitters ® Brand) that reflect the Company's operational structure as well as the business's internal view of analyzing results and allocating resources. All of the operating segments have met the aggregation criteria and have been aggregated and are presented as one reportable segment, as permitted by ASC 280.
The following tables present summarized geographical information:
|
| For the Years Ended |
| |||||||||
|
| January 28, |
|
| January 30, |
|
| January 31, |
| |||
(In thousands) |
| 2017 |
|
| 2016 |
|
| 2015 |
| |||
Total net revenue: |
|
|
|
|
|
|
|
|
|
|
|
|
United States |
| $ | 3,160,699 |
|
| $ | 3,091,205 |
|
| $ | 2,895,310 |
|
Foreign (1) |
|
| 449,166 |
|
|
| 430,643 |
|
|
| 387,557 |
|
Total net revenue |
| $ | 3,609,865 |
|
| $ | 3,521,848 |
|
| $ | 3,282,867 |
|
(1) | Amounts represent sales from American Eagle Outfitters and Aerie international retail stores, and e-commerce sales that are billed to and/or shipped to foreign countries and international franchise royalty revenue. |
45
|
| January 28, |
|
| January 30, |
| ||
(In thousands) |
| 2017 |
|
| 2016 |
| ||
Long-lived assets, net: |
|
|
|
|
|
|
|
|
United States |
| $ | 693,061 |
|
| $ | 692,252 |
|
Foreign |
|
| 78,996 |
|
|
| 80,352 |
|
Total long-lived assets, net |
| $ | 772,057 |
|
| $ | 772,604 |
|
3. Cash and Cash Equivalents
The following table summarizes the fair market value of our cash and marketable securities, which are recorded on the Consolidated Balance Sheets:
(In thousands) |
| January 28, 2017 |
|
| January 30, 2016 |
| ||
Cash and cash equivalents: |
|
|
|
|
|
|
|
|
Cash |
| $ | 265,332 |
|
| $ | 205,359 |
|
Interest bearing deposits |
|
| 83,281 |
|
|
| 54,708 |
|
Commercial paper |
|
| 30,000 |
|
|
| - |
|
Total cash and cash equivalents |
| $ | 378,613 |
|
| $ | 260,067 |
|
4. Fair Value Measurements
ASC 820, Fair Value Measurement Disclosures ("ASC 820"), defines fair value, establishes a framework for measuring fair value in accordance with GAAP, and expands disclosures about fair value measurements. Fair value is defined under ASC 820 as the exit price associated with the sale of an asset or transfer of a liability in an orderly transaction between market participants at the measurement date.
Financial Instruments
Valuation techniques used to measure fair value under ASC 820 must maximize the use of observable inputs and minimize the use of unobservable inputs. In addition, ASC 820 establishes this three-tier fair value hierarchy, which prioritizes the inputs used in measuring fair value. These tiers include:
• | Level 1 - Quoted prices in active markets for identical assets or liabilities. |
• | Level 2 - Inputs other than Level 1 that are observable, either directly or indirectly, such as quoted prices for similar assets or liabilities; quoted prices in markets that are not active; or other inputs that are observable or can be corroborated by observable market data for substantially the full term of the assets or liabilities. |
• | Level 3 - Unobservable inputs (i.e., projections, estimates, interpretations, etc.) that are supported by little or no market activity and that are significant to the fair value of the assets or liabilities. |
As of January 28, 2017 and January 30, 2016, the Company held certain assets that are required to be measured at fair value on a recurring basis. These include cash equivalents and investments.
46
In accordance with ASC 820, the following tables represent the fair value hierarchy for the Company's financial assets (cash equivalents and investments) measured at fair value on a recurring basis as of January 28, 2017 and January 30, 2016:
| Fair Value Measurements at January 28, 2017 |
| |||||||||||||
(In thousands) | Carrying Amount |
|
| Quoted Market Prices in Active Markets for Identical Assets (Level 1) |
|
| Significant Other Observable Inputs (Level 2) |
|
| Significant Unobservable Inputs (Level 3) |
| ||||
Cash and cash equivalents |
|
|
|
|
|
|
|
|
|
|
|
|
|
|
|
Cash | $ | 265,332 |
|
| $ | 265,332 |
|
|
|
|
|
|
|
|
|
Interest bearing deposits |
| 83,281 |
|
|
| 83,281 |
|
|
| - |
|
|
| - |
|
Commercial paper |
| 30,000 |
|
|
| 30,000 |
|
|
| - |
|
|
| - |
|
Total cash and cash equivalents | $ | 378,613 |
|
|
| 378,613 |
|
|
| - |
|
|
| - |
|
Percent to total |
| 100 | % |
|
| 100 | % |
|
| - |
|
|
| - |
|
| Fair Value Measurements at January 30, 2016 |
| |||||||||||||
(In thousands) | Carrying Amount |
|
| Quoted Market Prices in Active Markets for Identical Assets (Level 1) |
|
| Significant Other Observable Inputs (Level 2) |
|
| Significant Unobservable Inputs (Level 3) |
| ||||
Cash and cash equivalents |
|
|
|
|
|
|
|
|
|
|
|
|
|
|
|
Cash | $ | 205,359 |
|
| $ | 205,359 |
|
| $ | - |
|
| $ | - |
|
Interest bearing deposits |
| 54,708 |
|
|
| 54,708 |
|
|
| - |
|
|
| - |
|
Total cash and cash equivalents | $ | 260,067 |
|
| $ | 260,067 |
|
| $ | - |
|
| $ | - |
|
Percent to total |
| 100.0 | % |
|
| 100.0 | % |
|
| - |
|
|
| - |
|
In the event the Company holds Level 3 investments, a discounted cash flow model is used to value those investments. There were no Level 3 investments at January 28, 2017 or January 30, 2016.
Non-Financial Assets
The Company's non-financial assets, which include goodwill, intangible assets and property and equipment, are not required to be measured at fair value on a recurring basis. However, if certain triggering events occur, or if an annual impairment test is required and the Company is required to evaluate the non-financial instrument for impairment, a resulting asset impairment would require that the non-financial asset be recorded at the estimated fair value. During Fiscal 2016, the Company concluded the goodwill was impaired for the Hong Kong and China businesses, resulting in a $2.5 million charge included within impairment and restructuring charges in the Consolidated Statements of Operations as a result of the performance of those businesses and the Company's exploration of alternatives, including the licensing of these markets to third-party operators. All other goodwill for the Company was not impaired as a result of the annual goodwill impairment test.
Certain long-lived assets were measured at fair value on a nonrecurring basis using Level 3 inputs as defined in ASC 820. During Fiscal 2016 and Fiscal 2014, certain long-lived assets related to the Company's retail stores, goodwill and corporate assets were determined to be unable to recover their respective carrying values and were written down to their fair value, resulting in a loss of $20.5 million and $33.5 million, respectively, which is recorded within impairment and restructuring charges within the Consolidated Statements of Operations. The fair value of the impaired assets after the recorded loss is an immaterial amount.
The fair value of the Company's stores were determined by estimating the amount and timing of net future cash flows and discounting them using a risk-adjusted rate of interest. The Company estimates future cash flows based on its experience and knowledge of the market in which the store is located.
47
5. Earnings per Share
The following is a reconciliation between basic and diluted weighted average shares outstanding:
|
| For the Years Ended |
| |||||||||
|
| January 28, |
|
| January 30, |
|
| January 31, |
| |||
(In thousands, except per share amounts) |
| 2017 |
|
| 2016 |
|
| 2015 |
| |||
Weighted average common shares outstanding: |
|
|
|
|
|
|
|
|
|
|
|
|
Basic number of common shares outstanding |
|
| 181,429 |
|
|
| 194,351 |
|
|
| 194,437 |
|
Dilutive effect of stock options and non-vested restricted stock |
|
| 2,406 |
|
|
| 1,886 |
|
|
| 698 |
|
Dilutive number of common shares outstanding |
|
| 183,835 |
|
|
| 196,237 |
|
|
| 195,135 |
|
Stock option awards to purchase approximately 2.2 million, 13,000 and 2.3 million shares of common stock during the Fiscal 2016, Fiscal 2015 and Fiscal 2014, respectively, were outstanding, but were not included in the computation of weighted average diluted common share amounts as the effect of doing so would have been anti-dilutive.
Additionally, approximately 0.1 million, 0.7 million, and 1.9 million of performance-based restricted stock awards for Fiscal 2016, Fiscal 2015, and Fiscal 2014, respectively, were not included in the computation of weighted average diluted common share amounts because the number of shares ultimately issued is contingent on the Company's performance compared to pre-established performance goals.
Refer to Note 12 to the Consolidated Financial Statements for additional information regarding share-based compensation.
6. Accounts Receivable
Accounts receivable are comprised of the following:
|
| January 28, |
|
| January 30, |
| ||
(In thousands) |
| 2017 |
|
| 2016 |
| ||
Franchise and license receivable |
| $ | 35,983 |
|
| $ | 35,834 |
|
Credit card program receivable |
|
| 11,869 |
|
|
| 15,880 |
|
Merchandise sell-offs and vendor receivables |
|
| 20,089 |
|
|
| 14,121 |
|
Gift card receivable |
|
| 6,567 |
|
|
| 3,629 |
|
Landlord construction allowances |
|
| 2,412 |
|
|
| 4,382 |
|
Other items |
|
| 9,714 |
|
|
| 7,066 |
|
Total |
| $ | 86,634 |
|
| $ | 80,912 |
|
7. Property and Equipment
Property and equipment consists of the following:
|
| January 28, |
|
| January 30, |
| ||
(In thousands) |
| 2017 |
|
| 2016 |
| ||
Land |
| $ | 17,910 |
|
| $ | 17,910 |
|
Buildings |
|
| 204,890 |
|
|
| 204,690 |
|
Leasehold improvements |
|
| 606,522 |
|
|
| 580,758 |
|
Fixtures and equipment |
|
| 1,028,117 |
|
|
| 963,758 |
|
Construction in progress |
|
| 26,858 |
|
|
| 25,266 |
|
Property and equipment, at cost |
| $ | 1,884,297 |
|
| $ | 1,792,382 |
|
Less: Accumulated depreciation |
|
| (1,176,500 | ) |
|
| (1,088,796 | ) |
Property and equipment, net |
| $ | 707,797 |
|
| $ | 703,586 |
|
48
Depreciation expense is summarized as follows:
|
| For the Years Ended |
| |||||||||
|
| January 28, |
|
| January 30, |
|
| January 31, |
| |||
(In thousands) |
| 2017 |
|
| 2016 |
|
| 2015 |
| |||
Depreciation expense |
| $ | 152,644 |
|
| $ | 140,616 |
|
| $ | 132,529 |
|
Additionally, during Fiscal 2016, Fiscal 2015 and Fiscal 2014, the Company recorded $1.5 million, $4.8 million and $6.4 million, respectively, related to asset write-offs within depreciation and amortization expense.
8. Intangible Assets
Intangible assets include costs to acquire and register the Company's trademark assets. During Fiscal 2015, the Company added $5.7 million net intangible assets from the Tailgate acquisition. The following table represents intangible assets as of January 28, 2017 and January 30, 2016:
|
| January 28, |
|
| January 30, |
| ||
(In thousands) |
| 2017 |
|
| 2016 |
| ||
Trademarks, at cost |
| $ | 68,978 |
|
| $ | 67,398 |
|
Less: Accumulated amortization |
|
| (19,605 | ) |
|
| (15,566 | ) |
Intangible assets, net |
| $ | 49,373 |
|
| $ | 51,832 |
|
Amortization expense is summarized as follows:
|
| For the Years Ended |
| |||||||||
|
| January 28, |
|
| January 30, |
|
| January 31, |
| |||
(In thousands) |
| 2017 |
|
| 2016 |
|
| 2015 |
| |||
Amortization expense |
| $ | 4,007 |
|
| $ | 3,483 |
|
| $ | 3,465 |
|
The table below summarizes the estimated future amortization expense for intangible assets existing as of January 28, 2017 for the next five Fiscal Years:
|
| Future |
| |
(In thousands) |
| Amortization |
| |
2017 |
| $ | 3,643 |
|
2018 |
| $ | 3,643 |
|
2019 |
| $ | 3,643 |
|
2020 |
| $ | 2,969 |
|
2021 |
| $ | 2,642 |
|
9. Other Credit Arrangements
In Fiscal 2014, the Company entered into a new Credit Agreement ("Credit Agreement") for a five-year, syndicated, asset-based revolving credit facilities (the "Credit Facilities"). The Credit Agreement provides senior secured revolving credit for loans and letters of credit up to $400 million, subject to customary borrowing base limitations. The Credit Facilities provide increased financial flexibility and take advantage of a favorable credit environment.
All obligations under the Credit Facilities are unconditionally guaranteed by certain subsidiaries. The obligations under the Credit Agreement are secured by a first-priority security interest in certain working capital assets of the borrowers and guarantors, consisting primarily of cash, receivables, inventory and certain other assets, and will be further secured by first-priority mortgages on certain real property.
As of January 28, 2017, the Company was in compliance with the terms of the Credit Agreement and had $5.7 million outstanding in stand-by letters of credit. No loans were outstanding under the Credit Agreement on January 28, 2017.
49
Additionally, the Company has a borrowing agreement wit h one financial institution under which it may borrow an aggregate of $5 million USD for the purposes of trade letter of credit issuances. The availability of any future borrowings under the trade letter of credit facilities is subject to acceptance by th e respective financial institutions.
As of January 28, 2017, the Company had no outstanding trade letters of credit.
10. Leases
The Company leases all store premises, some of its office space and certain information technology and office equipment. The store leases generally have initial terms of 10 years and are classified as operating leases. Most of these store leases provide for base rentals and the payment of a percentage of sales as additional contingent rent when sales exceed specified levels. Additionally, most leases contain construction allowances and/or rent holidays. In recognizing landlord incentives and minimum rent expense, the Company amortizes the items on a straight-line basis over the lease term (including the pre-opening build-out period).
A summary of fixed minimum and contingent rent expense for all operating leases follows:
|
| For the Years Ended |
| |||||||||
|
| January 28, |
|
| January 30, |
|
| January 31, |
| |||
(In thousands) |
| 2017 |
|
| 2016 |
|
| 2015 |
| |||
Store rent: |
|
|
|
|
|
|
|
|
|
|
|
|
Fixed minimum |
| $ | 286,850 |
|
| $ | 282,300 |
|
| $ | 279,640 |
|
Contingent |
|
| 8,519 |
|
|
| 9,035 |
|
|
| 6,733 |
|
Total store rent, excluding common area maintenance charges, real estate taxes and certain other expenses |
| $ | 295,369 |
|
| $ | 291,335 |
|
| $ | 286,373 |
|
Offices, distribution facilities, equipment and other |
|
| 18,172 |
|
|
| 16,063 |
|
|
| 15,449 |
|
Total rent expense |
| $ | 313,541 |
|
| $ | 307,398 |
|
| $ | 301,822 |
|
In addition, the Company is typically responsible under its store, office and distribution center leases for tenant occupancy costs, including maintenance costs, common area charges, real estate taxes and certain other expenses.
The table below summarizes future minimum lease obligations, consisting of fixed minimum rent, under operating leases in effect at January 28, 2017:
(In thousands) |
| Future Minimum |
| |
Fiscal years: |
| Lease Obligations |
| |
2017 |
| $ | 287,822 |
|
2018 |
| $ | 260,847 |
|
2019 |
| $ | 228,085 |
|
2020 |
| $ | 207,029 |
|
2021 |
| $ | 182,219 |
|
Thereafter |
| $ | 489,739 |
|
Total |
| $ | 1,655,742 |
|
50
11. Other Comprehensive Income
The accumulated balances of other comprehensive income included as part of the Consolidated Statements of Stockholders' Equity follow:
|
|
|
|
|
|
|
|
|
| Accumulated |
| |
|
| Before |
|
| Tax |
|
| Other |
| |||
|
| Tax |
|
| Benefit |
|
| Comprehensive |
| |||
(In thousands) |
| Amount |
|
| (Expense) |
|
| Income |
| |||
Balance at February 1, 2014 |
| $ | 12,157 |
|
|
| - |
|
| $ | 12,157 |
|
Foreign currency translation loss (1) |
|
| (22,101 | ) |
|
| - |
|
|
| (22,101 | ) |
Balance at January 31, 2015 |
| $ | (9,944 | ) |
|
| - |
|
| $ | (9,944 | ) |
Foreign currency translation loss (1) |
|
| (14,535 | ) |
|
| - |
|
|
| (14,535 | ) |
Loss on long-term intra-entity foreign currency transactions |
|
| (8,805 | ) |
|
| 3,416 |
|
|
| (5,389 | ) |
Balance at January 30, 2016 |
| $ | (33,284 | ) |
|
| 3,416 |
|
| $ | (29,868 | ) |
Foreign currency translation loss (1) |
|
| (8,380 | ) |
|
| - |
|
|
| (8,380 | ) |
Gain on long-term intra-entity foreign currency transactions |
|
| 2,919 |
|
|
| (1,133 | ) |
|
| 1,786 |
|
Balance at January 28, 2017 |
| $ | (38,745 | ) |
| $ | 2,283 |
|
| $ | (36,462 | ) |
(1) | Foreign currency translation adjustments are not adjusted for income taxes as they relate to permanent investments in our subsidiaries . |
12. Share-Based Payments
The Company accounts for share-based compensation under the provisions of ASC 718, Compensation – Stock Compensation ("ASC 718"), which requires the Company to measure and recognize compensation expense for all share-based payments at fair value. Total share-based compensation expense included in the Consolidated Statements of Operations for Fiscal 2016, Fiscal 2015 and Fiscal 2014 was $29.1 million ($18.5 million, net of tax), $35.0 million ($23.2 million, net of tax) and $16.1 million ($9.9 million, net of tax), respectively.
ASC 718 requires recognition of compensation cost under a non-substantive vesting period approach for awards containing provisions that accelerate or continue vesting upon retirement. Accordingly, for awards with such provisions, the Company recognizes compensation expense over the period from the grant date to the date retirement eligibility is achieved, if that is expected to occur during the nominal vesting period. Additionally, for awards granted to retirement eligible employees, the full compensation cost of an award must be recognized immediately upon grant.
At January 28, 2017, the Company had awards outstanding under two share-based compensation plans, which are described below.
Share-based compensation plans
2014 Stock Award and Incentive Plan
The 2014 Plan was approved by the stockholders on May 29, 2014. The 2014 Plan authorized 11.5 million shares for issuance, in the form of options, stock appreciation rights ("SARS"), restricted stock, restricted stock units, bonus stock and awards, performance awards, dividend equivalents and other stock based awards. The 2014 Plan provides that the maximum number of shares awarded to any individual may not exceed 4.0 million shares per year for options and SARS and no more than 1.5 million shares may be granted with respect to each of restricted shares of stock and restricted stock units plus any unused carryover limit from the previous year. The 2014 Plan allows the Compensation Committee of the Board to determine which employees receive awards and the terms and conditions of the awards that are mandatory under the 2014 Plan. The 2014 Plan provides for grants to directors who are not officers or employees of the Company, which are not to exceed in value $300,000 in any single calendar year ($500,000 in the first year a person becomes a non-employee director). Through January 28, 2017, approximately 4.6 million shares of restricted stock and approximately 2.3 million shares of common stock had been granted under the 2014 Plan to employees and directors. Approximately 50% of the restricted stock awards are performance-based and are earned if the established performance goals are met. The remaining 50% of the restricted stock awards are time-based and 85% vest ratably over three years, 6% cliff vest in one year, 5% cliff vest in two years and 4% cliff vest in three years.
51
2005 Stock Award and Incentive Plan
The 2005 Plan was approved by the stockholders on June 15, 2005. The 2005 Plan authorized 18.4 million shares for issuance. The 2005 Plan was subsequently amended in Fiscal 2009 to increase the shares available for grant to 31.9 million without taking into consideration 9.1 million non-qualified stock options, 2.9 million shares of restricted stock and 0.2 million shares of common stock that had been previously granted under the 2005 plan to employees and directors (without considering cancellations as of January 31, 2009 of awards for 2.9 million shares). The 2005 Plan provides that the maximum number of shares awarded to any individual may not exceed 6.0 million shares per year for options and SAR and no more than 4.0 million shares may be granted with respect to each of restricted shares of stock and restricted stock units plus any unused carryover limit from the previous year. The 2005 Plan allows the Compensation Committee of the Board to determine which employees receive awards and the terms and conditions of the awards that are mandatory under the 2005 Plan. The 2005 Plan provides for grants to directors who are not officers or employees of the Company, which are not to exceed 20,000 shares per year (not to be adjusted for stock splits). Through January 28, 2017, 17.1 million non-qualified stock options, 10.4 million shares of restricted stock and 0.4 million shares of common stock had been granted under the 2005 Plan to employees and directors (without considering cancellations to date of awards for 14.0 million shares). Approximately 95% of the options granted under the 2005 Plan vest over three years, 4% vest over one year and 1% vest over five years. Options were granted for ten and seven year terms. Approximately 62% of the restricted stock awards are performance-based and are earned if the Company meets established performance goals. The remaining 38% of the restricted stock awards are time-based and vest over three years. The 2005 Plan terminated on May 29, 2014 with all rights of the awardees and all unexpired awards continuing in force and operation after the termination.
Stock Option Grants
The Company grants both time-based and performance-based stock options under the 2005 Plan. Time-based stock option awards vest over the requisite service period of the award or to an employee's eligible retirement date, if earlier. Performance-based stock option awards vest over three years and are earned if the Company meets pre-established performance goals during each year.
A summary of the Company's stock option activity under all plans for Fiscal 2016 follows:
|
| For the Year Ended January 28, 2017 |
| |||||||||||||
|
|
|
|
|
| Weighted- Average |
|
| Weighted- Average Remaining Contractual |
|
| Aggregate |
| |||
|
| Options |
|
| Exercise Price |
|
| Term |
|
| Intrinsic Value |
| ||||
|
| (In thousands) |
|
|
|
|
|
| (In years) |
|
| (In thousands) |
| |||
Outstanding - January 30, 2016 |
|
| 1,213 |
|
| $ | 14.83 |
|
|
|
|
|
|
|
|
|
Granted |
|
| 2,211 |
|
| $ | 15.35 |
|
|
|
|
|
|
|
|
|
Exercised (1) |
|
| (1,068 | ) |
| $ | 14.83 |
|
|
|
|
|
|
|
|
|
Cancelled |
|
| (42 | ) |
| $ | 14.50 |
|
|
|
|
|
|
|
|
|
Outstanding - January 28, 2017 |
|
| 2,314 |
|
| $ | 15.33 |
|
|
| 6.1 |
|
|
| 108 |
|
Vested and expected to vest - January 28, 2017 |
|
| 2,133 |
|
| $ | 15.33 |
|
|
| 6.0 |
|
|
| 107 |
|
Exercisable - January 28, 2017 (2) |
|
| 39 |
|
| $ | 12.10 |
|
|
| 0.8 |
|
|
| 99 |
|
(1) | Options exercised during Fiscal 2016 ranged in price from $11.51 to $15.81. |
(2) | Options exercisable represent "in-the-money" vested options based upon the weighted average exercise price of vested options compared to the Company's stock price at January 28, 2017. |
The weighted-average grant date fair value of stock options granted during Fiscal 2016 and Fiscal 2014 was $3.55 and $3.99, respectively. The aggregate intrinsic value of options exercised during Fiscal 2016, Fiscal 2015 and Fiscal 2014 was $3.8 million, $0.4 million and $1.3 million, respectively. Cash received from the exercise of stock options and the actual tax benefit realized from share-based payments was $16.2 million and $0.3 million, respectively, for Fiscal 2016. Cash received from the exercise of stock options and the actual tax benefit realized from share-based payments was $7.3 million and $(0.5) million, respectively, for Fiscal 2015. Cash received from the exercise of stock options and the actual tax benefit realized from share-based payments was $6.2 million and $(0.5 )million, respectively, for Fiscal 2014.
52
The fair value of stock options was estimated at the date of grant using a Black-Scholes option pricing mo del with the following weighted-average assumptions:
|
| For the Years Ended |
| ||||
|
| January 28, |
| January 31, |
| ||
Black-Scholes Option Valuation Assumptions |
| 2017 |
| 2015 |
| ||
Risk-free interest rates (1) |
|
| 1.3% |
|
| 1.5% |
|
Dividend yield |
|
| 3.0% |
|
| 3.1% |
|
Volatility factors of the expected market price of the Company's common stock (2) |
|
| 35.4% |
|
| 41.2% |
|
Weighted-average expected term (3) |
| 4.4 years |
| 4.5 years |
| ||
(1) | Based on the U.S. Treasury yield curve in effect at the time of grant with a term consistent with the expected life of our stock options. |
(2) | Based on a combination of historical volatility of the Company's common stock and implied volatility. |
(3) | Represents the period of time options are expected to be outstanding. The weighted average expected option terms were determined based on historical experience. |
As of January 28, 2017, there was $6.1 million of unrecognized compensation expense related to nonvested stock option awards that is expected to be recognized over a weighted average period of 2.6 years.
Restricted Stock Grants
Time-based restricted stock awards are comprised of time-based restricted stock units. These awards vest over three years.Time-based restricted stock units receive dividend equivalents in the form of additional time-based restricted stock units, which are subject to the same restrictions and forfeiture provisions as the original award.
Performance-based restricted stock awards include performance-based restricted stock units. These awards cliff vest at the end of a three year period based upon the Company's achievement of pre-established goals throughout the term of the award. Performance-based restricted stock units receive dividend equivalents in the form of additional performance-based restricted stock units, which are subject to the same restrictions and forfeiture provisions as the original award.
The grant date fair value of all restricted stock awards is based on the closing market price of the Company's common stock on the date of grant.
A summary of the activity of the Company's restricted stock is presented in the following tables:
|
| Time-Based Restricted Stock Units |
|
| Performance-Based Restricted Stock Units |
| ||||||||||
|
| For the year ended |
|
| For the year ended |
| ||||||||||
|
| January 28, 2017 |
|
| January 28, 2017 |
| ||||||||||
(Shares in thousands) |
| Shares |
|
| Weighted-Average Grant Date Fair Value |
|
| Shares |
|
| Weighted-Average Grant Date Fair Value |
| ||||
Nonvested - January 30, 2016 |
|
| 1,935 |
|
| $ | 15.17 |
|
|
| 2,609 |
|
| $ | 16.02 |
|
Granted |
|
| 1,080 |
|
|
| 16.16 |
|
|
| 1,112 |
|
|
| 15.73 |
|
Vested |
|
| (916 | ) |
|
| 16.06 |
|
|
| (195 | ) |
|
| 14.82 |
|
Cancelled/Forfeited |
|
| (98 | ) |
|
| 13.24 |
|
|
| (701 | ) |
|
| 19.73 |
|
Nonvested - January 28, 2017 |
|
| 2,001 |
|
|
| 15.39 |
|
|
| 2,825 |
|
|
| 15.07 |
|
As of January 28, 2017, there was $20.9 million of unrecognized compensation expense related to nonvested time-based restricted stock unit awards that is expected to be recognized over a weighted average period of 2.0 years. Based on current probable performance, there is $9.2 million of unrecognized compensation expense related to performance-based restricted stock unit awards which will be recognized as achievement of performance goals is probable over a one to three year period.
As of January 28, 2017, the Company had 3.4 million shares available for all equity grants.
53
13. Retirement Plan and Employee Stock Purchase Plan
The Company maintains a profit sharing and 401(k) plan (the "Retirement Plan"). Under the provisions of the Retirement Plan, full-time employees and part-time employees are automatically enrolled to contribute 3% of their salary if they have attained 20½ years of age. In addition, full-time employees need to have completed 60 days of service and part-time employees must complete 1,000 hours worked to be eligible. Individuals can decline enrollment or can contribute up to 50% of their salary to the 401(k) plan on a pretax basis, subject to IRS limitations. After one year of service, the Company will match 100% of the first 3% of pay plus an additional 25% of the next 3% of pay that is contributed to the plan. Contributions to the profit sharing plan, as determined by the Board, are discretionary. The Company recognized $9.8 million, $10.6 million and $10.5 million in expense during Fiscal 2016, Fiscal 2015 and Fiscal 2014, respectively, in connection with the Retirement Plan.
The Employee Stock Purchase Plan is a non-qualified plan that covers all full-time employees and part-time employees who are at least 18 years old and have completed 60 days of service. Contributions are determined by the employee, with the Company matching 15% of the investment up to a maximum investment of $100 per pay period. These contributions are used to purchase shares of Company stock in the open market.
14. Income Taxes
The components of income before income taxes from continuing operations were:
|
| For the Years Ended |
| |||||||||
|
| January 28, |
|
| January 30, |
|
| January 31, |
| |||
(In thousands) |
| 2017 |
|
| 2016 |
|
| 2015 |
| |||
U.S. |
| $ | 315,199 |
|
| $ | 289,697 |
|
| $ | 193,167 |
|
Foreign |
|
| 20,063 |
|
|
| 32,174 |
|
|
| (33,665 | ) |
Total |
| $ | 335,262 |
|
| $ | 321,871 |
|
| $ | 159,502 |
|
The significant components of the Company's deferred tax assets and liabilities were as follows:
|
| January 28, |
|
| January 30, |
| ||
(In thousands) |
| 2017 |
|
| 2016 |
| ||
Deferred tax assets: |
|
|
|
|
|
|
|
|
Rent |
| $ | 27,843 |
|
| $ | 27,281 |
|
Deferred compensation |
|
| 24,042 |
|
|
| 21,187 |
|
Foreign tax credits |
|
| 22,269 |
|
|
| 20,567 |
|
Employee compensation and benefits |
|
| 13,206 |
|
|
| 23,840 |
|
Inventories |
|
| 10,693 |
|
|
| 9,659 |
|
Accruals not currently deductible |
|
| 8,613 |
|
|
| 10,907 |
|
State tax credits |
|
| 6,574 |
|
|
| 6,902 |
|
Net operating loss |
|
| 5,364 |
|
|
| 6,891 |
|
Other |
|
| 9,380 |
|
|
| 12,745 |
|
Gross deferred tax assets |
|
| 127,984 |
|
|
| 139,979 |
|
Valuation allowance |
|
| (7,266 | ) |
|
| (7,720 | ) |
Total deferred tax assets |
| $ | 120,718 |
|
| $ | 132,259 |
|
|
|
|
|
|
|
|
|
|
Deferred tax liabilities: |
|
|
|
|
|
|
|
|
Property and equipment |
| $ | (63,546 | ) |
| $ | (59,386 | ) |
Other |
|
| (7,922 | ) |
|
| (7,946 | ) |
Total deferred tax liabilities |
| $ | (71,468 | ) |
| $ | (67,332 | ) |
|
|
|
|
|
|
|
|
|
Total deferred tax assets, net |
| $ | 49,250 |
|
| $ | 64,927 |
|
The net decrease in deferred tax assets and liabilities was primarily due to a decrease in the deferred tax assets for compensation and benefits in addition to an increase in the deferred tax liability for property and equipment basis differences. Additionally, there was a decrease to the valuation allowance related to state deferred tax assets.
54
As of January 28, 2017, the Company had deferred tax assets related to state and foreign net operating loss carryovers of $1.6 million and $3.8 million, respectively that could be utilized to reduce future years' tax liabilities. A portion of these net operating loss carryovers b egin expiring in the year 2018 and some have an indefinite carryforward period. Management believes it is more likely than not that the foreign net operating loss carryovers will not reduce future years' tax liabilities in certain jurisdictions. As such a valuation allowance of $3.8 million has been recorded on the deferred tax assets related to the cumulative foreign net operating loss carryovers. We also provided for a valuation allowance of approximately $3.5 million related to other foreign deferred tax assets.
The Company has foreign tax credit carryovers in the amount of $22.3 million and $20.6 million as of January 28, 2017 and January 30, 2016, respectively. The foreign tax credit carryovers begin to expire in Fiscal 2020 to the extent not utilized. No valuation allowance has been recorded on the foreign tax credit carryovers as the Company believes it is more likely than not that the foreign tax credits will be utilized prior to expiration.
The Company has state income tax credit carryforwards of $6.6 million (net of federal tax) and $6.9 million (net of federal tax) as of January 28, 2017 and January 30, 2016, respectively. These income tax credits can be utilized to offset future state income taxes and have a carryforward period of 10 to16 years. They will begin to expire in Fiscal 2022.
Significant components of the provision for income taxes from continuing operations were as follows:
|
| For the Years Ended |
| |||||||||
|
| January 28, |
|
| January 30, |
|
| January 31, |
| |||
(In thousands) |
| 2017 |
|
| 2016 |
|
| 2015 |
| |||
Current: |
|
|
|
|
|
|
|
|
|
|
|
|
Federal |
| $ | 93,961 |
|
| $ | 86,122 |
|
| $ | 66,229 |
|
Foreign taxes |
|
| 3,168 |
|
|
| 3,836 |
|
|
| (792 | ) |
State |
|
| 11,137 |
|
|
| 13,032 |
|
|
| 9,447 |
|
Total current |
|
| 108,266 |
|
|
| 102,990 |
|
|
| 74,884 |
|
Deferred: |
|
|
|
|
|
|
|
|
|
|
|
|
Federal |
| $ | 12,057 |
|
| $ | 5,606 |
|
| $ | (1,178 | ) |
Foreign taxes |
|
| (268 | ) |
|
| (1,977 | ) |
|
| (85 | ) |
State |
|
| 2,758 |
|
|
| 1,961 |
|
|
| (2,906 | ) |
Total deferred |
|
| 14,547 |
|
|
| 5,590 |
|
|
| (4,169 | ) |
Provision for income taxes |
| $ | 122,813 |
|
| $ | 108,580 |
|
| $ | 70,715 |
|
U.S. income taxes have not been provided on the undistributed earnings of the Company's foreign subsidiaries, as the Company intends to indefinitely reinvest the undistributed foreign earnings outside of the United States. As of January 28, 2017, the unremitted earnings of the Company's foreign subsidiaries were approximately $40.8 million (USD). Upon distribution of the earnings in the form of dividends or otherwise, the Company would be subject to income and withholding taxes offset by foreign tax credits. Determination of the amount of unrecognized deferred U.S. income tax liability on these unremitted earnings is not practicable because of the complexities associated with this hypothetical calculation.
The following table summarizes the activity related to our unrecognized tax benefits:
|
| For the Years Ended |
| |||||||||
(In thousands) |
| January 28, 2017 |
|
| January 30, 2016 |
|
| January 31, 2015 |
| |||
Unrecognized tax benefits, beginning of the year balance |
| $ | 5,748 |
|
| $ | 12,609 |
|
| $ | 14,601 |
|
Increases in current period tax positions |
|
| 1,884 |
|
|
| 2,727 |
|
|
| 2,166 |
|
Increases in tax positions of prior periods |
|
| 464 |
|
|
| - |
|
|
| - |
|
Settlements |
|
| - |
|
|
| - |
|
|
| (73 | ) |
Lapse of statute of limitations |
|
| (362 | ) |
|
| (516 | ) |
|
| (471 | ) |
Decreases in tax positions of prior periods |
|
| (641 | ) |
|
| (9,072 | ) |
|
| (3,614 | ) |
Unrecognized tax benefits, end of the year balance |
| $ | 7,093 |
|
| $ | 5,748 |
|
| $ | 12,609 |
|
55
As of January 28, 2017, the gross amount of unrecognized tax benefits was $7.1 million, of which $ 5.8 million would affect the effective income tax rate if recognized. The gross amount of unrecognized tax benefits as of Januar y 30, 2016 was $5.7 million, of which $4.6 million would affect the effective income tax rate if recognized.
Unrecognized tax benefits increased by $1.3 million during Fiscal 2016, decreased $6.9 million during Fiscal 2015 and decreased by $2.0 million during Fiscal 2014. Over the next twelve months the Company believes it is reasonably possible the unrecognized tax benefits could decrease by as much as $4.3 million as the result of federal and state tax settlements, statute of limitations lapses, and other changes to the reserves.
The Company records accrued interest and penalties related to unrecognized tax benefits in income tax expense. Accrued interest and penalties related to unrecognized tax benefits included in the Consolidated Balance Sheet were $1.4 million and $1.3 million as of January 28, 2017 and January 30, 2016, respectively. An immaterial amount of interest and penalties were recognized in the provision for income taxes during Fiscal 2016, Fiscal 2015 and Fiscal 2014.
The Company and its subsidiaries file income tax returns in the U.S. federal jurisdiction and various state and foreign jurisdictions. The company participates in the Internal Revenue Service ("IRS") Compliance Assurance Program ("CAP"). As part of the CAP, tax years are audited on a real-time basis so that all or most issues are resolved prior to the filing of the federal tax return. The IRS has completed examinations under CAP through January 30, 2016, for which the majority of the issues have been resolved. The Company does not anticipate that any adjustments will result in a material change to its financial position, results of operations or cash flows. With respect to state and local jurisdictions and countries outside of the United States, with limited exceptions, generally, the Company and its subsidiaries are no longer subject to income tax audits for tax years before 2010. Although the outcome of tax audits is always uncertain, the Company believes that adequate amounts of tax, interest and penalties have been provided for any adjustments that are expected to result from these years.
A reconciliation between the statutory federal income tax rate and the effective income tax rate from continuing operations follows:
|
| For the Years Ended |
| |||||||||
|
| January 28, |
|
| January 30, |
|
| January 31, |
| |||
|
| 2017 |
|
| 2016 |
|
| 2015 |
| |||
Federal income tax rate |
|
| 35.0 | % |
|
| 35.0 | % |
|
| 35.0 | % |
State income taxes, net of federal income tax effect |
|
| 2.8 |
|
|
| 3.1 |
|
|
| 3.7 |
|
Foreign rate differential |
|
| (1.7 | ) |
|
| (1.6 | ) |
|
| 0.3 |
|
Valuation allowance changes, net |
|
| 0.4 |
|
|
| (1.1 | ) |
|
| 6.6 |
|
Change in unrecognized tax benefits |
|
| 0.4 |
|
|
| (1.5 | ) |
|
| (0.6 | ) |
Other |
|
| (0.3 | ) |
|
| (0.2 | ) |
|
| (0.7 | ) |
|
|
| 36.6 | % |
|
| 33.7 | % |
|
| 44.3 | % |
15. Discontinued Operations
In 2012, the Company exited the 77kids business. In connection with the exit of the 77kids business, the Company became secondarily liable for obligations under lease agreements for 21 store leases assumed by the third-party purchaser. In Fiscal 2014, the third-party purchaser did not fulfill its obligations under the leases, resulting in the Company becoming primarily liable. The Company was required to make rental and lease termination payments and received reimbursement from the $11.5 million stand-by letter of credit provided by the third-party purchaser. The cash outflow for the remaining lease termination costs was paid in Fiscal 2015.
In accordance with ASC 460, Guarantees ("ASC 460"), as the Company became primarily liable under the leases upon the third-party purchaser's default, the estimated remaining amounts to terminate the lease agreements were accrued in our Consolidated Financial Statements related to these guarantees.
56
A rollforward of the liabilities recognized in the Consolidated Balance Sheets is as follows. There were no accrued liabilities for discontinued operations as of January 28, 2017 or January 30, 2016.
|
| January 30, |
| |
(In thousands) |
| 2016 |
| |
Accrued liability as of January 31, 2015 |
| $ | 14,636 |
|
Add: Costs incurred |
|
| - |
|
Less: Cash payments |
|
| (6,805 | ) |
Less: Adjustments (1) |
|
| (7,831 | ) |
Accrued liability as of January 30, 2016 |
| $ | - |
|
(1) | Adjustments resulting from favorably settling lease termination obligations during Fiscal 2015. |
The tables below present the significant components of 77kids' results included in Loss from Discontinued Operations on the Consolidated Statements of Operations for the years ended January 28, 2017, January 30, 2016 and January 31, 2015.
|
| For the Years Ended |
| |||||||||
|
| January 28, 2017 |
|
| January 30, 2016 |
|
| January 31, 2015 |
| |||
Total net revenue |
| $ | - |
|
| $ | - |
|
| $ | - |
|
|
|
|
|
|
|
|
|
|
|
|
|
|
Gain (Loss) from discontinued operations, before income taxes |
| $ | - |
|
| $ | 7,831 |
|
| $ | (13,673 | ) |
Income tax benefit |
|
| - |
|
|
| (2,984 | ) |
|
| 5,208 |
|
Gain (Loss) from discontinued operations, net of tax |
| $ | - |
|
| $ | 4,847 |
|
| $ | (8,465 | ) |
|
|
|
|
|
|
|
|
|
|
|
|
|
Gain (Loss) per common share from discontinued operations: |
|
|
|
|
|
|
|
|
|
|
|
|
Basic |
| $ | - |
|
| $ | 0.02 |
|
| $ | (0.04 | ) |
Diluted |
| $ | - |
|
| $ | 0.02 |
|
| $ | (0.04 | ) |
16. Impairment & Restructuring Charges
In Fiscal 2016, impairment and restructuring charges were $21.2 million. This amount consists of $7.2 million for the impairment of all Company owned retail stores in the United Kingdom, Hong Kong and China, as well as $11.5 million of impairment and restructuring charges related to non-store corporate assets that support the international retail stores and e-commerce operations and $2.5 million of goodwill impairment for the China and Hong Kong retail operations. The company is exploring an initiative to convert these markets to license partnerships. Assets for these markets currently have no ability to generate sufficient cash flow to cover their carrying value. The Company expects to incur additional charges in Fiscal 2017 for lease-related items and severance. The timing and magnitude is dependent on a number of factors, including negotiating third-party agreements, adherence to notification requirements and local laws.
During Fiscal 2014, the Company undertook restructuring aimed at strengthening the store portfolio and reducing corporate overhead, including severance and office space consolidation. These changes were aimed at driving efficiencies and aligning investments in areas that help fuel the business. There we no restructuring charges in Fiscal 2015.
57
Costs associated with restructuring activities are recorded when incurred. A summary of costs recognized within Restructuring Charges on the Consolidated Income Statement for Fiscal 2016 and Fiscal 2014 are included in the table as follows.
|
| For the years ended |
| ||||
|
| January 28, |
| January 31, |
| ||
(In thousands) |
| 2017 |
| 2015 |
| ||
Asset impairment charges |
| $ | 20,576 |
| $ | 33,468 |
|
|
|
|
|
|
|
|
|
Office space consolidation charges |
| $ | 295 |
| $ | 8,571 |
|
Severance and related employee costs |
|
| 295 |
|
| 7,816 |
|
Other corporate items |
|
| - |
|
| 1,365 |
|
Total restructuring charges |
|
| 590 |
|
| 17,752 |
|
Total impairment and restructuring charges |
| $ | 21,166 |
| $ | 51,220 |
|
A rollforward of the liabilities recognized in the Consolidated Balance Sheet is as follows:
|
| January 28, |
| |
(In thousands) |
| 2017 |
| |
Accrued liability as of January 30, 2016 |
| $ | 2,441 |
|
Add: Costs incurred, excluding non-cash charges |
|
| 590 |
|
Less: Cash payments and adjustments |
|
| (1,856 | ) |
Accrued liability as of January 28, 2017 |
| $ | 1,175 |
|
17. Quarterly Financial Information - Unaudited
The sum of the quarterly EPS amounts may not equal the full year amount as the computations of the weighted average shares outstanding for each quarter and the full year are calculated independently.
|
| Fiscal 2016 Quarters Ended |
| |||||||||||||
|
| April 30, |
|
| July 30, |
|
| October 29, |
|
| January 28, |
| ||||
(In thousands, except per share amounts) |
| 2016 |
|
| 2016 |
|
| 2016 |
|
| 2017 |
| ||||
Total net revenue |
| $ | 749,416 |
|
| $ | 822,594 |
|
| $ | 940,609 |
|
| $ | 1,097,246 |
|
Gross profit |
| $ | 293,452 |
|
| $ | 307,095 |
|
| $ | 377,816 |
|
| $ | 388,502 |
|
Income from continuing operations |
|
| 40,476 |
|
|
| 41,592 |
|
|
| 75,760 |
|
|
| 54,621 |
|
Gain from discontinued operations, net of tax |
|
| - |
|
|
| - |
|
|
| - |
|
|
| - |
|
Net income |
| $ | 40,476 |
|
| $ | 41,592 |
|
| $ | 75,760 |
|
| $ | 54,621 |
|
|
|
|
|
|
|
|
|
|
|
|
|
|
|
|
|
|
Basic per common share amounts: |
|
|
|
|
|
|
|
|
|
|
|
|
|
|
|
|
Income from continuing operations |
| $ | 0.22 |
|
| $ | 0.23 |
|
| $ | 0.41 |
|
| $ | 0.30 |
|
Loss from discontinued operations, net of tax |
|
| - |
|
|
| - |
|
|
| - |
|
|
| - |
|
Basic net income per common share |
| $ | 0.22 |
|
| $ | 0.23 |
|
| $ | 0.41 |
|
| $ | 0.30 |
|
|
|
|
|
|
|
|
|
|
|
|
|
|
|
|
|
|
Diluted per common share amounts: |
|
|
|
|
|
|
|
|
|
|
|
|
|
|
|
|
Income from continuing operations |
| $ | 0.22 |
|
| $ | 0.23 |
|
|
| 0.41 |
|
| $ | 0.30 |
|
Loss from discontinued operations, net of tax |
|
| - |
|
|
| - |
|
|
| - |
|
|
| - |
|
Diluted net income per common share |
| $ | 0.22 |
|
| $ | 0.23 |
|
| $ | 0.41 |
|
| $ | 0.30 |
|
58
|
| Fiscal 2015 Quarters Ended |
| |||||||||||||
|
| May 2, |
|
| August 1, |
|
| October 31, |
|
| January 30, |
| ||||
(In thousands, except per share amounts) |
| 2015 |
|
| 2015 |
|
| 2015 |
|
| 2016 |
| ||||
Total net revenue |
| $ | 699,520 |
|
| $ | 797,428 |
|
| $ | 919,072 |
|
| $ | 1,105,828 |
|
Gross profit |
| $ | 262,212 |
|
| $ | 285,039 |
|
| $ | 367,532 |
|
| $ | 387,951 |
|
Income from continuing operations |
|
| 29,055 |
|
|
| 33,265 |
|
|
| 69,265 |
|
|
| 81,706 |
|
Loss from discontinued operations, net of tax |
|
| - |
|
|
| - |
|
|
| 4,847 |
|
|
| (8,465 | ) |
Net income |
| $ | 29,055 |
|
| $ | 33,265 |
|
| $ | 74,112 |
|
| $ | 73,241 |
|
|
|
|
|
|
|
|
|
|
|
|
|
|
|
|
|
|
Basic per common share amounts: |
|
|
|
|
|
|
|
|
|
|
|
|
|
|
|
|
Income from continuing operations |
| $ | 0.15 |
|
| $ | 0.17 |
|
| $ | 0.35 |
|
| $ | 0.42 |
|
Loss from discontinued operations, net of tax |
|
| - |
|
|
| - |
|
|
| 0.03 |
|
|
| - |
|
Basic net income per common share |
| $ | 0.15 |
|
| $ | 0.17 |
|
| $ | 0.38 |
|
| $ | 0.42 |
|
|
|
|
|
|
|
|
|
|
|
|
|
|
|
|
|
|
Diluted per common share amounts: |
|
|
|
|
|
|
|
|
|
|
|
|
|
|
|
|
Income from continuing operations |
| $ | 0.15 |
|
| $ | 0.17 |
|
|
| 0.35 |
|
| $ | 0.42 |
|
Loss from discontinued operations, net of tax |
|
| - |
|
|
| - |
|
|
| 0.03 |
|
|
| - |
|
Diluted net income per common share |
| $ | 0.15 |
|
| $ | 0.17 |
|
| $ | 0.38 |
|
| $ | 0.42 |
|
Item 9. Changes in and Disagreements with Accountants on Accounting and Financial Disclosure.
None.
Item 9A. Controls and Procedures.
Disclosure Controls and Procedures
We maintain disclosure controls and procedures that are designed to provide reasonable assurance that information required to be disclosed in our reports under the Securities Exchange Act of 1934, as amended (the "Exchange Act"), is recorded, processed, summarized and reported within the time periods specified in the SEC's rules and forms, and that such information is accumulated and communicated to the management of American Eagle Outfitters, Inc. (the "Management"), including our Principal Executive Officer and our Principal Financial Officer, as appropriate, to allow timely decisions regarding required disclosure. In designing and evaluating the disclosure controls and procedures, Management recognized that any controls and procedures, no matter how well designed and operated, can provide only reasonable assurance of achieving the desired control objectives.
In connection with the preparation of this Annual Report on Form 10-K as of January 28, 2017, an evaluation was performed under the supervision and with the participation of our Management, including the Principal Executive Officer and Principal Financial Officer, of the effectiveness of the design and operation of the Company's disclosure controls and procedures (as defined in Rule 13a-15(e) under the Exchange Act). Based upon that evaluation, our Principal Executive Officer and our Principal Financial Officer have concluded that our disclosure controls and procedures were effective at the reasonable assurance level as of the end of the period covered by this Annual Report on Form 10-K.
Management's Annual Report on Internal Control Over Financial Reporting
Our Management is responsible for establishing and maintaining adequate internal control over financial reporting (as defined in Rule 13a-15(f) under the Exchange Act). Our internal control over financial reporting is designed to provide a reasonable assurance to our Management and our Board regarding the preparation and fair presentation of published financial statements.
All internal control systems, no matter how well designed, have inherent limitations. Therefore, even those systems determined to be effective can provide only reasonable assurance with respect to financial statement preparation and presentation.
Our Management assessed the effectiveness of our internal control over financial reporting as of January 28, 2017. In making this assessment, our Management used the criteria set forth by the Committee of Sponsoring Organizations of the
59
Treadway Commission (COSO) in Internal Control - Integrated Framework (2013). Based on this assessment, our Management concluded that we maintained effective internal control over financial reporting as of January 28, 2017.
Our independent registered public accounting firm that audited the financial statements included in this Annual Report issued an attestation report on our internal control over financial reporting.
Changes in Internal Control Over Financial Reporting
There were no changes in our internal control over financial reporting during the three months ended January 28, 2017 that have materially affected, or are reasonably likely to materially affect, our internal control over financial reporting.
60
Report of Independent Registered Public Accounting Firm
The Board of Directors and Stockholders of American Eagle Outfitters, Inc.
We have audited American Eagle Outfitters, Inc.'s internal control over financial reporting as of January 28, 2017, based on criteria established in Internal Control-Integrated Framework issued by the Committee of Sponsoring Organizations of the Treadway Commission (2013 framework) (the COSO criteria). American Eagle Outfitters, Inc.'s management is responsible for maintaining effective internal control over financial reporting, and for its assessment of the effectiveness of internal control over financial reporting included in the accompanying Management's Annual Report on Internal Control over Financial Reporting. Our responsibility is to express an opinion on the company's internal control over financial reporting based on our audit.
We conducted our audit in accordance with the standards of the Public Company Accounting Oversight Board (United States). Those standards require that we plan and perform the audit to obtain reasonable assurance about whether effective internal control over financial reporting was maintained in all material respects. Our audit included obtaining an understanding of internal control over financial reporting, assessing the risk that a material weakness exists, testing and evaluating the design and operating effectiveness of internal control based on the assessed risk, and performing such other procedures as we considered necessary in the circumstances. We believe that our audit provides a reasonable basis for our opinion.
A company's internal control over financial reporting is a process designed to provide reasonable assurance regarding the reliability of financial reporting and the preparation of financial statements for external purposes in accordance with generally accepted accounting principles. A company's internal control over financial reporting includes those policies and procedures that (1) pertain to the maintenance of records that, in reasonable detail, accurately and fairly reflect the transactions and dispositions of the assets of the company; (2) provide reasonable assurance that transactions are recorded as necessary to permit preparation of financial statements in accordance with generally accepted accounting principles, and that receipts and expenditures of the company are being made only in accordance with authorizations of management and directors of the company; and (3) provide reasonable assurance regarding prevention or timely detection of unauthorized acquisition, use, or disposition of the company's assets that could have a material effect on the financial statements.
Because of its inherent limitations, internal control over financial reporting may not prevent or detect misstatements. Also, projections of any evaluation of effectiveness to future periods are subject to the risk that controls may become inadequate because of changes in conditions, or that the degree of compliance with the policies or procedures may deteriorate.
In our opinion, American Eagle Outfitters, Inc. maintained, in all material respects, effective internal control over financial reporting as of January 28, 2017 based on the COSO criteria.
We also have audited, in accordance with the standards of the Public Company Accounting Oversight Board (United States), the consolidated balance sheets of American Eagle Outfitters, Inc. as of January 28, 2017 and January 30, 2016 and the related consolidated statements of operations, comprehensive income, stockholders' equity and cash flows for each of the three years in the period ended January 28, 2017 of American Eagle Outfitters, Inc. and our report dated March 10, 2017 expressed an unqualified opinion thereon.
/s/ Ernst & Young LLP
Pittsburgh, Pennsylvania
March 10, 2017
61
Item 9B. Other Information.
On March 10, 2017, the Company entered into a form of Indemnification Agreement with each of the current directors, executive officers, and the principal accounting officer of the Company.
The terms of the Indemnification Agreement, subject to certain exceptions, generally provide that the Company will indemnify the indemnitee to the fullest extent permitted by law in connection with any claims, suits or proceedings arising as a result of his or her service as a director or officer of the Company or any subsidiary of the Company, including against third-party claims and proceedings brought by or in right of the Company. Additionally, the Indemnification Agreement provides that the indemnitee is entitled to the advancement of certain expenses, subject to certain exceptions and repayment conditions, incurred in connection with such claims, suits or proceedings.
The foregoing description of the Indemnification Agreement is not complete and is qualified in its entirety by the full text of the form of Indemnification Agreement, which is attached hereto as Exhibit 10.18, and is incorporated herein by reference.
PART III
Item 10. Directors, Executive Officers and Corporate Governance.
The information appearing under the captions "Proposal One: Election of Directors," "Section 16(a) Beneficial Ownership Reporting Compliance," "Corporate Governance Information," and "Board Committees" in our Proxy Statement relating to our 2017 Annual Meeting of Stockholders is incorporated herein by reference. See also Part I, Item 1 under the caption "Executive Officers of the Registrant."
Item 11. Executive Compensation.
The information appearing under the caption "Compensation Discussion and Analysis," "Executive Officer Compensation," "Director Compensation," and "Compensation Committee Interlocks and Insider Participation" in our Proxy Statement relating to our 2017 Annual Meeting of Stockholders is incorporated herein by reference.
Item 12. Security Ownership of Certain Beneficial Owners and Management and Related Stockholder Matters.
The information appearing under the captions "Security Ownership of Principal Stockholders and Management" in our Proxy Statement relating to our 2017 Annual Meeting of Stockholders is incorporated herein by reference.
Item 13. Certain Relationships and Related Transactions, and Director Independence.
The information appearing under the caption "Certain Relationships and Related Transactions" and "Board Committees" in our Proxy Statement relating to our 2017 Annual Meeting of Stockholders is incorporated herein by reference.
Item 14. Principal Accounting Fees and Services.
The information appearing under the caption "Independent Registered Public Accounting Firm Fees and Services" in our Proxy Statement relating to our 2017 Annual Meeting of Stockholders is incorporated herein by reference.
62
PART IV
Item 15. Exhibits and Financial Statement Schedules.
(a) (1) The following consolidated financial statements are included in Item 8:
Consolidated Balance Sheets as of January 28, 2017 and January 30, 2016 |
|
|
|
Consolidated Statements of Operations for the fiscal years ended January 28, 2017, January 30, 2016 and January 31, 2015 |
|
|
|
Consolidated Statements of Comprehensive Income for the fiscal years ended January 28, 2017, January 30, 2016 and January 31, 2015 |
|
|
|
Consolidated Statements of Stockholders' Equity for the fiscal years ended January 28, 2017, January 30, 2016 and January 31, 2015 |
|
|
|
Consolidated Statements of Cash Flows for the fiscal years ended January 28, 2017, January 30, 2016 and January 31, 2015 |
|
|
|
Notes to Consolidated Financial Statements |
|
(a) (2) Financial statement schedules have been omitted because either they are not required or are not applicable or because the information required to be set forth therein is not material.
(a) (3) Exhibits
Exhibit Number |
| Description |
|
|
|
3.1 |
| Amended and Restated Certificate of Incorporation, as amended(1) |
|
|
|
3.2 |
| Amended and Restated Bylaws(2) |
|
|
|
4.1 |
| See Amended and Restated Certificate of Incorporation, as amended, in Exhibit 3.1 hereof |
|
|
|
4.2 |
| See Amended and Restated Bylaws in Exhibit 3.2 hereof |
|
|
|
10.1^ |
| Employee Stock Purchase Plan(3) |
|
|
|
10.2^ |
| Deferred Compensation Plan, as amended(4) |
|
|
|
10.3^ |
| Form of Director Deferred Compensation Agreement(5) |
|
|
|
10.4^ |
| 2005 Stock Award and Incentive Plan, as amended(6) |
|
|
|
10.5^ |
| Form of Change in Control Agreement dated April 21, 2010(7) |
|
|
|
10.6^ |
| Form of RSU Confidentiality, Non-Solicitation, Non-Competition and Intellectual Property Agreement(8) |
|
|
|
10.7^ |
| Employment Agreement between the Registrant and Chad Kessler, dated December 2, 2013 (9) |
|
|
|
10.8^ |
| Employment Agreement between the Registrant and Jennifer Foyle, dated June 25, 2010 (10) |
|
|
|
10.9^ |
| 2014 Stock Award and Incentive Plan (11) |
|
|
|
10.10^ |
| Credit Agreement, dated December 2, 2014, among American Eagle Outfitters Outfitters, Inc. and certain of its subsidiaries as borrowers, each lender from time to time party thereto, and HSBC Bank USA, N.A. as administrative agent for the lenders, and certain other parties and agents (12) |
|
|
|
10.11^ |
| Form of Notice of Grant of Stock Options and Option Agreement (13) |
|
|
|
10.12^ |
| Form of Notice of Grant of Restricted Stock Units and Restricted Stock Units Awards Agreement (14) |
|
|
|
10.13^ |
| Form of Notice of Long Term Incentive Grant of Restricted Stock Units and Long Term Incentive Restricted Stock Units Award Agreement (15) |
|
|
|
63
Exhibit Number |
| Description |
|
|
|
10.14^ |
| Form of Notice and Grant Award Agreement under 2014 Stock Award and Incentive Plan (16) |
|
|
|
10.15^ |
| Employment Agreement between the Registrant and Robert L. Madore, dated September 21, 2016 (17) |
|
|
|
10.16^ |
| Change in Control Agreement, between the Registrant and Robert L. Madore, dated September 23, 2016 (18) |
|
|
|
10.17^ |
| Employment Agreement between the Registrant and Peter Horvath, dated May 4, 2016 (19) |
|
|
|
10.18^* |
| Form of Indemnification Agreement |
|
|
|
21* |
| Subsidiaries |
|
|
|
23* |
| Consent of Independent Registered Public Accounting Firm |
|
|
|
24* |
| Power of Attorney |
|
|
|
31.1* |
| Certification by Jay L. Schottenstein pursuant to Rule 13a-14(a) or Rule 15d-14(a) |
|
|
|
31.2* |
| Certification by Robert L. Madore pursuant to Rule 13a-14(a) or Rule 15d-14(a) |
|
|
|
32.1** |
| Certification of Principal Executive Officer Pursuant to 18 U.S.C. Section 1350, as adopted Pursuant to Section 906 of the Sarbanes-Oxley Act of 2002 |
|
|
|
32.2** |
| Certification of Principal Financial Officer Pursuant to 18 U.S.C. Section 1350, as adopted Pursuant to Section 906 of the Sarbanes-Oxley Act of 2002 |
|
|
|
101* |
| Interactive Data File |
(1) | Previously filed as Exhibit 3.1 to the Form 10-Q dated August 4, 2007, filed September 6, 2007 and incorporated herein by reference. |
(2) | Previously filed as Exhibit 3.1 to the Form 8-K dated November 20, 2007, filed November 26, 2007 and incorporated herein by reference. |
(3) | Previously filed as Exhibit 4(a) to Registration Statement on Form S-8 (file no. 33-33278), filed April 5, 1996 and incorporated herein by reference. |
(4) | Previously filed as Exhibit 10.2 to the Form 8-K dated December 17, 2008, filed December 23, 2008 and incorporated herein by reference. |
(5) | Previously filed as Exhibit 10.1 to the Form 8-K dated December 30, 2005, filed January 5, 2006 and incorporated herein by reference. |
(6) | Previously filed as Appendix A to the Definitive Proxy Statement for the 2009 Annual Meeting of Stockholders held on June 16, 2009, filed May 4, 2009 and incorporated herein by reference. |
(7) | Previously filed as Exhibit 10.1 to the Form 8-K dated April 21, 2010, filed April 26, 2010 and incorporated herein by reference. |
(8) | Previously filed as Exhibit 10.25 to the Form 10-K dated January 29, 2011, filed on March 11, 2011 and incorporated herein by reference. |
(9) | Previously filed as Exhibit 10.23 to the Form 10-K dated February 1, 2014, filed on March 13, 2014 and incorporated herein by reference. |
(10) | Previously filed as Exhibit 10.26 to the Form 10-K dated February 1, 2014, filed on March 13, 2014 and incorporated herein by reference. |
(11) | Previously filed as Appendix A to the Definitive Proxy Statement for the 2014 Annual Meeting of Stockholders held on May 29, 2014, filed April 14, 2014 and incorporated herein by reference. |
(12) | Previously filed as Exhibit 10.1 to the Form 8-K dated December 2, 2014, filed December 4, 2014 and incorporated herein by reference. |
(13) | Previously filed as Exhibit 10.24 to the Form 10-K dated January 28, 2012, filed on March 15, 2012 and incorporated herein by reference. |
(14) | Previously filed as Exhibit 10.25 to the Form 10-K dated January 28, 2012, filed on March 15, 2012 and incorporated herein by reference. |
64
(15) | Previously filed as Exhibit 10.26 to the Form 10-K dated January 28, 2012, filed on March 15, 2012 and incorporated herein by reference. |
(16) | Previously filed as Exhibit 10.1 to the Form 10-Q dated May 2, 2015, filed on May 27, 2015 and incorporated herein by reference. |
(1 7) | Previously filed as Exhibit 10.1 to the Form 8-K dated September 29, 2016, filed on September 29, 2016 and incorporated herein by reference. |
(18) | Previously filed as Exhibit 10.2 to the Form 8-K dated September 29, 2016, filed on September 29, 2016 and incorporated herein by reference. |
(19) | Previously filed as Exhibit 10.1 to the Form 10-Q dated April 30, 2016, filed May 25, 2016 and incorporated herein by reference. |
^ | Management contract or compensatory plan or arrangement. |
* | Filed herewith. |
** | Furnished herewith. |
(b) Exhibits
The exhibits to this report have been filed herewith.
(c) Financial Statement Schedules
None.
65
SIGNATURES
Pursuant to the requirements of Section 13 or 15(d) of the Securities Exchange Act of 1934, the Registrant has duly caused this report to be signed on its behalf by the undersigned, thereunto duly authorized.
| AMERICAN EAGLE OUTFITTERS, INC. | |
|
| |
| By: | /s/ Jay L. Schottenstein |
|
| Jay L. Schottenstein |
|
| Chief Executive Officer |
Dated March 10, 2017
Pursuant to the requirements of the Securities Exchange Act of 1934, this report has been signed by the following persons in the capacities indicated on March 10, 2017.
Signature | Title | |
|
| |
/s/ Jay L. Schottenstein | Chief Executive Officer, Chairman of the Board of Directors and Director (Principal Executive Officer) | |
Jay L. Schottenstein | ||
|
| |
/s/ Robert L. Madore | Executive Vice President, Chief Financial Officer (Principal Financial Officer) | |
Robert L. Madore | ||
|
| |
/s/ Scott M. Hurd | Senior Vice President, Chief Accounting Officer (Principal Accounting Officer) | |
Scott M. Hurd | ||
|
| |
* | Director | |
Michael G. Jesselson | ||
|
| |
* | Director | |
Thomas R. Ketteler | ||
|
| |
* | Director | |
Cary D. McMillan | ||
|
| |
* | Director | |
Janice E. Page | ||
|
| |
* | Director | |
David M. Sable | ||
|
| |
* | Director | |
Noel J. Spiegel | ||
|
| |
|
| |
*By: | /s/ Robert L. Madore |
|
| Robert L. Madore, | |
| Attorney-in-Fact | |
66