UNITED STATES
SECURITIES AND EXCHANGE COMMISSION
Washington, D.C. 20549
_____________________
FORM 10-K
(Mark One) | ||
x | ANNUAL REPORT PURSUANT TO SECTION 13 OR 15(d) OF THE SECURITIES EXCHANGE ACT OF 1934 | |
For the fiscal year ended November 27, 2009 | ||
or | ||
o | TRANSITION REPORT PURSUANT TO SECTION 13 OR 15(d) OF THE SECURITIES EXCHANGE ACT OF 1934 | |
For the transition period from to
Commission file number: 0-15175
ADOBE SYSTEMS INCORPORATED
(Exact name of registrant as specified in its charter)
__________________________
Delaware | 77-0019522 | |
(State or other jurisdiction of | (I.R.S. Employer | |
incorporation or organization) | Identification No.) |
345 Park Avenue, San Jose, California 95110-2704
(Address of principal executive offices and zip code)
(408) 536-6000
(Registrant's telephone number, including area code)
Securities registered pursuant to Section 12(b) of the Act:
Title of Each Class | Name of Each Exchange on Which Registered | |
Common Stock, $0.0001 par value per share | The NASDAQ Stock Market LLC (NASDAQ Global Select Market) |
Securities registered pursuant to Section 12(g) of the Act: None
___________________________
Indicate by checkmark if the registrant is a well-known seasoned issuer, as defined in Rule 405 of the Securities Act. Yes x No o
Indicate by checkmark if the registrant is not required to file reports pursuant to Section 13 or Section 15(d) of the Act. Yes o No x
Indicate by checkmark whether the registrant (1) has filed all reports required to be filed by Section 13 or 15 (d) of the Securities Exchange Act of 1934 during the preceding 12 months (or for such shorter period that the registrant was required to file such reports) and (2) has been subject to such filing requirements for the past 90 days. Yes x No o
Indicate by check mark whether the registrant has submitted electronically and posted on its corporate Website, if any, every Interactive Data File required to be submitted and posted pursuant to Rule 405 of Regulation S-T (§ 232.405 of this chapter) during the preceding 12 months (or for such shorter period that the registrant was required to submit and post such files). Yes x No o
Indicate by checkmark if disclosure of delinquent filers pursuant to Item 405 of Regulation S-K (§ 229.405 of this chapter) is not contained herein, and will not be contained, to the best of registrant's knowledge, in definitive proxy or information statements incorporated by reference in Part III of this Form 10-K or any amendment to this Form 10-K. ¨
Indicate by check mark whether the registrant is a large accelerated filer, an accelerated filer, a non-accelerated filer or a smaller reporting company. See the definitions of "large accelerated filer, "accelerated filer" and "smaller reporting company" in Rule 12b-2 of the Exchange Act.
Large accelerated filer x Accelerated filer o Non-accelerated filer o (Do not check if a smaller reporting company) Smaller reporting company o
Indicate by check mark whether the registrant is a shell company (as defined in Rule 12b-2 of the Act). Yes o No x
The aggregate market value of the registrant's common stock, $0.0001 par value per share, held by non-affiliates of the registrant on May 29, 2009, the last business day of the registrant's most recently completed second fiscal quarter, was $12,843,687,113 (based on the closing sales price of the registrant's common stock on that date). Shares of the registrant's common stock held by each officer and director and each person who owns 5% or more of the outstanding common stock of the registrant have been excluded in that such persons may be deemed to be affiliates. This determination of affiliate status is not necessarily a conclusive determination for other purposes. As of January 15, 2010, 524,119,635 shares of the registrant's common stock, $0.0001 par value per share, were issued and outstanding.
DOCUMENTS INCORPORATED BY REFERENCE
Portions of the Proxy Statement for the 2010 Annual Meeting of Stockholders (the "Proxy Statement"), to be filed within 120 days of the end of the fiscal year ended November 27, 2009, are incorporated by reference in Part III hereof. Except with respect to information specifically incorporated by reference in this Form 10-K, the Proxy Statement is not deemed to be filed as part hereof.
| TABLE OF CONTENTS |
Page No. | ||||
PART I | ||||
Item 1. | Business | 3 | ||
Item 1A. | Risk Factors | 34 | ||
Item 1B. | Unresolved Staff Comments | 45 | ||
Item 2. | Properties | 46 | ||
Item 3. | Legal Proceedings | 47 | ||
Item 4. | Submission of Matters to a Vote of Security Holders | 48 | ||
PART II | ||||
Item 5. | Market for Registrant's Common Equity, Related Stockholder Matters and Issuer Purchases of Equity Securities | 49 | ||
Item 6. | Selected Financial Data | 52 | ||
Item 7. | Management's Discussion and Analysis of Financial Condition and Results of Operations | 53 | ||
Item 7A. | Quantitative and Qualitative Disclosures About Market Risk | 72 | ||
Item 8. | Financial Statements and Supplementary Data | 75 | ||
Item 9. | Changes in and Disagreements With Accountants on Accounting and Financial Disclosure | 124 | ||
Item 9A. | Controls and Procedures | 124 | ||
Item 9B. | Other Information | 124 | ||
PART III | ||||
Item 10. | Directors, Executive Officers and Corporate Governance | 124 | ||
Item 11. | Executive Compensation | 125 | ||
Item 12. | Security Ownership of Certain Beneficial Owners and Management and Related Stockholder Matters | 125 | ||
Item 13. | Certain Relationships and Related Transactions, and Director Independence | 125 | ||
Item 14. | Principal Accounting Fees and Services | 125 | ||
PART IV | ||||
Item 15. | Exhibits, Financial Statement Schedules | 125 | ||
Signatures | 126 | |||
Summary of Trademarks | 128 | |||
Exhibits | 130 | |||
TABLE OF CONTENTS
Forward-Looking Statements
In addition to historical information, this Annual Report on Form 10-K contains forward-looking statements, including statements regarding product plans, future growth and market opportunities which involve risks and uncertainties that could cause actual results to differ materially from these forward-looking statements. Factors that might cause or contribute to such differences include, but are not limited to, those discussed under Item 1A, Risk Factors. You should carefully review the risks described herein and in other documents we file from time to time with the Securities and Exchange Commission ("SEC"), including the Quarterly Reports on Form 10-Q to be filed in 2010. When used in this report, the words "expects," "could," "would," "may," "anticipates," "intends," "plans," "believes," "seeks," "targets," "estimates," "looks for," "looks to" and similar expressions, as well as statements regarding our focus for the future, are generally intended to identify forward-looking statements. You should not place undue reliance on these forward-looking statements which speak only as of the date of this Annual Report on Form 10-K. We undertake no obligation to publicly release any revisions to the forward-looking statements or reflect events or circumstances after the date of this document.
PART I
ITEM 1. BUSINESS
Founded in 1982, Adobe Systems Incorporated is one of the largest and most diversified software companies in the world. We offer a line of creative, business, Web and mobile software and services used by creative professionals, knowledge workers, consumers, original equipment manufacturers ("OEMs"), developers and enterprises for creating, managing, delivering, optimizing and engaging with compelling content and experiences across multiple operating systems, devices and media. We distribute our products through a network of distributors, value-added resellers ("VARs"), systems integrators, independent software vendors ("ISVs") and OEMs, direct to end users and through our own Website at www.adobe.com. We also license our technology to hardware manufacturers, software developers and service providers, and we offer integrated software solutions to businesses of all sizes. We have operations in the Americas, Europe, Middle East and Africa ("EMEA") and Asia. Our software runs on personal computers with Microsoft Windows, Apple Mac OS, Linux, UNIX and various non-PC platforms, depending on the product.
Adobe was originally incorporated in California in October 1983 and was reincorporated in Delaware in May 1997. We maintain executive offices and principal facilities at 345 Park Avenue, San Jose, California 95110-2704. Our telephone number is 408-536-6000. We maintain a Website at www.adobe.com. Investors can obtain copies of our SEC filings from this site free of charge, as well as from the SEC Website at www.sec.gov.
BUSINESS OVERVIEW
For more than 27 years, Adobe software and technologies have helped redefine how people engage with ideas and information-anytime, anywhere and through any medium. The impact of our solutions is evident across many industries and is felt by anyone who creates, views and interacts with information.
Today, through the delivery of powerful design, imaging and publishing software for print, Web, mobile and dynamic media production, and by delivering a technology platform, we help people express, share, manage, optimize and collaborate on their ideas in imaginative and meaningful new ways.
Our strategy is to address the needs of a variety of customers which include creative professionals-graphic designers, Web designers, videographers, photographers and professional publishers; knowledge workers-teams of workers who share and collaborate on high-value information; enterprise users-IT managers, Web analysts, marketing executives, line of business managers and executives; high-end consumers-digital imaging and digital video hobbyists and enthusiasts; application developers and OEMs-mobile device manufacturers, printer manufacturers, Internet service providers and developers.
We execute against this strategy by delivering products that support industry standards and can be deployed across multiple computing environments. We also leverage the broad reach of our ubiquitous client technologies including our Adobe Reader, and our Adobe Flash Platform which enables the development of products and solutions that dramatically improves how businesses and governments engage with their customers, employees and constituents. Our Adobe Flash Platform includes our broadly deployed Adobe Flash Player, and our Adobe AIR software which enables developers to build and deploy rich media and Internet applications to client devices. Together, these client technologies allow users of our products and technologies to ensure reliable, secure and rich application experiences across devices, browsers and operating systems.
3
TABLE OF CONTENTS
PRODUCTS AND SERVICES OVERVIEW
In fiscal 2009, we categorized our products and services into the following businesses: Creative Solutions, Business Productivity Solutions, Platform and Print and Publishing. We further broke our Business Productivity Solutions business into two reported segments: Knowledge Worker and Enterprise. With our acquisition of Omniture, Inc. ("Omniture") in the fourth quarter of fiscal 2009, we created and added a new segment called Omniture for the purpose of reporting Omniture results.
Effective in the first quarter of fiscal 2010, we modified our segment reporting. Our Creative Solutions segment, our Platform segment, our Print and Publishing segment, and our Omniture segment continue to be reported as they were in fiscal 2009. Our Business Productivity Solutions business that is reported in two segments (Knowledge Worker and Enterprise), was modified to reflect a change in how we develop, market and sell our Acrobat Connect Pro product family. Previously, Acrobat Connect Pro results were reported in our Knowledge Worker segment. In fiscal 2010, Acrobat Connect Pro results will be reported as part of our Enterprise segment.
Accordingly, our six fiscal 2010 business segments are as follows: Creative Solutions, Knowledge Worker, Enterprise, Omniture, Platform, and Print and Publishing. This overview, organized by these segments, combines an explanation of our various market opportunities with a summary of our fiscal 2009 results and a discussion of our strategies to address our market opportunities in fiscal 2010 and beyond.
Creative Solutions Segment
Creative Solutions Market Opportunity
Our Creative Solutions segment focuses primarily on the needs of the creative professional customer. Creative professionals include graphic designers, production artists, Web designers and developers, user interface designers, writers, videographers, motion graphic artists, photographers and prepress professionals. They use and rely on Adobe's solutions for professional publishing, Web design and development, professional photography, video production, animation and motion graphic production and printing visually rich information.
Our software tools are used by creative professionals to create much of the printed and on-line information people see and read every day, including newspapers, magazines, Websites, Rich Internet Applications ("RIAs"), catalogs, advertisements, brochures, product documentation, books, memos, reports and banners. Our tools are also used to create and enhance visually rich content, including video, animation and mobile content, that is created by multimedia, film, television, audio and video producers who work in advertising, Web design, music, entertainment, corporate and marketing communications, product design, user interface design, sales training, printing, architecture and fine arts. Knowledge workers, educators, hobbyists and high end consumers are also attracted to our creative products to create and deliver content that is of creative professional quality.
Our offerings in the Creative Solutions market extend to real-time rich media solutions which give business users the control to upload, manage, enhance and publish dynamic rich content with minimal IT support. Our offerings also extend to the delivery of rich media through streaming media and a flexible development environment for creating and delivering innovative, interactive media applications. Our media products and services enable broadcasters, events organizers and marketers to reach the broadest possible audience via our rich Flash Platform.
As technology continues to change and improve, the market dynamics for these creative professionals continue to evolve. Due to the constantly changing ways in which people choose to receive information, creative professionals look to their software tools as a means to make their information impactful and to repurpose content across a variety of media, applications and systems. They desire greater efficiency from the software they use to streamline their publishing and content creation workflows and to effectively manage their assets. They also look for new and innovative ways to deliver their content and information to hand-held devices such as mobile handsets and consumer electronic devices.
Creative professional customers license upgrades and new versions of our Creative Solutions products due to the high degree of innovative new features and significant productivity gained through their use. They also frequently purchase license upgrades and new versions of these products when they buy new computers, or migrate to new or updated operating systems.
In addition, knowledge workers in enterprises, educators and students in schools and universities, and hobbyists at home license our Creative Solutions products. Knowledge workers desire professional-quality products to accomplish tasks such as
4
TABLE OF CONTENTS
creating visually-rich sales presentations, engineering or architectural proposals, real estate flyers and school year books. Educators utilize our solutions to educate future creative professionals, as well as create their course content and online eLearning-based lessons. Hobbyists use our tools to create distinctive online communications and photo albums, community newsletters, Web blogs, animations, videos and Websites for family, friends or community organizations.
With the increasing use of the Web as a means for marketing and advertising, we believe a key driver of our Creative Solutions business will also be the growing amount of Website content created by our customers to deliver impactful and compelling Web-based experiences for their constituents across multiple screens, including PCs, mobile devices, and Internet-connected living room electronics such as televisions ("TVs"). We also believe those who manage Websites will want to utilize Web analytic data and other Web usage metrics to optimize their Websites and content to improve the overall experience of their sites.
Another driver of our Creative Solutions business is the growth in the use of digital devices such as digital cameras, digital video cameras, multimedia-enabled computers, DVD players, scanners, Web-capable image and video-enabled handheld devices, cellular phones, gaming consoles and other non-PC Internet-connected devices. In addition, faster Internet broadband speeds have made the Web a viable platform for the delivery of rich media, especially digital video. In turn, the growth in the use of high definition TVs ("HD TVs") and video is driving the need for HD-enhanced video tools to produce HD content for movies and commercial television, as well as the need to deliver or repurpose this content to be viewed on the Web across PC and non-PC based devices.
As the use of digital photography and digital videography grows, we believe creative professionals and professional photographers throughout the world will continue to require software solutions to edit, enhance and manage their digital photographs and digital videos. Increasingly, we expect these users to desire software solutions which leverage the Web as a platform to deliver the capabilities of some or all of the features they desire in desktop software. In addition, we believe creative professionals and Web developers are increasing their use of digital video streams over the Web to create more compelling Websites. We believe professional videographers are upgrading their systems to support HD video content creation, enhancement and delivery. We also believe hobbyists will use, with more frequency, digital imaging and digital video software and online hosted software services as they purchase more affordable digital cameras and digital video cameras.
Creative Solutions Business Summary
In fiscal 2009, our creative business was adversely affected by the global economic recession and the weak general macro-economic environment. This caused revenue for our Creative Suite 4 ("CS4") family of products to be more than 20 percent weaker than revenue achieved with the prior version for a comparable period of time since release. Despite this economy-driven weakness, we maintained our focus on driving adoption of our creative products during the year-particularly with large media companies and enterprise customers. Our CS4 family of products, which first shipped in fiscal 2008, incorporate Adobe technologies used by creative professionals into six Creative Suite editions and thirteen individual creative products, providing offerings for the various creative disciplines our customers desire. These disciplines include end-user markets such as interactive design for print and Web, as well as rich media and digital video creation. After significant weakness in the first two months of the fiscal year, licensing of CS4 products remained stable through the remainder of the year despite the uncertain global economic conditions in end-user creative professional markets.
During the year, we also maintained our focus on meeting the digital imaging and video software needs of professional photographers, professional videographers, business users and hobbyists. Adobe Photoshop is an essential tool in these customers' workflows and they rely on Adobe's digital imaging and video editing solutions to create and enhance many of the pictures and video we see everyday in print, on television, in movies and on the Web. Despite maintaining strong market share for our professional Photoshop products during the year, revenue decreased significantly on a year-over-year basis due to the macro-economic environment.
In the dynamic media market, which includes users who require new and advanced digital video and animation technologies, we continued to focus on driving adoption of our new digital video-based technologies. We released Adobe Flash Media Server 3.5 ("FMS") in the fourth quarter of fiscal 2009 which provides improved dynamic streaming and HTTP delivery capabilities, performance improvements and enhanced digital rights management capabilities for H.264 video and digital video recorder functionality. The launch of FMS, which is licensed either directly by our customers or licensed through our Flash Video Streaming Service via Content Delivery Network ("CDN") partners such as Akamai and Limelight, helped to maintain the broad adoption of Flash Video ("FLV"), the video file format compatible with Adobe Flash Player as
5
TABLE OF CONTENTS
the preferred format for delivery of digital video via the Web. Because of the broad reach and ubiquity of our Flash client technologies, the growing adoption of our authoring tools and our video delivery capabilities via our Flash Player, it is estimated by the research agency comScore that more than 75% of worldwide video watched online is now in FLV format.
To further the monetization capabilities of video content owners who wish to deliver engaging experiences utilizing their video assets, we also delivered Open Source Media Framework ("OSMF"), a new framework for media player development that can be used to create and deliver custom online media players. OSMF enables developers using Flash technologies to quickly and easily add rich functionality such as advertising, user measurement and tracking, and social network integration into new custom video players that can be branded for individual content owners.
In the professional page layout market, despite the downturn in the economy and the financial pressure facing traditional print media companies, we continued to focus on gaining market share during the year with our Adobe InDesign product. Similarly, in the Web layout and Web development markets, and in the illustration market, while our revenues were adversely affected due to the economy, we focused on maintaining market share leadership with our Adobe Dreamweaver and Adobe Illustrator products.
Our Scene7 business, which provides businesses with an easy-to-use Web-based system to upload, manage, enhance and publish dynamic rich content, achieved year-over-year growth in fiscal 2009 based on accelerated customer adoption of our solution. During the year, we updated the capabilities of our Scene7 hosted cross media platform with new features for e-commerce and multichannel marketing companies to create improved, high-impact customer experiences. New Adobe Scene7 capabilities include more design control and enhanced workflow efficiencies with new features such as mixed media set publishing and viewing capabilities; video authoring and viewing capabilities that synchronize merchandising videos with specific call-to-action links, as well as improved integration with Adobe Creative Suite.
During the fourth quarter of fiscal 2009, we released version 8 of our Adobe Photoshop Elements software which is our digital imaging application targeted for amateur photographers and digital imaging hobbyists. In the same quarter, we released version 8 of Adobe Premiere Elements software which is our video editing software that can be used by hobbyists to enhance and share their digital video memories on DVDs. We also released a software bundle that includes the new versions of Adobe Photoshop Elements and Adobe Premiere Elements to target hobbyists who desire both applications in one affordable package. Despite success with these new hobbyist product releases, overall revenue in the hobbyist category declined year-over-year due to the economy.
Creative Solutions Business Strategy
In fiscal 2010, our Creative Solutions strategy will focus on driving revenue growth and increasing market share of our products through the delivery of comprehensive software solutions that meet the evolving needs of our customers. To help drive this strategy, we will deliver new versions of our Creative Suite family of products during the year with a focus on improved integration between our products, more efficient collaboration and workflow capabilities, and enhanced functionality – particularly in areas related to interactivity and rich media use related to Adobe Flash content creation, mobile and alternative device content creation, and hosted cloud-based services which will augment the capabilities of our desktop products. We will also utilize hardware improvements such as 64-bit computing support and graphics processor unit acceleration to significantly improve the performance of our products.
We believe that, while many of our customers have made the switch to our Creative Suite editions from individual creative products, there still remains a large opportunity to migrate customers from individual products to Creative Suite editions – particularly in emerging markets and other large geographic markets outside the United States where our Creative Suite penetration is lower. We also believe many customers who did not migrate to newer CS4 releases during 2009 due to economic factors could upgrade to new versions of our products in 2010, due to new and enhanced features, improved productivity gains, support for the latest Microsoft and Apple operating systems that are being adopted by our customers, new hardware purchases by our customers which could cause them to update old versions of creative software, and the addition of features in some of our creative products which will provide better integration with our Omniture Web analytics and business optimization products.
To increase the addressable market for our Creative Solutions business, and to address the needs of customers creating interactive content and applications for both PC and non-PC based environments, we intend to add Adobe Flash Catalyst and Adobe Flash Builder to some of our Creative Suite configurations in 2010. We believe interactive designers, Web developers and other creative professionals will benefit from the added features and integration of these Platform Business Unit products with the other creative products they regularly use to provide innovative ways to deliver improved Web-based content, applications and experiences for both PC screens and non-PC screens such as mobile device and TV screens.
6
TABLE OF CONTENTS
We intend to continue our efforts to be the recognized market leader in the professional page layout, Web layout and illustration software markets. In page layout, we will continue to add new features to our InDesign product with a focus on cross-media publishing workflows, as well as continue to enhance its integration with other products print professionals utilize in their workflows. In Web layout, we strive to continue to redefine the Web experience by offering the most feature-rich, market-leading solutions for Website design and development with our Dreamweaver and Flash offerings. In illustration, we will continue to innovate and develop new capabilities which we believe will preserve our Illustrator product as a leading graphics creation solution.
We plan to continue to work on enhancements for our Photoshop family of product offerings to meet the evolving needs of professional photographers, creative professional customers (including graphic designers, Web designers and video producers) and imaging enthusiasts to drive upgrades and new user adoption. We also plan to add new capabilities to Adobe Photoshop Lightroom, our digital photography workflow tool for professional photographers and hobbyists. In addition, we continue to believe many customers will license the Photoshop product capabilities via our Creative Suite editions as opposed to licensing individual Photoshop products.
With our set of professional digital video and motion graphic products, we strive to provide the market-leading, end-to-end digital video, motion graphic and animation platform for our customers. To grow this business, we will continue to market the advanced features, the cross-platform and cross-device capabilities, and the workflow benefits of this platform to creative professionals and videographers in the film, broadcast, corporate and event videography market segments. We are also enhancing our FMS solution to deliver the highest quality video streaming capability and we are working with partners to deliver integrated video systems and video delivery services. With broad adoption of Adobe Flash Player and its high-quality video playback features, we will continue to work on advancing our seamless video authoring-to-playback workflow capability for those wishing to provide a rich video experience on the Web and to mobile devices. We will also work to integrate analytics and optimization capabilities into our video solutions, leveraging our OSMF effort and the capabilities of our Omniture offerings.
To further our initiatives in digital video and motion graphics, we intend to extend our leadership position in Web video by continuing to support and drive the improvement of industry standards, as well as innovate and deliver advanced content creation, protection, delivery and monetization capabilities in our dynamic media streaming products, the Adobe Flash Player, our OSMF effort and our Omniture solutions. By focusing on the end-to-end video workflow needs and monetization goals of our customers, we believe we are uniquely positioned to provide the best solution for the creation and delivery of high-quality Web video content. In addition, as the number of hobbyists desiring easy-to-use video editing solutions grows, we intend to enhance the video editing and DVD creation capabilities of our Adobe Premiere Elements product for the sharing of digital video memories.
With our Scene7 solutions, we intend to market their capabilities to help customers automate the production and availability of rich media experiences, including zoom, dynamic sizing, personalization and interactive dynamic product catalogs. In addition, we believe our Scene7 solutions will help Adobe build a more robust Internet infrastructure for the delivery of software as a service ("SaaS"), allowing us to further develop the brand-name customer list for our Scene7 solutions and accelerate the online availability of Adobe technologies used by millions of creative professional and hobbyist users.
Creative Solutions Products
Adobe After Effects Professional-software used to create sophisticated animation, motion graphics and visual effects found in television broadcast, film, DVD authoring and the Web; provides 2D and 3D compositing, animation and visual effects tools, as well as advanced features such as motion tracking and stabilization, advanced keying and warping tools, more than 30 additional visual effects and additional audio effects.
Adobe Audition-a professional audio editing environment designed for demanding audio and video professionals; provides advanced audio mixing, editing and effects processing capabilities.
Adobe Creative Suite Design Premium-an integrated software solution that creative professionals can use as a platform for print, Web and mobile content publishing; combines Adobe Acrobat Pro, Adobe Dreamweaver, Adobe Flash Professional, Adobe Illustrator, Adobe InDesign and Adobe Photoshop Extended technologies with file management and integration technology called Version Cue, a file management and control center called Adobe Bridge, a tool used to produce innovative and compelling content for a broad range of mobile phones and consumer electronics devices called Adobe Device Central, and Adobe Acrobat Connect Web conferencing software that enables users to instantly communicate and collaborate through easy-to-use, easy-to-access online personal meeting rooms.
7
TABLE OF CONTENTS
Adobe Creative Suite Design Standard-an integrated software solution that creative professionals can utilize for professional design and print production, page layout, image editing, illustration and Adobe PDF workflows; combines Adobe Acrobat Pro, Adobe Illustrator, Adobe InDesign and Adobe Photoshop technologies, Version Cue, Adobe Bridge, Adobe Device Central and Adobe Acrobat Connect Web conferencing software.
Adobe Creative Suite Master Collection-an integrated software solution which provides all the tools creative professionals require to create content for every design discipline in one offering; provides capabilities for professional page layout, image editing, vector illustration, print production, Website design/development, rich interactive content creation, visual effects and motion graphics, video capture/editing/production, DVD titling and digital audio production; includes Adobe Acrobat Pro, Adobe After Effects Professional, Adobe Contribute, Adobe Dreamweaver, Adobe Encore, Adobe Fireworks, Adobe Flash Professional, Adobe Illustrator, Adobe InDesign, Adobe Photoshop Extended, Adobe Premiere Pro and Adobe Soundbooth technologies, Version Cue, Adobe Bridge, Adobe Device Central, Adobe Acrobat Connect and Adobe Dynamic Link which enables intermediate rendering for a smoother workflow between video production tools.
Adobe Creative Suite Production Premium-an integrated software solution that provides creative professionals a complete post-production solution consisting of video, audio and design tools that can be utilized to create and deliver content to film, video, DVD, Blu-ray Disc, the Web and mobile devices; combines Adobe After Effects Professional, Adobe Encore, Adobe Flash Professional, Adobe Illustrator, Adobe Photoshop Extended, Adobe Premiere Pro and Adobe Soundbooth technologies, Version Cue, Adobe Bridge, Adobe Device Central, Adobe Acrobat Connect Web conferencing software and Adobe Dynamic Link.
Adobe Creative Suite Web Premium-an integrated software solution that provides creative professionals a complete solution for creating interactive Websites, applications, user interfaces, presentations, mobile device content and other digital experiences; allows users to prototype Web projects, design Website assets, build Web experiences and efficiently maintain and update Web content; combines Adobe Acrobat Pro, Adobe Contribute, Adobe Dreamweaver, Adobe Fireworks, Adobe Flash Professional, Adobe Illustrator and Adobe Photoshop Extended technologies, Version Cue, Adobe Bridge, Adobe Device Central, Adobe Acrobat Connect Web conferencing software and Adobe Dynamic Link.
Adobe Creative Suite Web Standard-an integrated software solution that provides a basic toolkit for Web designers and developers to prototype, design, develop and maintain Websites, Web applications, interactive Web experiences and mobile content; combines Adobe Contribute, Adobe Dreamweaver, Adobe Fireworks and Adobe Flash Professional technologies, Version Cue, Adobe Bridge, Adobe Device Central and Adobe Acrobat Connect Web conferencing software.
Adobe Dreamweaver-a professional software development application used by designers and developers to create a broad range of Web solutions for publishing online commerce, customer service and online educational content; includes capabilities for visually designing HTML pages, coding HTML and application logic and working with application server technologies.
Adobe Encore-professional DVD authoring and creation software; provides a comprehensive set of design tools and integration with other Adobe software to create a streamlined DVD creation workflow; provides ability to output projects to recordable DVD formats including Blu-ray, ensuring a wide degree of playback compatibility.
Adobe Fireworks-a professional graphics design tool that allows users to rapidly prototype and design Websites and Web application interfaces while giving professional designers and developers tools for creating images that can be deployed to Web browsers, Adobe Flash Player and Adobe AIR; integrates with Adobe Dreamweaver, Adobe Flash and Adobe Photoshop, and supports Adobe AIR application development.
Adobe Flash Access-a scalable, flexible content protection solution that enables the distribution and monetization of premium video content delivered online; previously known as Adobe Flash Media Rights Management Server.
Adobe Flash Media Interactive Server-a configuration of our streaming media capabilities to deliver secure, high-quality video on demand, video blogging and messaging, Web conferencing and live video capabilities that can be viewed via Adobe Flash Player and Adobe AIR; provides a flexible development environment for creating and delivering interactive media applications; utilized by many industries, including media and entertainment, telecommunications, advertising, government and education.
Adobe Flash Media Streaming Server-a lower-cost version of our streaming media capabilities that can be used to deliver live streaming and video-on-demand streaming; configured for lower volume streaming of content that is suitable for small- and medium- size streaming needs.
8
TABLE OF CONTENTS
Adobe Flash Professional-provides an advanced development environment for creating Internet applications which integrate animations, motion graphics, sound, text and additional video functionality; solutions built with Adobe Flash Professional are deployed via the Web to browsers and to devices that run Adobe Flash Player.
Adobe Illustrator-a vector-based illustration design tool used to create compelling graphic artwork for print publications, Websites and video production.
Adobe InCopy-an editorial tool for collaboration between writers, editors and copy-fitters; Adobe InCopy is a companion to Adobe InDesign.
Adobe InDesign-a page-layout application for publishing professionals; based on an open, object-oriented architecture that enables Adobe and its industry partners to deliver powerful publishing solutions for magazine, newspaper and other publishing applications.
Adobe InDesign Server-technology for third-party systems integrators and developers to use for building design-driven, server-based publishing solutions; brings the innovative design and typography features of InDesign software to the server platform and enables Adobe partners to provide new levels of automation and efficiency in high-end editorial workflows, collateral creation, variable data publishing and Web-based design solutions.
Adobe Photoshop-provides photo design, enhancement and editing capabilities for print, the Web and multi-media; used by graphic designers, professional photographers, Web designers, professional publishers and video professionals, as well as amateur photographers and digital imaging hobbyists.
Adobe Photoshop Elements-offers powerful yet easy-to-use photo editing functionality plus intuitive organizing, printing and sharing capabilities for amateur photographers and hobbyists who want to create professional-quality images for print and the Web.
Adobe Photoshop Extended-provides the capabilities of Adobe Photoshop, plus additional tools for editing 3D and motion-based content and performing image analysis; targeted for: film, video and multimedia professionals; graphic and Web designers using 3D and motion; manufacturing professionals; medical professionals; architects and engineers; and scientific researchers.
Adobe Photoshop Lightroom-software designed for professional photographers and photo hobbyists, it addresses their unique photography workflow needs by providing more efficient and powerful ways to import, select, develop and showcase large volumes of digital images.
Adobe Premiere Elements-a powerful yet easy-to-use video-editing software for home video editing; provides tools for hobbyists to quickly edit and enhance video footage with fun effects and transitions and create custom DVDs for sharing video with friends and family.
Adobe Premiere Express-video remix and video editing software licensed to media portals such as MTV.com, Photobucket and YouTube to provide consumers with embedded access to industry leading Adobe video editing and enhancement technologies.
Adobe Premiere Pro-professional digital video-editing software used to create broadcast-quality content for video, film, DVD, multimedia and streaming over the Web.
Adobe Soundbooth-an application that provides video editors, designers and others who do not specialize in audio with the tools that they need to accomplish audio-based tasks in their everyday work, such as removing noise from recordings, polishing voiceovers and customizing music to fit a video or animation production.
Adobe Story-new online collaborative script development tool currently in beta release and made available as a hosted service; can be used to begin the planning and preproduction phase of video workflows and will be integrated with other Adobe products, including future versions of the Adobe Creative Suite product family; developed to create more efficient video production workflows while reducing production costs, Adobe Story automatically turns content in scripts into relevant metadata that can be used throughout the Adobe digital video workflow.
Adobe Visual Communicator-software used to create newscast-style video presentations that can be delivered via e-mail, CD, DVD, PowerPoint or live over the Internet.
Business Catalyst-hosted software service which provides an all-in-one capability to develop, maintain, and run a Website to implement marketing campaigns and sell products online.
9
TABLE OF CONTENTS
Flash Video Streaming Service-via CDN partners, Adobe offers hosted services for streaming on-demand video for the Adobe Flash Player runtime across high-performance networks; built with Adobe Flash Media Server, Flash Video Streaming Service provides an effective way to deliver FLV to large audiences without the overhead of setting up and maintaining streaming server hardware and network.
Open Source Media Framework (OSMF)-new framework for media player development that can be used to create and deliver custom online media players for content owners; enables developers using Flash technologies to quickly and easily add rich functionality such as advertising, user measurement and tracking, and social network integration into new custom video players that can be branded for individual content owners.
Ovation-software which allows users to enhance Microsoft PowerPoint slides into a richer visual experience to help deliver more impactful information, presentations and messages.
Photoshop.com-an online hosted service that provides customers with the ability to view, enhance and share their photos; also provides photo backup services, the ability to obtain seasonal artwork and other inspiring ideas that can be utilized to enhance the photo viewing and sharing experience.
Scene7 On-Demand-provides an easy-to-use, Web-based system to upload, manage, enhance and publish dynamic rich content; used by many leading online retail Websites to automate the production and availability of rich media experiences, including zoom, dynamic sizing, personalization and interactive dynamic product catalogs.
Business Productivity Solutions
The focus of our Business Productivity Solutions business is to provide solutions which meet the needs of enterprises and governments to improve their productivity, help automate business processes, improve collaboration and reduce time-to-market and costs. We believe there are several macro trends and specific growth drivers that are creating opportunities for our Business Productivity Solutions business:
· | Paper-to-digital-eliminating paper and moving to automated forms-based workflows continue to be key challenges in the enterprise. Paper remains prevalent throughout industries and governments, and there are goals to drive down operational costs related to paper use and workflows involving paper-based documents. During the past decade, there has been considerable progress made towards moving away from paper-based workflows. However, we believe there still remains a significant opportunity to deliver solutions which focus on this opportunity. |
· | Collaboration-the nature of business continues to become more social and collaborative, and enterprises and governments are being forced to become more transparent. Customers and government constituents desire that their online interactions be friendly and effective. As such, we believe weaving social, real-time interaction into every customer interaction is becoming a key market opportunity, as well as a differentiation in the marketplace. |
· | Transforming customer interactions-as businesses increasingly move their customer service and new customer acquisition activities online, they are facing a completely different customer interaction model. We believe more than half of the transactions in our Adobe LiveCycle enterprise business during the past year relate to solutions oriented around transforming business processes such that organizations can more easily and cost-effectively acquire, service, and ultimately retain their customers/constituents. |
Given these market trends and growth drivers, we categorize our opportunities and our results into two distinct businesses within our Business Productivity Solutions: Knowledge Worker and Enterprise. Both businesses utilize industry standards and leverage our client platforms that include Adobe Reader, Adobe Flash Player and Adobe AIR.
Knowledge Worker Market Opportunity
As part of our Business Productivity Solutions focus, we address the needs of the knowledge worker customer whom we define as someone working in document intensive industries, focused on creating and disseminating high-value information as part of their job on a regular basis. Knowledge workers include a wide variety of job functions-such as accountants, attorneys, architects, educators, engineers, graphic designers, insurance underwriters and stock analysts. These jobs typically require the sharing of information either as a static, published document or as a collaborative, interactive document.
Knowledge workers must create information and content from a variety of sources and software applications, and be able to exchange this information within a reliable format that ensures coworkers and constituents can reliably and securely access the information. When appropriate, this information often needs to be protected or securely managed and controlled.
10
TABLE OF CONTENTS
Document-based collaboration among knowledge workers can occur through face-to-face meetings, via phone calls, through e-mail or through Web conferencing technologies. Knowledge workers who participate in collaborations with their colleagues may be located in offices next door to each other, or in different parts of the world. These team members may change with every project and either be part of an organization's employee base, or be an external consultant or third-party partner.
We believe there is a significant opportunity to provide solutions which enable knowledge workers to communicate and collaborate across technical, geographical and social boundaries, both inside and outside of their companies. We believe that with such solutions, users can collaborate and efficiently manage feedback from their colleagues in both real time and on-demand, and control how, when and by whom information is accessed.
Since the early 1990s, our Acrobat family of products has provided for the reliable creation and exchange of electronic documents, regardless of platform or application source type. Users can collaborate on documents with electronic comments and tailor the security of a file in order to distribute reliable Adobe PDF documents that can be viewed, printed or interacted with utilizing the free Adobe Reader. Available in different versions which target a variety of user needs, Adobe Acrobat provides essential electronic document capabilities and services to help knowledge workers accomplish a wide range of ad hoc tasks involving digital documents ranging from simple publications to forms to mission critical engineering and architectural plans. Although Acrobat has achieved strong market adoption in document-intensive industries such as government, financial services, pharmaceutical, legal, aerospace, insurance and technical publishing, we believe there are tens of millions of users who need capabilities such as those provided by Acrobat who have not yet licensed an Acrobat- based solution.
Our Acrobat.com service provides centralized online file sharing and storage capabilities, as well as simple PDF creation, an online word processor, spreadsheet and presentation authoring capabilities, and personal Web conferencing services with Adobe ConnectNow that is based on our Acrobat Connect Pro Web conferencing solution. In addition to complementing our Acrobat desktop solutions, Acrobat.com also serves as an introductory service for knowledge workers who wish to utilize PDF-creation capabilities and the Adobe Reader, but have not yet licensed an Acrobat desktop solution.
Knowledge Worker Business Summary
In fiscal 2009, our Knowledge Worker business was adversely affected by the recession and the weak general macro-economic environment. This caused revenue for our Knowledge Worker products to be approximately 23% weaker than revenue achieved in fiscal 2008. Despite this economy-driven weakness, we maintained our focus on driving adoption of our Acrobat products during the year-particularly with enterprise and government customers.
Our Acrobat 9 family of products, which first shipped in August of 2008, offers features that allow workgroups to manage a range of essential business activities such as assembling documents from multiple sources, controlling security and access to sensitive information, enabling the creation and filling out of intelligent electronic forms and more effectively collaborating on documents and projects. In addition, the Acrobat 9 family of products allows users to unify a wide range of content into a PDF Portfolio. Users can assemble documents, drawings, e-mail, spreadsheets and rich media-including audio, video, 3D and maps - in a single, compressed PDF Portfolio. Other version 9 features and enhancements included the ability to: create interactive, on-demand presentations using Adobe Presenter software; easily share video in PDF using FLV; improved security to help protect and control access to PDF documents; permanently remove sensitive information through the use of redaction tools to black out sensitive text, illustrations, or other information; easily create and manage electronic forms; and enable anyone using the free Adobe Reader to digitally sign documents, participate in shared document reviews and save forms locally. These enhanced capabilities helped to continue the increase of our penetration of Acrobat desktop licenses in enterprises.
During the year, continued adoption of our Creative Suite products has also contributed to broader adoption of Acrobat in the creative professional market. Acrobat Pro is included in four of the six Creative Suite editions and utilization of Acrobat prepress, printing and collaboration functionality is a critical component of creative customer workflows. As such, adoption of Acrobat through the Creative Suite family of products has resulted in a material amount of Acrobat revenue being reported in our Creative Solutions Segment during the year.
11
TABLE OF CONTENTS
We also continued to grow the usage of Acrobat.com during fiscal 2009. Since it was first introduced in 2008, more than five million users have created accounts to use Acrobat.com to create and share documents, communicate in real time, and simplify working with others. In the fourth quarter of fiscal 2009, we enhanced its capabilities with easier file sharing, improved remote access including mobile device access, and the addition of new spreadsheet and presentation authoring capabilities. We believe this compelling subscription-based service will enhance the growth capabilities of the Acrobat family of products in the coming years.
Knowledge Worker Strategy
In fiscal 2010, we plan to continue to market the benefits of our knowledge worker solutions to small and medium-sized businesses, large enterprises and government institutions around the world. With our Acrobat family of products, we intend to continue to increase our seat penetration in these markets through the utilization of our corporate and volume licensing programs. We also intend to increase our focus on marketing and licensing Acrobat in targeted vertical markets such as education, financial services, telecommunications and government, as well as expanding into emerging markets.
We also plan to deliver a new version of the Acrobat family of products later in the fiscal year. This new release will provide enhanced collaboration features as well as add additional capabilities to transform how Acrobat users create and deliver more dynamic experiences within PDF files. We believe this new version will help to accelerate adoption of Acrobat in targeted markets when compared to adoption and upgrade rates we experienced during fiscal 2009, which were adversely affected by the macro-economic downturn. In addition, we intend to update the capabilities of our hosted service, Acrobat.com, to increase the value of the service to existing and new users. As the use of Acrobat.com grows, we intend to target users of the free aspects of the service with paid-for functionality that will enhance their use of the overall solution.
Knowledge Worker Products
Adobe Acrobat.com-provides centralized online file sharing and storage capabilities, as well as simple PDF creation, an online word processor called Buzzword, an online spreadsheet authoring tool called Tables, an online presentation creation tool called Presentations, and personal Web conferencing services with Adobe ConnectNow.
Adobe Acrobat Standard-creates secure, reliable and compact Adobe PDF documents from desktop authoring applications such as Microsoft Office software, graphics applications and more; supports automated collaborative workflows with a rich set of commenting tools and review tracking features; includes everything needed to create and distribute rich electronic documents that can be viewed easily within leading Web browsers or on computer desktops via the free Adobe Reader.
Adobe Acrobat Pro-in addition to all the capabilities of Acrobat Standard, Acrobat Pro delivers specialized capabilities for creative professional and engineering users, such as pre-flighting, color separation and measuring tools; also allows users to insert FLV or H.264 video for direct playback in Adobe Acrobat and Adobe Reader, create dynamic XML forms with Adobe LiveCycle Designer ES and create PDF documents that enable Adobe Reader users to digitally sign PDF documents.
Adobe Acrobat Pro Extended-in addition to all the capabilities of Acrobat Pro, Acrobat Pro Extended enables collaboration between extended teams of designers and engineers to more securely and reliably communicate, visualize and document architectural and manufacturing designs using 3D data; allows users to insert and publish 3D designs from major CAD applications in Adobe PDF documents that can easily be shared with suppliers, partners and customers using the free Adobe Reader software; Acrobat Pro Extended also: allows users to easily add audio, video and quizzes to PowerPoint slides to create rich, interactive presentations with Adobe Presenter; enables conversion of a variety of video formats to FLV for playback in PDF; and enables the creation of PDF maps through the importing geospatial files that can retain metadata and coordinates. Acrobat 9 Pro Extended includes Adobe LiveCycle Designer ES, Adobe Presenter, Adobe 3D Reviewer and Adobe 3D Capture Utility for UNIX.
Adobe Document Center-a hosted service that enables businesses to secure and manage Adobe PDF documents and other common business document files such as those in Microsoft Office formats.
Create Adobe PDF Online-a Web-based subscription service that provides for the easy conversion of Microsoft Office documents and other application files to Adobe PDF for the secure and reliable sharing of rich electronic documents that can be viewed easily within leading Web browsers or on computer desktops via the free Adobe Reader.
12
TABLE OF CONTENTS
Enterprise Market Opportunity
Enterprises are under increasing pressure to save money, offer improved customer service, adhere to regulatory requirements and leverage existing investments in core systems. As a means to address these issues, a critical component of an organization's business processes is the need to interact with data stored in enterprise applications. As this need expands beyond the core users of those applications, adapting systems to accommodate a diverse group of users-including those within and those external to the organization – has become an expensive and time-consuming endeavor. The outcome is a proliferation of manual workarounds that result in process inefficiencies, delays and poor quality of information.
In addition, enterprises have built Web applications which enjoy the reach of the Web but often fail to deliver a user interface with the ease of use and richness that users expect. This impedes utilization of these applications and increases training costs, and reduces the overall return on investment ("ROI") that enterprises expect. Organizations are now looking to RIAs to boost their ROI for these Web applications by combining a rich graphical application interface with the universal reach of the Web.
We believe significant opportunities exist to help enterprises address these issues by making their business processes more efficient and their Web applications more engaging. We also believe forward-thinking enterprises are actively investing in disruptive processes to engage more meaningfully with customers, and the employees and partners who serve them. Enterprises want to leverage these dynamic human interactions to create a more effective customer interaction model which accelerates acquisition and retention.
To address these opportunities, we offer a platform for enterprises and governments to build Customer Interaction Solutions ("CIS") utilizing our Adobe LiveCycle Enterprise Suite ("ES") solutions to securely extend the reach of information, processes and services to engage with customers and constituents. Our CIS solutions leverage our Adobe Reader and the Adobe Flash Platform which help businesses and government agencies inspire commitment in their customers and constituents by engaging them - anywhere, anytime and in any medium through our universal clients and application solutions.
Our Adobe Flash Platform enables reliable, secure and rich application experiences across browsers, desktops and devices. The platform provides developers with an RIA programming model to integrate and optimize workflows and a server software framework to simplify integration and leverage existing enterprise infrastructures. We also offer CIS services and other software components to accelerate the creation of compelling, relevant and actionable applications, either through RIAs or through intelligent electronic documents based on Adobe PDF.
To improve their collaboration and communication capabilities, we believe enterprises will increasingly utilize real-time communication to improve how they train, market, sell and support their products and solutions to their customers. For this reason, we now include our Adobe Acrobat Connect Pro product line as part of our CIS offerings. Connect Pro provides capabilities via Adobe Flash Player for live Web conferencing, as well as delivering on-demand rich presentations through an on-premise server or as a hosted service. By also offering Web conferencing services as part of our LiveCycle family of products, we believe we can extend adoption of Web conferencing to a broader potential market and grow the use of such technology with an easy-to-adopt business model.
Although our solutions address the needs of a diverse set of enterprise customers, we focus primarily on two key vertical industries: financial services and government. To a lesser extent, we also target vertical markets such as media and entertainment, manufacturing, telecommunications and healthcare. For all these customers, we offer comprehensive, scalable, secure and reliable server products and tools to develop applications tailored to their specific information and business process requirements.
Enterprise Business Summary
In fiscal 2009, revenue performance for our Enterprise products was better than Adobe's overall business. Despite the negative macro-economic backdrop, overall LiveCycle revenue declined only slightly on a year-over-year basis. A contributing factor to the year-over-year decline in our LiveCycle revenue was our strategic decision to focus less on consulting services as a component of overall LiveCycle revenue during the year. With increased consulting support by systems integrators such as Cognizant, Deloitte and Tata Consulting, we downsized our consulting organization and the revenue aspirations associated with it as we entered fiscal 2009-and focused our revenue generation primarily on the licensing of our LiveCycle solutions.
13
TABLE OF CONTENTS
The overall performance of our enterprise business benefitted from the release of new versions of products during the year. In the fourth quarter of fiscal 2009, we delivered Adobe LiveCycle Enterprise Suite 2 ("ES2"), which enables businesses and governments to deliver personalized experiences to improve employee productivity and the overall experience of their customers and constituents.
LiveCycle ES2 is an integrated J2EE server solution that blends data capture, process management, information security, document generation and content services to help create and deliver rich and engaging applications that reduce paperwork, accelerate decision-making and help ensure regulatory compliance. It provides developers the ability to build applications that improve interactions with customers and constituents across devices and channels. Delivering significant productivity improvements to IT and line-of-business managers, LiveCycle ES2 also provides an RIA framework for building customizable RIA workspaces, mobile and desktop access to critical applications, and deployment as hosted services.
New features and enhancements to LiveCycle ES2 include expanded client and Web browser support. We believe the extended mobile and desktop access to LiveCycle ES2 will help organizations save time and costs by providing seamless end-user access to processes and services that help them complete their work faster. As part of LiveCycle ES2, we offer new capabilities such as LiveCycle Workspace ES2 Mobile-which enables access to LiveCycle ES2 from smartphones including iPhone, Blackberry and Windows mobile devices, thereby increasing user productivity by allowing access to tasks when users are away from their desks. We also offer LiveCycle Launchpad ES2, which is an Adobe AIR application that provides easy access on the desktop to initiate LiveCycle ES services such as PDF creation.
Additional LiveCycle ES2 capabilities included expanded RIA data services. Through closer integration with the Adobe Flash Platform, LiveCycle ES2 enables Adobe Flex and LiveCycle developers to create user-centric applications that are unique to particular business needs. The new LiveCycle Mosaic ES2 capability is an RIA framework for rapidly assembling and engaging activity-centric enterprise applications, and provides knowledge workers with real-time, contextual information from multiple sources in a single, personalized view. Developers can extend existing applications by exposing their business logic and user interfaces into application tiles that can be assembled to create unified views.
In addition, we provide LiveCycle Collaboration Service, which is a new hosted service that provides developers and enterprises with a scalable solution to easily build real-time, multi-user collaboration into existing or new RIAs. LiveCycle ES2 also provides the option to deploy LiveCycle capabilities in the cloud, hosted in the Amazon Web Services cloud computing environment. We believe these capabilities provide organizations with a faster deployment path and lower total cost of ownership. It also allows developers to stage multiple applications before going live in production.
To make it easy for enterprise designers and developers to automate enterprise business processes, we provide tight integration of Adobe tools and solutions such as LiveCycle ES2 Solution Accelerators-which help organizations launch project planning and prototyping, and decrease development time. New LiveCycle ES2 Solution Accelerators include human capital management, eSubmissions, correspondence management, new account enrollment and services and benefits delivery. We also provide LiveCycle Workbench ES2, which is an integrated development environment ("IDE") that allows developers, designers, and business analysts to work together collaboratively.
These LiveCycle ES2 capabilities build upon advancements we have made with LiveCycle ES that provided common services software for functionality such as forms automation, PDF document creation, document security and process management.
In fiscal 2009, we also increased our focus on the Web conferencing market opportunity with our Acrobat Connect Pro product line, which is licensed by customers as on-premise server-based software or as a hosted service. Revenue grew by more than 20% in fiscal 2009 due to our increased focus on marketing and licensing the product, as well as overall growth in the market opportunity.
14
TABLE OF CONTENTS
Enterprise Strategy
In fiscal 2010, we will continue to focus on offering more complete enterprise server-based solutions targeting the needs of governments and enterprises worldwide. We wish to help these customers develop and deliver self-service and assisted-service Web-based applications that blend rich user interfaces and documents with data capture, document collaboration, process management and document generation capabilities that are easy to use. We strive to provide solutions which are customer-centric and help the constituents of our customers work together on complex processes and bridge the digital and paper-based environments, and do so by providing capabilities that are accessible by anyone. We intend to provide such solutions directly through our field organization, as well as together with global and regional systems integrators we partner with that deliver comprehensive solutions to their customers.
We will continue to focus our go-to-market efforts on vertical markets such as financial services and government. We intend to continue to build out our go-to-market model to leverage sales and consulting delivery through systems integrator partners. We will also work to enhance our solutions offerings through investments in new SaaS, or on-demand, capabilities for our enterprise server product family.
With our Connect Pro product, we intend to increase awareness of our solution in markets such as government and other regulated industries. We also intend to expand our go-to-market opportunity by working with Conferencing Service Providers, and we plan to deliver capabilities which allow developers to build collaboration-enabled business processes utilizing Connect Pro functionality and services.
Enterprise Products
Collaboration
Adobe Acrobat Connect Pro-a rich Web-based communication system which enables organizations to reduce the costs of travel and increase the effectiveness of online training, marketing events, sales meetings and collaborative Web conferencing solutions which are instantly accessible by customers, partners and employees using Adobe Flash Player; consists of a core Connect Events Server or hosted service, and modules that provide specific application functionality, including Connect Training and Connect Events; can be deployed with either some or all of these components together; Connect Training allows organizations to build a complete online training system with Microsoft PowerPoint presentations that include surveys, analysis, course administration and content management; Connect Events allows users to provide seminar and training sessions as well as to conduct business presentations through the Web.
Data Capture
Adobe LiveCycle Barcoded Forms ES2-server-based software application which enables organizations to accurately capture user-supplied information from fill-and-print paper forms that uses proven and dynamic 2D barcode technology online and offline to automate the extraction of data from paper forms and deliver it to core systems for processing; dramatically reduces costs, errors and time compared to manual data entry and solutions based on optical character recognition; barcodes are initially set up through creation of the form with Adobe's Designer application; after the form is printed, signed and returned by users of the form, the barcode on the form is scanned and decoded, and form data obtained from the barcode is routed to the appropriate enterprise application through Adobe's LiveCycle server products.
Adobe LiveCycle Data Services ES2-high-performance, scalable and flexible framework that streamlines the development of RIAs using Adobe Flex and Adobe AIR; abstracts the complexity required to create server push–based applications and supports a rich set of features to create real-time solutions; utilizes powerful data services and simplifies data management problems such as tracking changes, synchronization, paging and conflict resolution; deployed as a standard J2EE Web application, which enables customers to leverage their existing infrastructure.
Adobe LiveCycle Forms ES2-server-based software application that organizations can use to cost-effectively and securely extend their core business processes beyond their enterprise system; enables customers to create and deploy XML-based form templates as PDF, SWF, or HTML for use with Adobe Reader or Adobe Flash Player software, or with Web browsers; provides for the capture of data from submitted forms and the transfer of the data directly into an organization's core business systems, thereby streamlining form-driven business processes and improving data accuracy.
Adobe LiveCycle Reader Extensions ES2-server-based software application which lets enterprises easily share interactive Adobe PDF documents with external parties without requiring recipients of the documents to purchase Acrobat software that normally would be necessary to interact with the Adobe PDF documents they receive; unlocks features on an individual Adobe PDF document by document basis so that when such a file is opened in the free Adobe Reader, users have
15
TABLE OF CONTENTS
access to tools that normally would not be available in Adobe Reader, such as reviewing and commenting functions, digital signatures to electronically sign PDF documents, embedding file attachments, enabling database and Web service capabilities, and the ability to fill in form data, submit and save electronic documents locally.
Information Assurance
Adobe LiveCycle Digital Signatures ES2-server-based software application that helps organizations automate the processing of electronic documents by providing batch-based capabilities to digitally sign and certify Adobe PDF documents, validate digital signatures and encrypt/decrypt Adobe PDF documents; safeguards information when it leaves a company's network and integrates with existing public key infrastructures.
Adobe LiveCycle Rights Management ES2-server-based software application that helps organizations manage information access securely with dynamic, persistent document control; allows for access control and auditing of Adobe PDF, Microsoft Word, Microsoft Excel, Microsoft PowerPoint, PTC Pro/ENGINEER, Dassault CATIA and Lattice XVL CAD document usage inside or outside the firewall, online or offline and across multiple document platforms; lets organizations know when a document has been viewed, printed or altered and restricts access so that only intended recipients can open, use and forward a document; allows for previously granted document permissions and access to be revoked; leverages Adobe Acrobat and Adobe Reader and other client plug-in software to author and view protected documents.
Document Output
Adobe LiveCycle Output ES2-server-based solution which supports on-demand document processes including the generation of documents such as correspondence, confirmations, bids, or shipping labels; provides capabilities to merge XML data from back-end systems with Adobe LiveCycle Designer ES templates to generate documents in PDF, PDF/A, PostScript, PCL, or Zebra label formats; customers can customize electronic document packages by combining newly generated PDF documents with existing files from document repositories; customers can also convert PDF documents to print or image file formats and then route them automatically to support direct server-based printing or archiving operations.
Adobe LiveCycle PDF Generator ES2-server-based software which automates the creation, assembly, distribution and archival of PDF documents in combination with critical business processes; converts a wide range of native and standard file formats, and can combine newly created PDF documents with existing files or pages to assemble customized PDF packages; supports direct server-based PDF printing or can convert PDF documents to a wide variety of formats, including image formats and PDF/A.
Adobe LiveCycle PDF Generator 3D ES2-server-based software which extends Adobe LiveCycle PDF Generator ES with support for the conversion and integration of complex 2D and 3D CAD design and engineering product data into a single PDF document that can be shared using the Adobe Reader software without requiring a CAD application or viewer.
Adobe LiveCycle Production Print ES2-server-based solution that performs high-volume jobs through efficient batch processes, generating documents such as statements, invoices, contracts, or welcome kits; merges XML, ASCII or other data types from back-end systems with Adobe LiveCycle Designer ES templates to generate documents in a broad range of print or electronic formats to support high volume production requirements; enables customers to print document packages by collecting multiple jobs over time and then grouping them to minimize mailing costs.
Process Management
Adobe LiveCycle Business Activity Monitoring ES2-software that allows administrators and process participants to quickly identify bottlenecks, check progress and view other process information related to business transactions; comes in two versions: Adobe LiveCycle Business Activity Monitoring ("BAM") ES Standard, which allows for the monitoring of all LiveCycle processes with 16 out-of-the-box dashboards and, Adobe LiveCycle BAM ES Extended, which adds the ability to extend Adobe LiveCycle BAM ES to other enterprise business systems so that users can monitor business processes inside and outside the LiveCycle environment.
Adobe LiveCycle Process Management ES2-server-based process management application that allows organizations to orchestrate people, systems, content and business rules into streamlined, end-to-end processes that are accessible to process participants through engaging user interfaces, online or offline; provides out-of-box dashboards to help users gain insights into business operations in real time and management tools to fix day-to-day operational problems and make long-term process improvements.
16
TABLE OF CONTENTS
Content Services
Adobe LiveCycle Content Services ES2-offers a library of services that can be used with other LiveCycle solution components to create content-rich engagement applications whereby end users can share and collaborate on content development in content spaces as part of a company's business processes; supports check-in/check-out capabilities, keeps a complete audit history of all document actions and provides a fully integrated set of content services ranging from an enterprise content repository to social collaboration tools such as enterprise forums; also includes team collaboration capabilities such as forums and discussions, and provides Microsoft Office plug-ins that enable users to interact with the process engine and content repository using Microsoft Word and Microsoft Excel.
Adobe LiveCycle ES Connectors for ECM-solutions which enable Adobe LiveCycle customers to connect their LiveCycle applications with other industry-leading enterprise content management systems, such as EMC Documentum, IBM FileNet and IBM Content Manager.
Other Knowledge Worker and Enterprise Related Products
Adobe Central Pro Output Server-a server-based software application for document generation that allows organizations to create personalized, customer-facing documents from any data source-including legacy, line-of-business, ERP or CRM applications; merges data with an electronic document template using a powerful processing engine to dynamically generate electronic documents such as purchase orders, invoices, statements and checks for delivery via Adobe PDF, the Web, e-mail, fax or print; works with Adobe Output Designer which is a companion tool used to create sophisticated document templates.
Adobe LiveCycle Designer ES2-desktop software application which simplifies the creation and maintenance of intelligent XML based forms for deployment as Adobe PDF forms, HTML applications and Flash based RIAs; provides an intuitive, graphical design tool for creating XML templates that look exactly as the author intended and previewing them before deployment; it also simplifies adding intelligence to documents, such as business and routing logic, and binding form fields to arbitrary XML schemes for seamless integration with enterprise applications.
Adobe Output Designer-a design tool that allows users to create electronic document templates for use with Adobe solutions for document generation; aids in the creation of electronic documents that exactly replicate existing paper documents.
Adobe Output Pak for mySAP.com-a SAP-certified server-based software application for document generation that enables organizations to optimize their investment in their SAP solution by creating personalized, professional-looking, customer-facing documents; provides an easy, fast and cost-effective way to create and maintain documents for the SAP environment; integrates directly with an SAP system to extract information which is merged with a document template that defines the layout and formatting of the document; output can be in a variety of formats, including Adobe PDF, print, fax, e-mail and the Web.
Adobe Reader-software for reliable reviewing and printing of Adobe PDF documents on a variety of hardware and operating system platforms; when used with certain Adobe PDF documents created with Adobe LiveCycle Reader Extensions Server, Adobe Acrobat Pro or Adobe Acrobat Pro Extended, Adobe Reader also can be used to enable collaborative workflows through the addition of collaboration features built into the Adobe PDF file; these features include review and markup tools that normally are not present in the standard Adobe Reader product.
Adobe Web Output Pak-a server-based software application for document generation; creates documents in PDF and HTML for presentation on the Web and in Wireless Markup Language for presentation to a wireless device; allows users to personalize and control the look of documents based on the data the documents contain.
Omniture Segment
Omniture Market Opportunity
Our Omniture Business segment provides Web analytics and online business optimization products and services, which we deliver through our Omniture line of products and our Omniture Online Marketing Suite. Customers use our Omniture products and services to manage and enhance online, offline and multi-channel business initiatives.
17
TABLE OF CONTENTS
Customers who use our Omniture solutions include marketing professionals such as marketing managers, online marketing managers, search engine marketers, media managers, media buyers, marketing research analysts and the chief marketing officer. Customers also include Web content editors, Web analysts and Web production managers. These customers often are involved in workflows which utilize other Adobe products, such as our creative professional tools and our Adobe Flash Platform client technologies.
We believe there are several key market trends creating opportunities for our Omniture business:
· | Broad commercial utilization of the Internet - The Internet has fundamentally altered the way businesses and consumers purchase and consumer goods and services. It has also redefined many business processes and has created opportunities for new online businesses, as well as for existing offline businesses seeking to capitalize on online initiatives. Because of this, businesses are investing in innovative online initiatives to increase sales, improve customer service, enhance brand awareness, decrease time-to-market for their offerings, reduce fulfillment costs and increase operational efficiency. We expect that the scope and scale of commercial Internet usage will continue to increase. The roll-out of broadband networks and mobile networks, particularly in emerging geographic markets, will contribute to the growth of Internet usage. Internet commerce should also continue to grow. Proliferation of online marketing and customer response channels-such as mobile, online video, and social networks-will continue to generate interactions that need to be measured and analyzed across channels. |
· | Need to measure and automate online business - In order to make informed decisions about priorities and investments in online marketing and other commercial initiatives, we believe businesses require timely and accurate measurement of customer behavior. The proliferation of Internet usage and the fact that nearly every user interaction on a Website (or other digital medium such as mobile phone applications, set-top boxes, kiosks, point of sale systems or any IP connected device) can be captured by the owner of the Website, or other digital medium, have resulted in the creation of an unprecedented amount of data about how a business' customers interact and transact business with it. Businesses are increasingly realizing the benefit of using information gained from online and other digital customer interactions to improve functional areas, such as sales, customer service, product development, marketing, pricing, manufacturing and inventory management. The interactive and measurable nature of Internet activity also enables businesses to determine how customers arrived at their online destinations, such as Web and mobile sites, and to what extent the costs they incur to increase site traffic are generating sales. |
· | Opportunity to optimize online business - Measuring online behavior and automating the capture and analysis of data are important for making informed business decisions. Businesses also need to leverage data to optimize the results of their online business activities. For example, businesses have historically measured the success of their online marketing programs by simple click-through rates or conversion rates, the latter being the percentage of click-through users who make a purchase or otherwise engage in the desired customer action during the online session. However, the effectiveness of online marketing can be optimized by analyzing and acting on deeper information, such as repeat visits, transactions generated, registrations, traffic pathways (various paths of online visitor traffic flow), time spent and quality of interaction (engagement), eventual conversion (desired customer action taken in subsequent visits) or success over time (lifetime value of customer) as well as comparing the relative effectiveness of different marketing channels (attribution). Business success metrics can also vary based on the industry or vertical market – for example, media companies optimize subscriptions and online advertising revenue, whereas retailers and ecommerce companies focus on registrations and online purchases. Online businesses utilize a large and growing number of complex and diverse communication channels to market to customers, including display advertising, paid and natural search advertising, e-mail, social media marketing, affiliate marketing, blogs, podcasts, video, RIAs and comparison shopping engines, as well as traditional offline initiatives. The emergence of multi-channel marketing initiatives, which combine traditional offline marketing initiatives such as television, print, magazine, newspapers, radio and catalog with online marketing initiatives, makes the measurement and analysis of online behavior more challenging, but presents additional opportunities to optimize results. For example, businesses want to measure and understand the impact of their advertising initiatives across all these channels, not only to determine how much credit should be given to a particular channel and to understand cross-promotional effectiveness, but more importantly to optimize search spending, make adjustments in the way channels are utilized and align the amount of resources that are allocated to each of them. |
For many years, Adobe has provided creative tools and ubiquitous clients via the Adobe Flash Platform to help customers create and deliver engaging content and experiences. Given the market trends described above, we believe the combination of our tools and clients with Omniture's capabilities will help customers to more efficiently and effectively measure, analyze and optimize those experiences-creating a complete feedback loop. With this broad platform, we believe
18
TABLE OF CONTENTS
there is a unique opportunity for Adobe to deliver an end-to-end workflow that will allow customers to create, deliver, monetize, and optimize the impact and business results of their content and assets.
Omniture Business Summary
We acquired Omniture on October 23, 2009. As one of the largest businesses in the SaaS industry, our Omniture business segment processed over one trillion transactions during the period of Adobe's fourth quarter in a hosted environment for approximately 5,000 customers around the world.
Like the rest of our business segments, Omniture revenue was adversely affected during 2009 and growth rates slowed compared to those achieved in 2008. However, in a trend that began before our acquisition of Omniture in October 2009, the Omniture business appeared to stabilize during the fourth quarter with the improvement in the general economy, as indicated by an increase in the transaction volume on our network. In addition, our customer retention rates began stabilizing and we experienced an increase in sales of additional subscription services into our existing customer base.
Omniture's flagship product, SiteCatalyst, anchors our analytics business, and represented 56% of the Omniture revenue reported in the fourth quarter of fiscal 2009. This compares to revenue of 62% in the comparable year-ago period, and reflects success against our effort to provide additional types of services beyond analytics which integrate into our Online Marketing Suite. These additional services represented 32% of Omniture's revenue in the fourth quarter of fiscal 2009, and compares to 27% in the comparable year-ago period. Our Omniture professional services, including training and consulting services, comprised the remaining 12% of Omniture's revenue in the fourth quarter of fiscal 2009.
Omniture Strategy
In the coming year, we hope to build upon the momentum Omniture achieved over the past several years by enabling our customers to capture, store and analyze information generated by their Websites and other sources and to gain critical business insights into the performance and efficiency of marketing and sales initiatives and other business processes. We intend to help our customers utilize this information to automate the targeting and delivery of content and marketing offers on a Website, as well as the broader Internet, and test site design and navigational elements to optimize the user experience and revenue opportunities for our customers. We also intend to enhance our services by providing customers with real-time access to online business information, the ability to integrate that information with a broad set of other data sources, and generate flexible reports using real-time and historical data and the ability to measure, automate and optimize critical online processes.
With the acquisition of Omniture in fiscal 2009, we believe we can help customers create a complete feedback loop of creation, delivery, analysis, and optimization around their creative and enterprise workflows. We expect to add capabilities to many of our content creation and developer tools to enable improved trackability of content in such workflows.
We also believe we can accelerate the growth of our Omniture business by expanding the Omniture go-to-market strategy to include new geographies and vertical markets where Adobe has a strong presence.
Omniture Products
We offer the Omniture Online Marketing Suite, our suite of products and services used to manage and enhance online, offline and multi-channel business initiatives, which we host and deliver to our customers on-demand and also provide as an on-premise solution for some products. Our Online Marketing Suite consists of an open business analytics platform and an integrated set of optimization applications for visitor acquisition, conversion, online analytics and multi-channel analytics. These components and services are accessed primarily by a Web browser, and are built on a scalable and flexible computing architecture. As such, these components and services reduce the need for our customers to make upfront investments in technology, implementation services or additional IT personnel, thereby increasing customers' flexibility in allocating their IT capital investments.
The components of our Online Marketing Suite, are described in more detail below and are organized by four main components of our offering: Visitor Acquisition, Conversion, Online Analytics and Multi-channel Analytics.
Omniture Visitor Acquisition
Omniture SearchCenter-hosted software which simplifies search marketing by providing a common interface to manage search campaigns across multiple search engines, integrate campaign metrics with web analytics, and optimize across marketing programs; enables search marketing to occur in the context of a broader marketing plan such that users such as online marketers can improve brand engagement and online conversions.
19
TABLE OF CONTENTS
Omniture Conversion
Omniture Test&Target-hosted software which provides users such as marketers the capabilities to make their online content and offers more relevant to their customers, yielding the potential for greater customer conversion; provides an intuitive interface for rapidly designing and executing tests, creating audience segments and targeting content.
Omniture Survey-hosted software which helps organizations design, create and implement online surveys to measure audience sentiment.
Omniture SiteSearch-hosted software which gives users such as marketers the ability to control and optimize the search results on their sites; enables control over the search experience with presentation and navigation features designed to help guide visitors to the most relevant information; integrated with Omniture SiteCatalyst, SiteSearch dynamically promotes the most successful products, services and content to the top of search results using analytics-derived metrics such as revenue, conversion rates and page views.
Omniture Recommendations-hosted software which enables businesses to promote products and content online; utilizes flexible data and behavioral driven algorithms, allowing customers to increase conversions on their Websites by ensuring relevant choices are automatically presented to customers, either on Websites or through email campaigns.
Omniture Merchandising-hosted software which enables retailers to implement online merchandising strategies that optimize marketing effectiveness through increased conversions and average order value; helps retailers grow their online business by improving shoppers' ability to find and select products, as well as promoting products based on business goals and metrics.
Omniture Publish-an on-demand Web content management solution that enables business users to easily create, manage and update Web content without the need of IT or Web developers; enables content owners to easily publish and maintain content on their Websites.
Omniture Online Analytics
Omniture SiteCatalyst-hosted software which provides customers and users such as marketers the ability to capture, store and analyze information generated by their Websites and other sources and to gain real-time business insights into the performance and efficiency of marketing and sales initiatives and other business processes; built on a scalable and flexible computing architecture.
Omniture Discover-hosted software which provides users such as Web analysts and online marketers with real-time visitor information and insight; enables businesses to understand a comprehensive, multi-dimensional view of their customers through accurate and timely information such that they can make informed decisions to improve the performance of their business.
Omniture Multi-Channel Analytics
Omniture Insight-on-premise software which enables organizations to quickly analyze large volumes of rapidly evolving data in real-time; provides users with visualization capabilities to assist them with making quick business decisions that can improve overall business performance; accepts data from any source, including data warehouses and business intelligence tools.
Omniture Insight for Retail-on-premise software which provides organizations with rapid customer insights using real-time analysis of large volumes of continuously changing point-of-sale, kiosk and inventory data; helps users correlate data to online interactions for a deeper understanding of customer responses across multiple channels.
Omniture Open Business Analytics Platform
Omniture DataWarehouse-contains the information captured by Omniture SiteCatalyst, our core Omniture product offering, and other Omniture applications.
Omniture Genesis-contains application programming interfaces to integrate and augment analytics data with relevant data from Internet and enterprise applications and data from a growing number of online and offline channels to enable business optimization.
20
TABLE OF CONTENTS
Platform Segment
Central to our long-term strategy is our Adobe Flash Platform which enables the development and delivery of applications, content and video which dramatically improve how businesses engage with their customers and constituents. The Adobe Flash Platform includes client technologies such as Adobe Flash Player, Adobe Flash Lite and Adobe AIR. It also includes developer tools and technologies such as Adobe Flash Professional, Adobe Flash Builder (formerly Flex Builder), Adobe Flash Catalyst, Adobe Flash Platform Services and Adobe Flex. In addition, server technologies such as Adobe FMS and Adobe LiveCycle Data Services round out our Flash Platform offerings. Of these products and services, Flash Professional, FMS and LiveCycle Data services are managed and delivered in other Adobe business units, yet they remain core components of our Flash Platform.
Platform Market Opportunity, Business Summary and Strategy
Our Platform Business Unit focuses on the development, marketing and licensing of our Adobe Flash Platform technologies. We have achieved penetration of Adobe Flash Player on more than 98% of Web-connected PCs – making it the most widely distributed rich client software in the world. In addition, Adobe Flash Lite, which is licensed by mobile handset and consumer electronic device manufacturers, has been distributed on more than 1.2 billion devices as of the Fall of 2009.
The broad reach and rapid adoption of the newest versions of these Adobe Flash Platform technologies allows us to rapidly innovate with our desktop and enterprise server software which utilize these technologies – enabling our customers to deliver new and more engaging experiences to their constituents that leverage the latest advancements in operating systems, hardware and rich media technologies.
Our most recent major release of Adobe Flash Player for personal computers, version 10, was delivered in the fall of 2008. Within ten months of availability, more than 93% of Web-connected PCs in mature markets had this latest version installed, the fastest adoption ever for a new version of our Flash Player. Building upon the success of Flash Player 10, we released a beta version of Flash Player 10.1 in November of 2009. In concert with the availability of new versions of our Flash server products, the newest Flash Player adds improved video capabilities such as HTTP streaming, content protection, peer-to-peer support, and enhanced digital video recorder capabilities such as pause, instant replay, and slow motion.
Due to the success and frequent electronic downloads of client technologies such as Flash Player, we generate revenue through OEM relationships with companies such as Google, where we include their technologies as part of the download offerings of our client technologies. In fiscal 2009, this download revenue grew by more than 40% when compared to fiscal 2008, and represented a significant part of the overall revenue we reported in our Platform segment.
As hundreds of millions of people around the world adopt Internet-connected hand-held phones and devices as a means to communicate, collaborate and entertain, as well as consumer electronic devices such as digital cameras, game consoles, music players and electronic educational toys, we believe a significant opportunity exists to offer our Adobe Flash Platform technologies for these devices to provide for the creation and delivery of rich content, user interfaces and data services which allow users to engage with information more easily and effectively. This trend equally applies to categories such as Netbooks and Internet-connected televisions, and the explosion in adoption of such devices is creating a challenge for content owners and application developers to deliver consistent experiences across multiple devices, operating systems, Web browsers and screen sizes.
To address this opportunity, we participate in the Open Screen Project ("OSP"), which enables designer and developers to seamlessly publish content and applications across connected devices that utilize Adobe Flash and AIR as a technology foundation. Initially started in May 2008 with approximately twenty other participating companies, momentum for OSP grew significantly in fiscal 2009 as the number of member companies supporting OSP grew to approximately fifty by October of 2009. Newest OSP members include Google, RIM and Palm, who join many other hardware manufacturers, mobile and television technology providers and media companies.
Essential to the momentum of OSP was our decision to eliminate licensing fees with our Flash client technology, as well as progress towards our goal of delivering the full Flash Player that currently runs on PCs to the smartphone platform. The removal of Flash licensing fees due to OSP resulted in an expected decline in Flash Lite mobile client revenue, with revenue in fiscal 2009 decreasing by more than fifty percent when compared to revenue achieved in fiscal 2008.
To address the opportunity of explosive growth in smartphone adoption, we made significant technological progress during the year with the conversion of Flash Player to run on non-PC devices. New Flash Player improvements include improved graphics acceleration, audio/video decoding, battery optimization, improved rendering speed and reduced memory
21
TABLE OF CONTENTS
consumption. In addition, new features include developer support for multi-touch and gesture user interfaces, accelerometer support and screen orientation adjustments, and mobile text input mechanisms. Based on this progress, in October of 2009 we demonstrated initial versions of the new Flash Player running on smartphones systems using operating systems such as Google Android and Windows Mobile. We expect to deliver beta versions of this software to handset manufacturers using these operating systems as well as Palm WebOS, Nokia S60 and RIM. We further expect handset manufacturers using these platforms to begin shipping phones with Flash Player 10.1 installed on them starting in the first half of 2010.
With the delivery of Flash Player 10.1 in fiscal 2010 to OSP members, we believe nineteen of the top twenty handset manufacturers have now committed to utilizing Adobe Flash technologies for Web browsing, application creation and the delivery of rich, consistent Internet experiences on their devices. Over time, we expect this broad community to adopt Flash Player 10.1, increasing the need for Adobe's designer and developer tools used to create content and applications, as well as broadening our Omniture and LiveCycle opportunities as Web and IT developers extend the reach of their solutions to include mobile handsets as enterprise clients.
Another major focus of our Platform business unit is to broaden the reach and capabilities of the Adobe Flash Platform through the delivery of our newest cross-platform client named Adobe AIR. Based on Flash, PDF and HTML technologies, Adobe AIR enables the creation and delivery of Web-enabled desktop applications that run outside of a Web browser. Adobe AIR-based applications extend today's Web browser-based applications to have the power and utility of desktop applications with capabilities such as access to the local file system, alerts and notifications, and the ability to work offline and then synchronize data when the application has online access again. Developers of Adobe AIR applications are able to create persistent, branded desktop experiences which can be developed using standard Web technologies such as HTML, Ajax, Flash and PDF, as well as common audio and video formats.
Adoption of Adobe AIR has been substantial since first being made available in fiscal 2008. As of October 2009, there were more than 250 million AIR downloads, along with more than one million downloads of the AIR developer tools used to create these applications. Companies such as eBay, DirecTV, The NASDAQ Stock Market, FOX News, Salesforce.com, The New York Times, AOL, Atlantic Records and the BBC have already deployed commercial applications based on Adobe AIR.
As the adoption of our Flash Platform grows, our Platform team also focuses on the development and delivery of our developer solutions such as Flash Builder and Flash Catalyst to leverage the latest innovations adopted by Flash Player users. These solutions ensure reliable, secure and rich application experiences across the broadest range of browsers, operating systems and devices. In fiscal 2010, we expect to deliver new versions of Flash Builder and Flash Catalyst as standalone products, as well as part of our Creative Suite family of products to address the needs of designers and developers creating content and applications for both PC and non-PC environments.
We also anticipate that growth in sales of Internet-connected televisions from vendors like Samsung and Vizio will continue to increase. Participation by these partners and potentially others will extend our opportunity for Flash Player distribution from mobile devices to Internet-connected consumer electronic devices in the digital home. We expect this in turn will increase the need for designer and developer solutions – ranging from our Creative Suite family of products to previously mentioned developer tools and technologies which make up the Adobe Flash Platform.
Our ColdFusion product line also provides fast and easy ways to build and deploy powerful Internet applications. Developers can extend or integrate ColdFusion with Java or .NET applications, connect to enterprise data and applications, create and interact via Web services, or interface with SMS on mobile devices or instant messaging clients. ColdFusion can also be used for business reporting, rich-forms generation, printable document generation, full-text search and graphing and charting-enabling customers to more fully engage their constituents with better Web experiences. Although our ColdFusion business was affected by the economy in fiscal 2009, we continued to innovate and provide ColdFusion developers with enhanced capabilities to support their evolving needs.
Platform Products
Adobe AIR-desktop client software which allows developers to use existing Web development skills (e.g. HTML, Ajax, Flash and Flex) to build and deploy RIAs on the desktop and on non-PC devices.
Adobe ColdFusion-provides a server-scripting environment and a set of features used by organizations for building database-driven scalable applications that are accessible through Web browsers, Adobe Flash Player and Adobe AIR; built on an open Java technology architecture and can be deployed on third-party Java application servers that support the J2EE specification.
Adobe ColdFusion Builder-new development tool for building ColdFusion applications; provides a unified, customizable and extensible development environment to code applications, manage servers and deploy projects.
22
TABLE OF CONTENTS
Adobe ColdFusion in the Cloud-new hosted service available in beta release; enables developers to build ColdFusion applications through the Amazon Web Services environment with access to the capabilities of ColdFusion as a hosted service.
Adobe Flash Catalyst-an interaction design tool for prototyping RIAs and enabling design and development workflows throughout the application development cycle.
Adobe Flash Lite-client software used in a wide range of non-PC devices including mobile phones and consumer electronic devices; provides a subset of Adobe Flash Player functionality for viewing and interacting with content designed for mobile handsets, televisions and other types of devices.
Adobe Flash Builder-an Eclipse-based IDE for developing RIAs with the Adobe Flex framework for either Adobe Flash Player or Adobe AIR; developers utilize Flash Builder to quickly build and deploy applications that are expressive, intuitive and rich in interactivity.
Adobe Flash Player-the most widely distributed rich client software on PCs and consumer electronic devices, Adobe Flash Player provides a runtime environment for text, graphics, animations, sound, video, application forms and two-way communications.
Adobe Flash Platform Services-new developer services that enable advertisers and content publishers to promote, measure and monetize applications across social networks, desktops and mobile devices.
Adobe Flex-a free, open source framework, compiler and debugger for developing RIAs targeting the Adobe Flash Platform; developers use Flex to compile and debug MXML and ActionScript files into the SWF format that executes in Adobe Flash Player and Adobe AIR.
Print and Publishing Segment
Our Print and Publishing business segment contains several of our products and services which address market opportunities ranging from the diverse publishing needs of technical and business publishing to our legacy type and OEM printing businesses. These opportunities and the products we offer to address them, are reviewed below in the following OEM PostScript and Print and Publishing categories.
OEM PostScript Opportunity and Strategy
Graphics professionals and professional publishers require quality, reliability and efficiency in production printing, and we believe our printing technology provides advanced functionality to meet the sophisticated requirements of this marketplace. As high-end printing systems evolve and transition to fully digital, composite workflows, we believe we are uniquely positioned to be a supplier of software and technology based on the Adobe PostScript and Adobe PDF standards for use by this industry. We generate revenue by licensing our technology to OEMs that manufacture workflow software, printers and other output devices.
In fiscal 2009, we maintained our OEM PostScript revenue through continued innovation with PostScript technologies. In 2010, we plan to continue to enhance PostScript as well as utilize PDF enhancements to maintain these formats as standards in publishing and printing work flows.
OEM PostScript Products
Adobe PostScript-a printing and imaging page description language that delivers high quality output, cross-platform compatibility and top performance for graphically-rich printing output from corporate desktop printers to high-end publishing printers; gives users the power to create and print visually rich documents with total precision; licensed to printing equipment and workflow software manufacturers for integration into their printing products.
Adobe PDF Print Engine-a new, next-generation printing platform that enables complete, end-to-end PDF-based workflows using common PDF technology to generate, preview and print PDF documents; allows PDF documents to be rendered natively throughout a workflow, providing performance benefits which include eliminating the need to flatten transparent artwork.
23
TABLE OF CONTENTS
Print and Publishing Market Opportunity and Strategy
In addition to the market opportunities and our businesses discussed previously, we offer a variety of products and solutions which address many different and unique publishing market needs. Our Print and Publishing Business Unit focuses on these solutions which address the diverse customer needs in markets such as technical document publishing and communication, business document publishing, CD-ROM publishing, eLearning solutions, on-line help systems and typography.
In fiscal 2009, we released version 11.5 of our Adobe Director software targeted at game developers, multimedia authors, and e-learning professionals. The updated release includes new features for creating immersive gaming and multimedia applications, support for a new audio engine, HD video and advanced 3-D features.
In fiscal 2010, we will continue to support these offerings to meet the diverse needs of each product's user base. In addition, we believe there to be an opportunity to enhance some of our offerings, particularly in the technical communication and eLearning markets, through a comprehensive offering of several of our products to provide a complete end-to-end solution.
Print and Publishing Products
Adobe Authorware-a legacy rich media authoring tool used to develop caption based eLearning on Windows and Macintosh based platforms; use of the product ranges from creating Web-based tutorials to simulations incorporating audio and video; applications developed with Adobe Authorware can be delivered on the Web, over corporate networks or on CD-ROM.
Adobe Captivate-enables users to rapidly create professional and engaging eLearning content – including software simulation, quizzes, animation and multi-media-and deliver the content in Adobe Flash and other formats; the content can be created without any programming or multi-media skills and can be published to CD/DVDs and Learning Management Systems used in training, sales, marketing and customer support applications; often used in combination with Acrobat Connect, Adobe Captivate provides a robust technology solution to bring understanding and retention to end users of rapid training and eLearning solutions.
Adobe Contribute-an easy-to-use tool to update and publish Web content, designed for non-technical business users who need to make minor changes to intranet and Internet Websites that conform to the structure, style, layout and site standards setup by a Website administrator; streamlines the Web content maintenance process and provides Website administrators with a set of simple content management functionality to manage and administer Websites; also provides bloggers with a simple tool to create and update their blogs.
Adobe Director-a tool for creating professional multimedia content that combines images, text, audio and video into presentations, interactive experiences and prototypes; for Websites, it provides users with the ability to deliver multimedia content that supports three dimensional content and animations for use in various markets, including education, games and commerce; also enables the creation of fixed-media content for CD titles and DVD titles in the entertainment, education and corporate training markets.
Adobe Font Folio OpenType Edition-contains more than 2,200 typefaces from the Adobe Type Library in OpenType format, offering a complete type solution for print, the Web, digital video or electronic documents.
Adobe FrameMaker-an application for authoring and publishing long, structured, content-rich documents including books, documentation, technical manuals and reports; provides users a way to publish their content to multiple output formats, including print, Adobe PDF, HTML, XML and Microsoft Word.
Adobe JRun-a legacy application server solution based on the J2EE specification; integrates with our development tool offerings and is used to deploy applications for functions such as online banking and customer service.
Adobe PageMaker-software used to create high-quality documents simply and reliably with robust page layout tools, templates and stock art.
Adobe RoboHelp-an easy-to-use authoring tool used by developers and technical writers to create professional help systems and documentation for desktop and Web-based applications; utilizes support for HTML, PDF import/export, team authoring capabilities, as well as JavaHelp.
Adobe Shockwave Player-a rich media player used for deploying multimedia content for use in Internet solutions including education, training, games and commerce.
24
TABLE OF CONTENTS
Adobe Technical Communication Suite-includes Adobe Acrobat Pro Extended, Adobe Captivate, Adobe FrameMaker and Adobe RoboHelp technologies; helps customers improve their workflows, especially technical communicators who want a single solution to meet their content creation and publishing needs.
Adobe Type Library-includes Adobe's best-selling typefaces, plus Adobe Type Manager; makes it easy to create beautiful text for print, Web and video projects.
Adobe Type Classics for Learning-a low-cost, introductory font library designed for students and educators.
Adobe Type Manager-provides powerful, easy management of all PostScript Type 1, OpenType and TrueType fonts.
Adobe Type Sets-various collection packages of Adobe's best-selling typefaces; makes it easy to create beautiful text for print, Web and video projects.
FreeHand MX-a professional vector graphics tool designers and illustrators use to create high quality images that can be scaled; supports developing images for print, the Web and Adobe Flash Player.
See Note 20 of our Notes to Consolidated Financial Statements for further information regarding our industry segments and geographic information. See risk factor "We are subject to risks associated with global operations that may harm our business" in Item 1A of this report for a discussion of risks related to our foreign operations.
COMPETITION
The markets for our products are characterized by intense competition, evolving industry standards and business models, disruptive software and hardware technology developments, frequent new product introductions, short product life cycles, price cutting with resulting downward pressure on gross margins and price sensitivity on the part of consumers. Our future success will depend on our ability to enhance our existing products, introduce new products on a timely and cost-effective basis, meet changing customer needs, extend our core technology into new applications and anticipate and respond to emerging standards, business models, software delivery methods and other technological changes.
Creative Solutions
In our Creative Solutions segment, we offer the Adobe Creative Suite in multiple editions which consist of combinations of several of our technologies. In addition to offering the technologies within the Creative Suite editions, we also offer them as individual software applications. These products compete with those from many companies, including Apple, Corel, Avid, Quark, Microsoft and others, as well as from various open source initiatives.
With respect to Microsoft, their Expression Studio competes with our Adobe Creative Suite family of products as well as individual Creative Solutions segment products. Expression Studio includes Microsoft Expression Design which competes with our Adobe Illustrator, Adobe Photoshop, Adobe Photoshop Lightroom and Adobe Fireworks products; Microsoft Expression Blend which competes with our Adobe Flash Professional product; Microsoft Expression Web which competes with our Adobe Dreamweaver product; and Microsoft Expression Media which provides digital asset management, basic image editing and video encoding/compression capabilities and competes with some aspects of our video and hobbyist-focused products. To compete with Adobe Flash, Microsoft markets its Silverlight product and technology which provides capabilities for the creation of media experiences and interactive applications for the Web that incorporate video, animation, interactivity and user interfaces.
We believe our Adobe Creative Suite family of products competes favorably on the basis of features and functionality, ease of use, product reliability, price and performance characteristics. The individual technologies within the Creative Suite editions also work well together, providing broader functionality and shortened product training time for the individual who uses multiple applications to complete a project.
We also believe our individual Creative products compete favorably against those offered by our competitors, as discussed below.
Drawing and illustration products are characterized by feature-rich competition, brand awareness and price sensitivity. In addition to competition with Microsoft's Expression Design product, our Adobe Illustrator product faces competition from companies such as ACDsee, Corel, Mediascape, Xara and the open source product called Karbon14. We believe our products compete favorably due to high customer awareness of their rich features, especially the drawing and illustration functionalities, the technical capabilities of the product and our ability to leverage core technologies from our other established products.
25
TABLE OF CONTENTS
The demand for Web page layout and Web content creation tools is constantly evolving and highly volatile. In addition to competition with Microsoft's Expression Blend and Web products, we believe Adobe Dreamweaver and Adobe Flash Professional face direct and indirect competition from desktop software companies such as Bare Bones Software and various proprietary and open source Web authoring tools. We also face competition from Ajax and Microsoft Visual Studio products, and other integrated development environments that enable developers to create Web applications from companies such as BEA Systems (a subsidiary of Oracle), Borland and IBM. We believe our products compare favorably to these applications; however, our market share may be constrained by Microsoft's ability to target its Web software to users in markets it dominates. These target customers include users of Microsoft Office, Microsoft Windows operating system, the Microsoft Internet Explorer Web browser and Microsoft Visual Studio.
The needs of digital imaging and video editing software users are constantly evolving due to rapid technology and hardware advancements in digital cameras, digital video cameras, printers, personal computers, cellular phones and other new devices. Our software offerings, including Adobe Photoshop, Adobe Photoshop Extended, Adobe Photoshop Elements, Adobe Photoshop Lightroom, Adobe After Effects, Adobe Audition, Adobe Soundbooth, Adobe Encore, Adobe Premiere Elements and Adobe Premiere Pro, face competition from companies offering similar products. We also continue to face competition from new emerging products, including online based services which compete directly with our Photoshop.com offering, as well as any new competitive products coming from the open source movement.
Our other digital imaging and video editing offerings, including Adobe Photoshop Elements and Adobe Premiere Elements, are subject to intense competition, including customer price sensitivity, competitor brand awareness and competitor strength in OEM bundling and retail distribution. We face direct and indirect competition from a number of companies that market software which competes with ours, including ACD Systems, AI Soft (Japan), Apple, ArcSoft, Corel, i4 (Japan), Google, Kodak, Nova Development, Magix, Microsoft, Phase One, Photodex Corporation, Sonic, Pinnacle, Sony and Yahoo. In addition, we face competition from device, hardware and camera manufacturers such as Apple, Canon, Dell, Hewlett-Packard, Nikon, Sony and others as they try to differentiate their offerings by bundling, for free, their own digital imaging software, or those of our competitors. Similarly, we face potential competition from operating system manufacturers such as Apple and Microsoft as they integrate hobbyist-level digital imaging and image management features into their operating systems. Finally, we face potential competition from open source products, including Gimp for Linux.
We believe we compete favorably against other digital imaging, digital video and consumer-focused image management software applications with our Adobe Photoshop Elements and Adobe Premiere Elements products due to strong consumer awareness of our brand in digital imaging and digital video, our relationships with significant OEMs, positive recommendations for our products by market influencers, our increased focus on the retail software channel and strong feature sets.
In professional digital imaging, software applications compete based on product features, brand awareness and price sensitivity. In addition to competition with Apple's Aperture product and Microsoft's Expression Design product, our Adobe Photoshop and Adobe Photoshop Lightroom products face direct and indirect competition from a number of companies including Corel. Our Adobe Photoshop products compete favorably due to high customer awareness of the Photoshop brand in digital imaging, the positive recommendations for our Photoshop product by market influencers, the features and technical capabilities of the product and our ability to leverage core features from our other established products.
Our Adobe InDesign product, used for professional page layout, faces significant competition. The main competitor, Quark, has a competitive product, Quark XPress, which has maintained a historically strong market share in the professional page layout market. Quark also benefits from an established industry infrastructure that has been built around the use of their XPress product in print shops and service bureaus, and through the development of third-party plug-in products. Barriers to the adoption of Adobe InDesign by Quark XPress customers include this infrastructure, as well as the cost of conversion, training and software/hardware procurement required to switch to InDesign. We have seen an increase in the adoption of InDesign software and we believe we will continue to see market share gains going forward due to a product offering that contains new innovative features, improved integration with our other products, our strong brand among users, positive reviews by industry experts, adoption of InDesign by major accounts which are influencers in their industries and improved infrastructure support by the industry for our overall solution.
Applications for digital video editing, motion graphics, special effects, audio creation and DVD authoring face increasing competition as video professionals and hobbyists migrate away from analog video and audio tools towards the use of digital camcorders and digital video production on their computers and DVD systems for rich media playback. Our Adobe After Effects, Adobe Audition, Adobe Encore, Adobe Premiere Pro and Adobe Soundbooth software products, as well as the
26
TABLE OF CONTENTS
Adobe Production Studio which contains these products, face competition from companies such as Apple, Avid, Canopus, Sonic and Sony. Our Adobe Premiere Elements software product which is targeted for use by hobbyists, faces competition from companies such as Aist, Apple, ArcSoft, Avid, Broderbund, Corel, Cyberlink, Magix, Microsoft, Muvee and Sony – as well as video editing capabilities found in operating systems and other video editing solutions bundled by video camcorder manufacturers with their hardware offerings.
Adobe After Effects is a leader in professional compositing and visual effects due to its strong feature set and its integration with our other products that helps create a broad video editing platform for our customers. In professional digital video editing, we are an industry leader with Adobe Premiere Pro and compete favorably due to our strong feature set, our OEM relationships and the integration with our other products to create a broad digital video publishing platform for our customers.
Business Productivity Solutions
With our Adobe Acrobat business, we continue to face competition from Microsoft. Their Windows operating system includes a proprietary digital rights management technology and a document format, called XML Paper Specification ("XPS"), which competes with Adobe PDF. In addition, Microsoft's widely used Office product offers a feature to save Microsoft Office documents as PDF documents. This PDF feature in Office competes with Adobe Acrobat. Given Microsoft's market dominance, XPS, the PDF feature in Office and any other competitive Microsoft product or technology that is bundled as part of its Office product or operating system or made freely available, could harm our overall Adobe Acrobat market opportunity.
Our Adobe Acrobat product family also faces competition in the PDF file creation market from many clone products marketed by companies such as AdLib, Active PDF, Apple, Global Graphics, Nuance, Software995, Sourcenext and others. In addition, other PDF creation solutions can be found at a low cost, or for free, on the Web.
For customers that use Adobe Acrobat as part of document collaboration and document process management solutions, where electronic document delivery, exchange, collaboration, security and archival needs exist, our Acrobat product family faces competition from entrenched office applications such as Microsoft Office and its integration with their SharePoint product. In the higher end of the electronic document market, Acrobat Pro and Acrobat Pro Extended provide features which compete with other creative professional PDF tool providers, such as Enfocus, Dalim and Zinio. In addition, we are targeting the architecture, engineering and construction electronic document collaboration market with our Acrobat Pro Extended product.
To address the threats from Microsoft and others, we are working to ensure our Adobe Acrobat applications stay at the forefront of innovation in emerging opportunities such as PDF document generation, document collaboration and document process management.
Our Web conferencing solution, Adobe Acrobat Connect Pro, faces competition from many Web conferencing vendors, including Cisco WebEx, Microsoft Office Live Meeting, IBM Lotus Sametime and Citrix GoToMeeting. Cisco WebEx is a market share leader and Microsoft has steadily increased its marketing of Microsoft Office Live Meeting. To address these and other smaller competitors in the Web conferencing space, we focus on providing a differentiated and enhanced user experience through our Adobe Flash Player.
The markets we address with our Adobe LiveCycle Enterprise Suite are influenced by evolving industry standards, rapid software and hardware technology developments, and new product introductions from competitors such as Microsoft and IBM.
Microsoft has already brought to market new products and technologies to address many of the emerging market needs we focus on with our Adobe LiveCycle family of products. Microsoft continues to offer its eForms solution called InfoPath in certain versions of Microsoft Office and has added Office Forms Services which extends their forms to users as MS Outlook e-mail messages or to Web browsers rather than the InfoPath client. They also continue to offer their Windows Rights Management Services in their Windows Server product which is designed to allow corporate networks to manage and enforce restrictions built into documents.
27
TABLE OF CONTENTS
As discussed previously, Microsoft markets Windows and Office which include a document format called XPS which competes with Adobe PDF. Certain Windows operating systems also contains a proprietary digital rights management technology which competes with Adobe LiveCycle Rights Management ES. In addition, Microsoft's most recent version of Office includes an updated version of its SharePoint product which competes with certain aspects of our Adobe LiveCycle products. Microsoft has also recently delivered technology called Windows Presentation Foundation and Silverlight which offers an alternative to building RIA applications within the Microsoft .NET framework.
In the electronic forms solution market, in addition to competition from Microsoft Infopath based solutions, we face competition from IBM through their eForms solution recently rebranded as Lotus Workplace Forms. Similarly, we face competition for document process management solutions from workflow solution vendors such as PegaSystems, Lombardi, Nuance and Ultimus.
We believe that our Adobe LiveCycle server product family competes favorably against these companies and formats in terms of the combined benefits of superior functionality, cross-platform visual page fidelity/reliability, multi-platform capability, file compression, printing and security of documents expressed using Adobe PDF. We also believe that Adobe PDF and its integration with XML, combined with the broad distribution of Adobe Reader on all leading hardware platforms, provide a universal multi-platform solution that is more compelling than our competitors' offerings.
Omniture
In our Omniture segment, we compete primarily with Web analytics and business optimization vendors whose software is provided on demand to customers, generally through a Web browser. We also compete to a limited extent with vendors whose software is installed by customers directly on their servers. In addition, we compete at times with our customers' or potential customers' internally developed applications.
Our current principal competitors include companies such as Coremetrics, Google, Microsoft, Nedstat, Yahoo! and WebTrends that offer on-demand services. We also compete with software vendors, such as Infor (which owns Epiphany), Nielsen/NetRatings, a part of the Nielsen Online Unit of the Nielsen Company, Unica Corporation (which acquired Sane Solutions) and SAS Institute. In addition, we also compete with online marketing service providers, such as Microsoft Advertising (formerly aQuantive when acquired by Microsoft), DoubleClick (owned by Google) and 24/7 Real Media (acquired by WPP).
Our Omniture Test&Target products also compete with multivariate testing providers, such as Optimost (owned by Autonomy), Memetrics (acquired by Accenture), Kefta (acquired by Acxiom Digital) and [x + 1]. Our Omniture SiteSearch products compete with intra-site search vendors, such as Autonomy, Endeca Technologies, FAST Search and Transfer ASA (acquired by Microsoft) and Google. Our Omniture Merchandising product competes with merchandising solutions providers such as Endeca (ThanxMedia), Celebros, SLI Systems, Nextopia Software and Fredhopper. Our Omniture InSight products compete with channel analytics providers, such as Truviso, Clickfox, Qliktech and AsterData. Our Omniture Recommendations product competes with product recommendations providers, such as Aggregate Knowledge, Baynote, Certona, Rich Relevance and Amadesa. Finally, our Omniture Survey product competes with survey providers such as OpinionLab, iPerceptions and Foresee Results.
Many of the companies that offer Web analytics software offer other products or services and as a result could also bundle their products or services, which may result in these companies effectively selling their products or services at or below market prices.
In addition, large software, Internet and database management companies may enter the market or enhance their Web analytics capabilities, either by developing competing services or by acquiring existing competitors or strategic partners of ours, and compete against us effectively as a result of their significant resources and preexisting relationships with our current and potential customers. For example, Google offers a Web analytics service free of charge, and acquired DoubleClick, one of our strategic partners, in 2008. Also, Microsoft offers a Web analytics service free of charge, and offers Microsoft Advertising, which is based on their 2007 acquisition of aQuantive. In addition, Yahoo! also offers a Web analytics service based on its acquisition of IndexTools.
We believe competitive factors in our markets include the proven performance, security, scalability, flexibility and reliability of services; the strategic relationships and integration with third-party applications; the intuitiveness and visual appeal of services' user interfaces; the low total cost of ownership and demonstrable cost-effective benefits to customers; the ability of services to provide N-dimensional segmentation of information; pricing; the flexibility and adaptability of services
28
TABLE OF CONTENTS
to match changing business demands; enterprise-level customer service and training; perceived market leadership; the usability of services, including services being easy to learn and remember, efficient and visually compelling; the real-time availability of data and reporting; independence from portals and search engines; the ability to deploy the services globally and to provide multi-currency, multi-language and multi-character support and to have a local presence in international markets; and success in educating customers in how to utilize services effectively.
We believe that we compete favorably with our competitors on the basis of these factors. However, if we are not able to compete successfully against our current and future competitors, it will be difficult to acquire and retain customers, and we may experience revenue declines, reduced operating margins, loss of market share and diminished value in our services.
Platform
Our Adobe Flash Platform technologies, including Adobe Flash Player and Adobe AIR, face competition from Microsoft Silverlight, as well as alternative approaches to building RIAs – including Google Gears and JavaFX. Our Adobe ColdFusion product family and our Adobe Flash Builder developer tool products face competition from major vendors including Microsoft, IBM, BEA (a subsidiary of Oracle) and Sun. Our ColdFusion products also compete with several technologies available today at no cost including the PHP and PERL programming environments that are available for the Apache Web server.
Beyond the competitive threats from Microsoft previously discussed, vendors such as Tibco, JackBe, Backbase and NexaWeb offer potentially competitive solutions in the RIA market that we target with our open source Adobe Flex solution. We also believe RIAs will make use of both open source Ajax frameworks and the open source Flex framework to create hybrid RIAs in the browser, and we anticipate increased adoption of AIR as a development platform for Ajax developers. With our FMS solution, we face competition from Microsoft with their Windows Media Server for Windows Media and Silverlight, as well as Move Networks, Real Networks, Apple and others.
Version 5 of the Web markup language HTML ("HTML5") is being developed by an industry consortium that includes Adobe and leading browser manufacturers such as Apple, Google and Microsoft. HTML5 will contain new features which will compete with some of the features of Flash Player, such as the ability to play video natively within the browser. We will work to implement support for HTML5 in our Web authoring solutions. Yet, we believe the competing interests of the browser developers, and the potential for inconsistency in how each major browser implements HTML5 will create a continuing demand for solutions such as Flash that provide a consistent presentation capability that works across browsers, operating systems and devices.
Our mobile and device solutions are influenced by evolving industry standards, rapid software and hardware technology developments and frequent new product and technology introductions by companies or open-source initiatives targeting similar opportunities. Technologies and products which compete with our Adobe Flash Platform clients and solutions include Java, Brew, Scalable Vector Graphics, Wireless Application Protocol, Apple Mac OS utilized on the Apple iPhone, Microsoft Windows Mobile, as well as solutions from the open source movement, vendors supplying clone versions of these products and technologies and vendors which choose to exclude the use of our solutions and technologies on their devices. With respect to the Apple iPhone, although our desire is to work closely with Apple to deliver Adobe Flash Platform technologies on their device similar to our approach with other mobile vendors, we are prohibited from making advancements towards this goal until we have Apple's cooperation to do so.
We believe our Adobe Flash Platform solution competes favorably against these technologies and solutions due to the distribution of Adobe Flash Player technology on a broad set of platforms, including PCs, mobile phones and consumer electronic devices. We also believe our robust programming model and developer tools used to create video output for the Flash Player, the large Flash developer community and ecosystem which utilize our tools, and the growth of companies who have joined the OSP to utilize the Flash Platform as a basis for rich content and application delivery are key assets in our ability to effectively compete in this market. Further, the rich expressiveness of Flash which provides the capability to deliver audio, video, motion graphics, vector graphics and visual effects resulting in rich user experiences and interfaces on mobile devices, is a key differentiation when compared to the capabilities of alternate solutions.
In the past year, the mobile industry experienced many announcements and introductions of new mobile devices and platforms-and we expect innovation and new announcements such as those seen in 2009 to continue in 2010. We view these ongoing developments from major mobile companies such as Google, Nokia, Palm, Rim and others as opportunities to deploy our technologies and solutions. Just as we maintain a philosophy of cross-platform support in the personal computer desktop world for operating systems such as Microsoft Windows, Apple Mac OS, Unix and Linux, we expect to continue to enhance our support for a wide variety of mobile and consumer electronic platforms, and we intend to make our products and services available on viable, new entrant platforms as well.
29
TABLE OF CONTENTS
Print and Publishing
Our Print and Publishing product line targets many markets. In technical authoring and publishing, our Adobe FrameMaker product faces competition from large-scale electronic publishing systems, XML-based publishing companies such as PTC, as well as lower-end desktop publishing products such as Microsoft Word. Competition is based on the quality and features of products, the level of customization and integration with other publishing system components, the number of hardware platforms supported, service and price. We believe we can successfully compete based upon the quality and features of the Adobe FrameMaker product and our extensive application programming interface.
In desktop publishing, our Adobe PageMaker product faces competition from other software products, including Microsoft Publisher. Competition is based on the quality and features of products, ease-of-use, printer service support and price. We believe we have a strong product and can successfully compete with these types of applications based upon the quality and features of the Adobe PageMaker product, its strong brand among users and its widespread adoption among printer service bureaus.
In printing technologies, we believe the principal competitive factors for OEMs in selecting a page description language or a printing technology are product capabilities, market leadership, reliability, price, support and engineering development assistance. We believe that our competitive advantages include our technology competency, OEM customer relationships and our intellectual property portfolio. Adobe PostScript faces competition from Hewlett-Packard's proprietary PCL page description language and from developers of other page description languages based on the PostScript language standard, including Global Graphics and Zoran. In addition, Microsoft's XPS document format competes with Adobe PDF and our Adobe PostScript technologies and solutions.
In the rapid eLearning authoring market, our Adobe Captivate product faces competition from general content development tools such as Microsoft PowerPoint, screen recording tools such as Techsmith's Camtasia and more advanced eLearning and software simulation solutions such as Firefly, Lectora and Articulate. Competition in this market is based on speed of development and completeness of the features of products, ease-of-use and price. We believe our product can successfully compete based upon the strength of its broad range of features, its strong brand among users and its widespread adoption among training developers.
In Web content management, our Adobe Contribute product faces competition from solutions that provide for the simple creation of blogs and "Wikis," as well as basic content publishing products such as Microsoft Word, Microsoft FrontPage, Microsoft Notepad, basic HTML editors like ezHTMLArea and ekTron, content management tools like Microsoft SharePoint and, large-scale Web content management systems from companies such as Interwoven, Vignette, IBM and Oracle. Competition in this market is based on usability, quality and features of products, the level of customization and integration with other Web content management components, the integration with Web design tools, the number of hardware platforms supported, service and price. We believe we can successfully compete based upon the usability and price of Adobe Contribute, its strong brand among users and integration with other Web content management components.
In multimedia content authoring, our Adobe Director product faces competition from a variety of multimedia content authoring tools. Competition is based on the quality and features of products, ease-of-use and price. We believe we have a strong product and can successfully compete based upon the quality and features of the Adobe Director product, its strong brand among users, its widespread adoption among content developers and publishers and the widespread proliferation of the Shockwave Player.
In technical Web authoring and publishing, our Adobe RoboHelp product faces competition from large-scale Web publishing systems, XML-based Web publishing companies, as well as lower-end publishing products such as Microsoft Word. Competition is based on the quality and features of products, the level of customization and integration with other publishing system components, service and price. We believe we can successfully compete based upon the quality and features of the Adobe RoboHelp product.
OPERATIONS
Marketing and Sales
We market and distribute our products through sales channels, which include distributors, retailers, software developers, systems integrators, ISVs and VARs, as well as through OEM and hardware bundle customers. We also market and license our products directly using our sales force and through our own Website at www.adobe.com.
30
TABLE OF CONTENTS
We support our worldwide distribution network and end user customers with international offices around the world, including locations in Australia, Austria, Belgium, Brazil, Canada, China, Czech Republic, Denmark, Dubai, Finland, France, Germany, India, Ireland, Italy, Japan, Korea, Mexico, Moldova, the Netherlands, Norway, Poland, Portugal, Romania, Russia, Singapore, South Africa, Spain, Sweden, Switzerland, Taiwan, Turkey and the United Kingdom.
We also license software with maintenance and support, which includes rights to upgrades, when and if available, support, updates and enhancements.
The table below lists our significant customers, as a percentage of net revenue for fiscal 2009, 2008 and 2007. As listed, our significant customers are distributors who sell products across our various segments.
2009 | 2008 | 2007 | ||||||||||
Ingram Micro | 15 | % | 18 | % | 21 | % | ||||||
Tech Data | 8 | % | 9 | % | 10 | % | ||||||
We have multiple non-exclusive, independently negotiated distribution agreements with Ingram Micro and Tech Data and their subsidiaries covering our arrangements in specified countries and regions. Each of these contracts has an independent duration, is independent of any other agreement (such as a master distribution agreement) and any termination of one agreement does not affect the status of any of the other agreements.
Receivables from our significant distributors, as a percentage of gross trade receivables for fiscal 2009 and 2008 were as follows:
2009 | 2008 | |||||||
Ingram Micro | 16 | % | 18 | % | ||||
Tech Data | 6 | % | 8 | % | ||||
Order Fulfillment for Physical Distribution
The procurement of the various components of packaged products, including CDs and printed materials, and the assembly of packages for retail and other applications products is controlled by our Supply Chain Operations organization. We outsource our production, inventory and fulfillment activities to third parties in the United States, Europe, Asia and Japan.
To date, we have not experienced significant difficulties in obtaining raw materials for the manufacture of our products or in the replication of CDs, printing and assembly of components.
The backlog of orders from customers is comprised of unfulfilled orders, excluding those associated with new product releases, those pending credit review and those not shipped due to the application of our global inventory policy. The backlog of orders from customers, as of January 15, 2010 and January 16, 2009, were approximately $5.4 million and $6.4 million, respectively.
Services and Support
We provide professional services, technical support and customer service to a wide variety of customers including consumers, creative professionals and business users. Our service and support revenue consists primarily of consulting fees, software maintenance and support fees and training fees.
Services
We have a global Professional Services team dedicated to developing and implementing solutions for enterprise customers in key vertical markets and to transfer technical expertise to our solution partners. The Professional Services team uses a comprehensive, customer-focused methodology to develop high quality solutions, which in turn deliver a competitive advantage to our enterprise customers. A portfolio of technical training courses is also available for desktop and server-based products to meet the needs of our enterprise customers and solution partners.
Support
A significant portion of our support revenue is composed of our extended enterprise maintenance and support offerings, which entitles customers to the right to receive product upgrades and enhancements during the term of the maintenance and support period, which is typically one year. Regional Support Centers are charged with providing timely, high quality technical expertise on Enterprise and Knowledge Worker products and solutions to meet the growing needs of our customers.
31
TABLE OF CONTENTS
Our support revenue also includes support for our desktop products. We offer a range of support programs, from fee-based incidents to annual support contracts. Additionally, we provide extensive self-help and online technical support capabilities via the Web which allows customers quick and easy access to possible solutions. We provide product support through a combination of outsourced vendors and internal support centers.
We also offer Developer Support to partners and developer organizations. The Adobe Partner Connection Program focuses on providing developers with high-quality tools, software development kits, information and services.
As a registered owner of the current version of an Adobe desktop product, customers are eligible to receive Getting Started support on certain matters. Support for some products and in some countries may vary.
Training
We inform customers about the use of our products through on-line informational services on our Website (www.adobe.com) and through a growing series of how to books published by Adobe Press pursuant to a joint publishing agreement with Peachpit Press. In addition, we develop tests to certify independent trainers who teach Adobe software classes. We sponsor workshops, work with professional associations and user groups, and conduct regular beta testing programs.
Investments
We own a limited partnership interest in Adobe Ventures IV L.P. ("Adobe Ventures") that has invested in early stage companies with innovative technologies. We also make direct investments in privately-held companies. We enter into these investments with the intent of securing financial returns as well as for strategic purposes as they often increase our knowledge of emerging markets and technologies, as well as expand our opportunities to provide Adobe products and services. Adobe Ventures is managed by Granite Ventures, an independent venture capital firm and sole general partner of Adobe Ventures.
PRODUCT DEVELOPMENT
As the software industry is characterized by rapid technological change, a continuous high level of investment is required for the enhancement of existing products and services and the development of new products and services. We develop our software internally as well as acquire products or technology developed by others by purchasing the stock or assets of the business entity that held ownership rights to the technology. In other instances, we have licensed or purchased the intellectual property ownership rights of programs developed by others with license or technology transfer agreements that may obligate us to pay a flat license fee or royalties, typically based on a dollar amount per unit shipped or a percentage of the revenue generated by those programs.
During fiscal years ended November 27, 2009, November 28, 2008 and November 30, 2007, our research and development expenses were $565.1 million, $662.1 million and $613.2 million, respectively.
PRODUCT PROTECTION
We regard our software as proprietary and protect it under the laws of copyrights, patents, trademarks and trade secrets. We protect the source code of our software programs as trade secrets and make source code available to third parties only under limited circumstances and specific security and confidentiality constraints.
Our products are generally licensed to end users on a "right to use" basis pursuant to a license that restricts the use of the products to a designated number of devices. We also rely on copyright laws and on "shrink wrap" and electronic licenses that are not physically signed by the end user. Copyright protection may be unavailable under the laws of certain countries and the enforceability of "shrink wrap" and electronic licenses has not been conclusively determined in all jurisdictions. We also offer many products under a SaaS or on-demand model, where software is provided on demand to customers, generally through a Web browser. The use of these products is generally governed by terms of use associated with these products.
Policing unauthorized use of computer software is difficult and software piracy is a persistent problem for the software industry. This problem is particularly acute in international markets. We conduct vigorous anti-piracy programs directly and through certain external software associations. In addition, we have activation technology in certain products to guard against illegal use and will continue to do so in certain future products.
32
TABLE OF CONTENTS
EMPLOYEES
As of November 27, 2009, we employed 8,660 people. We have not experienced work stoppages and believe our employee relations are good.
AVAILABLE INFORMATION
Our Annual Report on Form 10-K, Quarterly Reports on Form 10-Q, Current Reports on Form 8-K and amendments to reports filed or furnished pursuant to Sections 13(a) and 15(d) of the Securities Exchange Act of 1934, as amended, are available free of charge on our Investor Relations Website at www.adobe.com as soon as reasonably practicable after we electronically file such material with, or furnish it to, the SEC. The information posted on our Website is not incorporated into this report.
EXECUTIVE OFFICERS
Adobe's executive officers as of January 15, 2010 are as follows:
Name | Age | Positions | ||
Shantanu Narayen | 46 | President and Chief Executive Officer | ||
Mark Garrett | 52 | Executive Vice President, Chief Financial Officer | ||
Karen O. Cottle | 60 | Senior Vice President, General Counsel and Corporate Secretary | ||
Joshua G. James | 36 | Senior Vice President, Omniture Business Unit | ||
Johnny Loiacono | 48 | Senior Vice President, Creative Solutions Business Unit | ||
Kevin Lynch | 43 | Senior Vice President, Chief Technology Officer | ||
Rob Tarkoff | 41 | Senior Vice President, Business Productivity Business Unit | ||
Matthew Thompson | 51 | Senior Vice President, Worldwide Field Operations | ||
Richard T. Rowley | 53 | Vice President, Principal Accounting Officer |
Mr. Narayen currently serves as Adobe's President and Chief Executive Officer. Mr. Narayen joined Adobe in January 1998 as Vice President and General Manager of Adobe's engineering technology group. In January 1999, he was promoted to Senior Vice President, Worldwide Products and in March 2001 he was promoted to Executive Vice President, Worldwide Product Marketing and Development. In January 2005, Mr. Narayen was promoted to President and Chief Operating Officer and in December 2007, he was appointed Chief Executive Officer of Adobe and joined the Adobe Board of Directors. Prior to joining Adobe, Mr. Narayen co-founded Pictra Inc., a digital photo sharing software company, in 1996. He was Director of Desktop and Collaboration products at Silicon Graphics Inc. before founding Pictra. Mr. Narayen is also a director of Dell Inc.
Mr. Garrett joined Adobe in February 2007 as Executive Vice President and Chief Financial Officer. Mr. Garrett served as Senior Vice President and Chief Financial Officer of the Software Group of EMC Corporation, a products, services and solutions provider for information management and storage, from June 2004 to January 2007, his most recent position since EMC's acquisition of Documentum, Inc., an enterprise content management company, in December 2003. Mr. Garrett first joined Documentum as Executive Vice President and Chief Financial Officer in 1997, holding that position through October 1999 and then re-joining Documentum as Executive Vice President and Chief Financial Officer in 2002. Mr. Garrett is also a director of Informatica Corporation.
Mr. James joined Adobe upon the closing of the acquisition of Omniture in October 2009 as Senior Vice President of the Omniture Business Unit. Prior to joining Adobe, Mr. James was one of the founders of Omniture and served as a director
33
TABLE OF CONTENTS
of Omniture from 1998 to October 2009 and as its Chief Executive Officer or President from 1996 to October 2009. From 1996 to 1998, Mr. James co-founded and co-managed several entities that were Omniture predecessors. Mr. James also served on the Brigham Young University eBusiness Advisory Board and is a Platinum Founder of the BYU Center for Entrepreneurship. He has lectured for numerous university classes and served on several other industry, advisory and private company boards.
Mr. Loiacono joined Adobe in April 2006 as Senior Vice President and General Manager of the Creative Solutions Business Unit. Prior to joining Adobe, Mr. Loiacono served as Executive Vice President of software at Sun Microsystems, Inc., which he joined in 1987. During Mr. Loiacono's 19 year tenure, he also served as General Manager of Sun Microsystems's operating platform group, as well as Chief Marketing Officer.
Mr. Lynch currently serves as Adobe's Chief Technology Officer and Senior Vice President of the Experience & Technology Organization. Mr. Lynch joined Adobe as Chief Software Architect and Senior Vice President for Adobe's Platform Business Unit through our acquisition of Macromedia, Inc. in December 2005. At Macromedia, Mr. Lynch served as Chief Software Architect and President of Product Development, where he led Macromedia in advancing Web software including managing the initial development of Macromedia Dreamweaver and guiding Flash to its current widespread adoption across the Web. Prior to Macromedia, Mr. Lynch participated in a variety of technical and management roles in startups including Frame Technology and General Magic.
Mr. Tarkoff currently serves as Adobe's Senior Vice President of the Business Productivity Business Unit. Mr. Tarkoff joined Adobe in April 2007 as Senior Vice President of Corporate Development. Prior to joining Adobe, Mr. Tarkoff was Senior Vice President and General Manager of the Captiva Software Division and Senior Vice President of Business Development and Channels for the Software Group of EMC Corporation, a products, services and solutions provider for information management and storage, from December 2003 to April 2007. Previously, Mr. Tarkoff was Executive Vice President and Chief Strategy Officer for Documentum, Inc., an enterprise content management company and Senior Vice President of Worldwide Business Development at Commerce One, a provider of business-to-business e-commerce solutions.
Mr. Thompson joined Adobe in January 2006 as Senior Vice President, Worldwide Field Operations. Prior to joining Adobe, Mr. Thompson served as Senior Vice President of Worldwide Sales at Borland Software Corporation, a software delivery optimization solutions provider, from October 2003 to December 2006. Prior to joining Borland, Mr. Thompson was Vice President of Worldwide Sales and Field Operations for Marimba, Inc., a provider of products and services for software change and configuration management, from February 2001 to January 2003. From July 2000 to January 2001, Mr. Thompson was Vice President of Worldwide Sales for Calico Commerce, Inc., a provider of eBusiness applications. Prior to joining Calico, Mr. Thompson spent six years at Cadence Design Systems, Inc., a provider of electronic design technologies. While at Cadence, from January 1998 to June 2000, Mr. Thompson served as Senior Vice President, Worldwide Sales and Field Operations and from April 1994 to January 1998 as Vice President, Worldwide Professional Services.
Mr. Rowley joined Adobe in November 2006 as Vice President, Corporate Controller and Principal Accounting Officer. Prior to joining Adobe, Mr. Rowley served as Vice President, Corporate Controller, Treasurer and Principal Accounting Officer at Synopsys, Inc., a semiconductor design software company, from December 2002 to September 2005 and from 1999 to December 2002, Mr. Rowley served as Vice President, Corporate Controller and Principal Accounting Officer. From 1994 to 1999, Mr. Rowley served in several finance-related positions at Synopsys. Mr. Rowley is a certified public accountant.
ITEM 1A. RISK FACTORS
As previously discussed, our actual results could differ materially from our forward-looking statements. Factors that might cause or contribute to such differences include, but are not limited to, those discussed below. These and many other factors described in this report could adversely affect our operations, performance and financial condition.
The ongoing economic downturn and continued uncertainty in the financial markets and other adverse changes in general economic or political conditions in any of the major countries in which we do business could adversely affect our operating results.
As our business has grown, we have become increasingly subject to the risks arising from adverse changes in domestic and global economic and political conditions. Uncertainty about future economic and political conditions makes it difficult for us to forecast operating results and to make decisions about future investments. For example, the direction and relative strength of the global economy continues to be uncertain due to softness in the real estate and mortgage markets, volatility in
34
TABLE OF CONTENTS
fuel and other energy costs, difficulties in the financial services sector and credit markets, continuing geopolitical uncertainties, increasing unemployment and other macro-economic factors affecting spending behavior. If economic growth in the U.S. and other countries continues to be slow and does not improve, many customers may delay or reduce technology purchases, advertising spending or marketing spending. This could result in continued reductions in sales of our products and services, longer sales cycles, slower adoption of new technologies and increased price competition.
The current global financial crisis affecting the banking system and financial markets and the possibility that financial institutions may consolidate or go out of business have resulted in a tightening in the credit markets, a low level of liquidity in many financial markets, and increased volatility in fixed income, credit, currency and equity markets. There could be a number of follow-on effects from the credit crisis on our business, including insolvency of certain of our key distributors, resellers, OEMs, retailers and systems integrators, ISVs and VARs (collectively referred to as "distributors"), which could impair our distribution channels, inability of customers, including our distributors, to obtain credit to finance purchases of our products and services, and failure of derivative counterparties and other financial institutions, which could negatively impact our treasury operations. Other income and expense could also vary from expectations depending on gains or losses realized on the sale or exchange of financial instruments, impairment charges related to investment securities as well as equity and other investments, interest rates, cash balances, and changes in fair value of derivative instruments. Any of these events would likely harm our business, results of operations and financial condition.
Political instability in any of the major countries we do business in would also likely harm our business, results of operations and financial condition.
If we cannot continue to develop, market and distribute new products and services or upgrades or enhancements to existing products and services that meet customer requirements, our operating results could suffer.
The process of developing new high technology products and services and enhancing existing products and services is complex, costly and uncertain, and any failure by us to anticipate customers' changing needs and emerging technological trends accurately could significantly harm our market share and results of operations. We must make long-term investments, develop or obtain appropriate intellectual property and commit significant resources before knowing whether our predictions will accurately reflect customer demand for our products and services. Our inability to extend our core technologies into new applications and new platforms, including the mobile and embedded devices market, and to anticipate or respond to technological changes could affect continued market acceptance of our products and services and our ability to develop new products and services. Additionally, any delay in the development, production, marketing or distribution of a new product or service or upgrade or enhancement to an existing product or service could cause a decline in our revenue, earnings or stock price and could harm our competitive position. We maintain strategic relationships with third parties with respect to the distribution of certain of our technologies. If we are unsuccessful in establishing or maintaining our strategic relationships with these third parties, our ability to compete in the marketplace or to grow our revenues would be impaired and our operating results would suffer.
We offer our desktop application-based products primarily on Windows and Macintosh platforms. We generally offer our server-based products on the Linux platform as well as the Windows and UNIX platforms. To the extent that there is a slowdown of customer purchases of personal computers on either the Windows or Macintosh platform or in general, or to the extent that significant demand arises for our products or competitive products on other platforms before we choose and are able to offer our products on these platforms our business could be harmed. Additionally, to the extent that we have difficulty transitioning product or version releases to new Windows and Macintosh operating systems, or to the extent new releases of operating systems or other third-party products make it more difficult for our products to perform, our business could be harmed.
Introduction of new products, services and business models by existing and new competitors could harm our competitive position and results of operations.
The markets for our products and services are characterized by intense competition, evolving industry standards and business models, disruptive software and hardware technology developments, frequent new product and service introductions, short product and service life cycles, price cutting, with resulting downward pressure on gross margins, and price sensitivity on the part of consumers. Our future success will depend on our ability to enhance our existing products and services, introduce new products and services on a timely and cost-effective basis, meet changing customer needs, extend our core technology into new applications, and anticipate and respond to emerging standards, business models, software delivery
35
TABLE OF CONTENTS
methods and other technological changes. For example, certain versions of Microsoft Windows operating systems contain a fixed document format, XPS, which competes with Adobe PDF. Additionally, certain versions of Microsoft Office offer a feature to save Microsoft Office documents as PDF files, which competes with Adobe PDF creation. Microsoft Expression Studio competes with our Adobe Creative Suite family of products and Microsoft Silverlight and Visual Studio, Web development tools for RIAs, compete with Adobe Flash, Adobe Flex and Adobe AIR. Google Gears and Sun's JavaFX, alternative approaches to deploying RIAs, compete with Adobe Flash and Adobe AIR. Additionally, HTML5 specifies scripting application programming interfaces which if broadly implemented in browsers could compete with Adobe Flash. Companies, such as Google, Sun, Apple and Microsoft, may introduce competing software offerings for free or open source vendors may introduce competitive products. In addition, recent advances in computing and communications technologies have made the SaaS, or on-demand, business model viable. SaaS allows companies to provide applications, data and related services over the Internet. Providers use primarily advertising or subscription-based revenue models. We are developing and deploying our own SaaS strategies through various business units, including our Omniture business unit, but there are significant competitors in this area as well. For instance, our Omniture Online Marketing Suite competes with Google Analytics, which Google offers free of charge, and other competitive SaaS offerings from companies such as Coremetrics, Yahoo! and WebTrends. If any competing products or services in these areas achieve widespread acceptance, our operating results could suffer. In addition, consolidation has occurred among some of the competitors in our markets. Any further consolidations among our competitors may result in stronger competitors and may therefore harm our results of operations. For additional information regarding our competition and the risks arising out of the competitive environment in which we operate, see the section entitled "Competition" contained in Item 1 of this report.
If we fail to successfully manage transitions to new business models and markets, our results of operations could be negatively impacted.
We plan to release numerous new product and service offerings and employ new software delivery methods in connection with our transition to new business models. It is uncertain whether these strategies will prove successful or that we will be able to develop the infrastructure and business models as quickly as our competitors. Market acceptance of these new product and service offerings will be dependent on our ability to include functionality and usability in such releases that address certain customer requirements with which we have limited prior experience and operating history. Some of these new product and service offerings could subject us to increased risk of legal liability related to the provision of services as well as cause us to incur significant technical, legal or other costs. For example, with our introduction of on-demand services, we are entering a market that is at an early stage of development. Market acceptance of such services is affected by a variety of factors, including security reliability of on-demand services, customers concerns with entrusting a third party to store and manage their data, public concerns regarding privacy and the enactment of laws or regulations that restrict our ability to provide such services to customers in the U.S. or internationally. As our business continues to transition to new business models that may be more highly regulated for privacy and data security, and to countries outside the U.S. that have more strict data protection laws, our liability exposure, compliance requirements and costs may increase. In addition, laws in the areas of privacy and behavioral tracking and advertising are likely to be passed in the future, which could result in significant limitations on or changes to the ways in which we can collect, use, store or transmit the personal information of our customers or employees, communicate with our customers, and deliver products and services. Further, any perception of our practices as an invasion of privacy, whether or not illegal, may subject us to public criticism. Existing and potential future privacy laws, increased risks related to unauthorized data disclosures and increasing sensitivity of consumers to use of personal information may create negative public relations related to our business practices.
Additionally, customer requirements for open standards or open source products could impact adoption or use with respect to some of our products or services. To the extent we incorrectly estimate customer requirements for such products or services or if there is a delay in market acceptance of such products or services, our business could be harmed.
From time to time we open source certain of our technology initiatives, provide broader open access to certain of our technology, such as our OSP, and release selected technology for industry standardization. These changes may have negative revenue implications and make it easier for our competitors to produce products or services similar to ours. If we are unable to respond to these competitive threats, our business could be harmed.
36
TABLE OF CONTENTS
We are also devoting significant resources to the development of technologies and service offerings in markets where we have a limited operating history, including the enterprise, government and mobile and device markets. In the enterprise and government markets, we intend to increase our focus on vertical markets such as education, financial services, manufacturing, and the architecture, engineering and construction markets and horizontal markets such as training and marketing. These new offerings and markets require a considerable investment of technical, financial and sales resources, and a scalable organization. Many of our competitors may have advantages over us due to their larger presence, larger developer network, deeper experience in the enterprise, government and mobile and device markets, and greater sales and marketing resources. In the mobile and device markets, our intent is to partner with device makers, manufacturers and telecommunications carriers to embed our technology on their platforms, and in the enterprise and government market our intent is to form strategic alliances with leading enterprise and government solutions and service providers to provide additional resources to further enable penetration of such markets. If we are unable to successfully enter into strategic alliances with device makers, manufacturers, telecommunication carriers and leading enterprise and government solutions and service providers, or if they are not as productive as we anticipate, our market penetration may not proceed as rapidly as we anticipate and our results of operations could be negatively impacted.
Revenue from our new businesses may be difficult to predict.
As previously discussed, we are devoting significant resources to the development of product and service offerings where we have a limited operating history. This makes it difficult to predict revenue and revenue may decline quicker than anticipated. Additionally, we have a limited history of licensing products and offering services in certain markets such as the government and enterprise market and may experience a number of factors that will make our revenue less predictable, including longer than expected sales and implementation cycles, decision to open source certain of our technology initiatives, potential deferral of revenue due to multiple-element revenue arrangements and alternate licensing arrangements. If any of our assumptions about revenue from our new businesses prove incorrect, our actual results may vary materially from those anticipated, estimated or projected.
For instance, the SaaS business model we utilize in our Omniture business unit typically involves selling services on a subscription basis pursuant to service agreements that are generally one to three years in length. Although many of our service agreements contain automatic renewal terms, our customers have no obligation to renew their subscriptions for our services after the expiration of their initial subscription period upon providing timely notice of non-renewal and we cannot provide assurance that these subscriptions will be renewed at the same or higher level of service, if at all. Moreover, under some circumstances, some of our customers have the right to cancel their service agreements prior to the expiration of the terms of their agreements. We cannot be assured that we will be able to accurately predict future customer renewal rates. Our customers' renewal rates may decline or fluctuate as a result of a number of factors, including their satisfaction or dissatisfaction with our services, the prices of our services, the prices of services offered by our competitors, mergers and acquisitions affecting our customer base, reductions in our customers' spending levels, or declines in consumer Internet activity as a result of economic downturns or uncertainty in financial markets. If our customers do not renew their subscriptions for our services or if they renew on less favorable terms to us, our revenues may decline.
We may not realize the anticipated benefits of past or future acquisitions, and integration of these acquisitions may disrupt our business and management.
We have in the past and may in the future acquire additional companies, products or technologies. Most recently, we completed the acquisition of Omniture in October 2009. We may not realize the anticipated benefits of an acquisition and each acquisition has numerous risks. These risks include:
| · | difficulty in assimilating the operations and personnel of the acquired company; |
| · | difficulty in effectively integrating the acquired technologies, products or services with our current technologies, products or services; |
| · | difficulty in maintaining controls, procedures and policies during the transition and integration; |
· | entry into markets in which we have no or limited direct prior experience and where competitors in such markets have stronger market positions; |
37
TABLE OF CONTENTS
| · | disruption of our ongoing business and distraction of our management and employees from other opportunities and challenges; |
| · | difficulty integrating the acquired company's accounting, management information, human resources and other administrative systems; |
| · | inability to retain key technical and managerial personnel of the acquired business; |
| · | inability to retain key customers, distributors, vendors and other business partners of the acquired business; |
| · | inability to achieve the financial and strategic goals for the acquired and combined businesses; |
| · | inability to take advantage of anticipated tax benefits as a result of unforeseen difficulties in our integration activities; |
| · | incurring acquisition-related costs or amortization costs for acquired intangible assets that could impact our operating results; |
| · | potential additional exposure to fluctuations in currency exchange rates; |
| · | potential impairment of our relationships with employees, customers, partners, distributors or third-party providers of our technologies, products or services; |
| · | potential failure of the due diligence processes to identify significant problems, liabilities or other shortcomings or challenges of an acquired company or technology, including but not limited to, issues with the acquired company's intellectual property, product quality or product architecture, data back-up and security, revenue recognition or other accounting practices, employee, customer or partner issues or legal and financial contingencies; |
| · | exposure to litigation or other claims in connection with, or inheritance of claims or litigation risk as a result of, an acquisition, including but not limited to, claims from terminated employees, customers, former stockholders or other third-parties; |
| · | incurring significant exit charges if products or services acquired in business combinations are unsuccessful; |
| · | potential inability to assert that internal controls over financial reporting are effective; |
| · | potential inability to obtain, or obtain in a timely manner, approvals from governmental authorities, which could delay or prevent such acquisitions; |
| · | potential delay in customer and distributor purchasing decisions due to uncertainty about the direction of our product and service offerings; and |
| · | potential incompatibility of business cultures. |
Mergers and acquisitions of high technology companies are inherently risky, and ultimately, if we do not complete an announced acquisition transaction or integrate an acquired business successfully and in a timely manner, we may not realize the benefits of the acquisition to the extent anticipated.
We may incur substantial costs enforcing or acquiring intellectual property rights and defending against third-party claims as a result of litigation or other proceedings.
In connection with the enforcement of our own intellectual property rights, the acquisition of third-party intellectual property rights, or disputes relating to the validity or alleged infringement of third-party intellectual property rights, including patent rights, we have been, are currently and may in the future be subject to claims, negotiations or complex, protracted litigation. Intellectual property disputes and litigation are typically very costly and can be disruptive to our business operations by diverting the attention and energies of management and key technical personnel. Although we have successfully defended or resolved past litigation and disputes, we may not prevail in any ongoing or future litigation and disputes. Third-party intellectual property disputes could subject us to significant liabilities, require us to enter into royalty and licensing arrangements on unfavorable terms, prevent us from licensing certain of our products or offering certain of our services, subject us to injunctions restricting our sale of products or services, cause severe disruptions to our operations or the markets in which we compete, or require us to satisfy indemnification commitments with our customers including contractual
38
TABLE OF CONTENTS
provisions under various license arrangements and service agreements. In addition, we may incur significant costs in acquiring the necessary third-party intellectual property rights for use in our products. Any of these could seriously harm our business.
We may not be able to protect our intellectual property rights, including our source code, from third-party infringers, or unauthorized copying, use or disclosure.
Although we defend our intellectual property rights and combat unlicensed copying and use of software and intellectual property rights through a variety of techniques, preventing unauthorized use or infringement of our rights is inherently difficult. We actively pursue software pirates as part of our enforcement of our intellectual property rights, but we nonetheless lose significant revenue due to illegal use of our software. If piracy activities increase, it may further harm our business.
Additionally, we take significant measures to protect the secrecy of our confidential information and trade secrets, including our source code. If unauthorized disclosure of our source code occurs, we could potentially lose future trade secret protection for that source code. The loss of future trade secret protection could make it easier for third-parties to compete with our products by copying functionality, which could adversely affect our revenue and operating margins. We also seek to protect our confidential information and trade secrets through the use of non-disclosure agreements with our customers, contractors, vendors, and partners. However there is a risk that our confidential information and trade secrets may be disclosed or published without our authorization, and in these situations it may be difficult and/or costly for us to enforce our rights.
Security vulnerabilities in our products and systems could lead to reduced revenues or to liability claims.
Maintaining the security of computers and computer networks is a critical issue for us and our customers. Hackers develop and deploy viruses, worms, and other malicious software programs that attack our products and systems. Although this is an industry-wide problem that affects computers and products across all platforms, it affects our products in particular because hackers tend to focus their efforts on the most popular operating systems and programs and we expect them to continue to do so. Critical vulnerabilities have been identified in certain of our products. These vulnerabilities could cause the application to crash and could potentially allow an attacker to take control of the affected system.
We devote significant resources to address security vulnerabilities through engineering more secure products, enhancing security and reliability features in our products and systems, code hardening, deploying security updates to address security vulnerabilities and improving our incident response time. The cost of these steps could reduce our operating margins. Despite these efforts, actual or perceived security vulnerabilities in our products and systems may lead to claims against us and harm our reputation, and could lead some customers to seek to return products, to stop using certain services, to reduce or delay future purchases of products or services, or to use competing products or services. Customers may also increase their expenditures on protecting their existing computer systems from attack, which could delay adoption of new technologies. Any of these actions by customers could adversely affect our revenue.
Some of our businesses rely on us or third-party service providers to host and deliver services, and any interruptions or delays in our service or service from these third parties, security or privacy breaches, or failures in data collection could expose us to liability and harm our business and reputation.
Some of our businesses, including our Omniture business unit, rely on hosted services from us or third parties. Because we hold large amounts of customer data and host certain of such data in third-party facilities, a security incident may compromise the integrity or availability of customer data, or customer data may be exposed to unauthorized access. Unauthorized access to customer data may be obtained through break-ins, breach of our secure network by an unauthorized party, employee theft or misuse, or other misconduct. It is also possible that unauthorized access to customer data may be obtained through inadequate use of security controls by customers. While strong password controls, IP restriction and account controls are provided and supported, their use is controlled by the customer. For example, this could allow accounts to be created with weak passwords, which could result in allowing an attacker to gain access to customer data. Additionally, failure by customers to remove accounts of their own employees, or granting of accounts by the customer in an uncontrolled manner, may allow for access by former or unauthorized customer employees. If there were ever an inadvertent disclosure of personally identifiable information, or if a third party were to gain unauthorized access to the personally identifiable information we possess, our operations could be disrupted, our reputation could be harmed and we could be subject to claims
39
TABLE OF CONTENTS
or other liabilities. In addition, such perceived or actual unauthorized disclosure of the information we collect or breach of our security could result in the loss of customers and harm our business.
Because of the large amount of data that we collect and manage on behalf of our customers, it is possible that hardware failures or errors in our systems could result in data loss or corruption or cause the information that we collect to be incomplete or contain inaccuracies that our customers regard as significant. Furthermore, our ability to collect and report data may be delayed or interrupted by a number of factors, including access to the Internet, the failure of our network or software systems, security breaches or significant variability in visitor traffic on customer Websites. In addition, computer viruses may harm our systems causing us to lose data, and the transmission of computer viruses could expose us to litigation. We may also find, on occasion, that we cannot deliver data and reports to our customers in near real time because of a number of factors, including significant spikes in consumer activity on their Websites or failures of our network or software. We may be liable to our customers for damages they may incur resulting from these events, such as loss of business, loss of future revenues, breach of contract or for the loss of goodwill to their business. In addition to potential liability, if we supply inaccurate information or experience interruptions in our ability to capture, store and supply information in near real time or at all, our reputation could be harmed and we could lose customers.
On behalf of certain of our customers using our services, including those using services offered by our Omniture business unit, we collect and use information derived from the activities of Website visitors, which may include anonymous and/or personal information. This enables us to provide such customers with reports on aggregated anonymous or personal information from and about the visitors to their Websites in the manner specifically directed by such customers. Federal, state and foreign government bodies and agencies have adopted or are considering adopting laws regarding the collection, use and disclosure of this information. Therefore, our compliance with privacy laws and regulations and our reputation among the public body of Website visitors depend on such customers' adherence to privacy laws and regulations and their use of our services in ways consistent with such visitors' expectations. We also rely on representations made to us by customers that their own use of our services and the information we provide to them via our services do not violate any applicable privacy laws, rules and regulations or their own privacy policies. We ask customers to represent to us that they provide their Website visitors the opportunity to "opt-out" of the information collection associated with our services, as applicable. We do not formally audit such customers to confirm compliance with these representations. If these representations are false or if such customers do not otherwise comply with applicable privacy laws, we could face potentially adverse publicity and possible legal or other regulatory action.
Failure to manage our sales and distribution channels and third-party customer service and technical support providers effectively could result in a loss of revenue and harm to our business.
A significant amount of our revenue for application products is from two distributors, Ingram Micro, Inc. and Tech Data Corporation, which represented 15% and 8% of our net revenue for fiscal 2009, respectively. We have multiple non-exclusive, independently negotiated distribution agreements with Ingram Micro and Tech Data and their subsidiaries covering our arrangements in specified countries and regions. Each of these contracts has an independent duration, is independent of any other agreement (such as a master distribution agreement) and any termination of one agreement does not affect the status of any of the other agreements. In fiscal 2009, no single agreement with these distributors was responsible for over 10% of our total net revenue. If any one of our agreements with these distributors were terminated, we believe we could make arrangements with new or existing distributors to distribute our products without a substantial disruption to our business; however, any prolonged delay in securing a replacement distributor could have a negative short-term impact on our results of operations.
Successfully managing our indirect channel efforts to reach various potential customer segments for our products and services is a complex process. Our distributors are independent businesses that we do not control. Notwithstanding the independence of our channel partners, we face potential legal risk from the activities of these third parties including, but not limited to, export control violations, corruption and anti-competitive behavior. Although we have undertaken efforts to reduce these third-party risks, they remain present. We cannot be certain that our distribution channel will continue to market or sell our products effectively. If we are not successful, we may lose sales opportunities, customers and revenues.
Our distributors also sell our competitors' products, and if they favor our competitors' products for any reason, they may fail to market our products as effectively or to devote resources necessary to provide effective sales, which would cause our results to suffer. We also distribute some products through our OEM channel, and if our OEMs decide not to bundle our applications on their devices, our results could suffer.
40
TABLE OF CONTENTS
In addition, the financial health of our distributors and our continuing relationships with them are important to our success. Some of these distributors may be unable to withstand adverse changes in current economic conditions, which could result in insolvency of certain of our distributors and/or the inability of our distributors to obtain credit to finance purchases of our products. In addition, weakness in the end-user market could further negatively affect the cash flow of our distributors who could, in turn, delay paying their obligations to us, which would increase our credit risk exposure. Our business could be harmed if the financial condition of some of these distributors substantially weakens and we were unable to timely secure replacement distributors.
We also sell certain of our products and services through our direct sales force. Risks associated with this sales channel include a longer sales cycle associated with direct sales efforts, difficulty in hiring, retaining and motivating our direct sales force, and substantial amounts of training for sales representatives, including regular updates to cover new and upgraded products and services. Moreover, our recent hires and sales personnel added through our recent business acquisitions may not become as productive as we would like, as in most cases it takes a significant period of time before they achieve full productivity. Our business could be seriously harmed if these expansion efforts do not generate a corresponding significant increase in revenues and we are unable to achieve the efficiencies we anticipate.
We also provide products and services, directly and indirectly, to a variety of governmental entities, both domestically and internationally. The licensing and sale of products and services to governmental entities may require adherence to complex specific procurement regulations and other requirements. While we believe we have adequate controls in this area, failure to effectively manage this complexity and satisfy these requirements could result in the potential assessment of penalties and fines, harm to our reputation and lost sales opportunities to such governmental entities.
We outsource a substantial portion of our customer service and technical support activities to third-party service providers. We rely heavily on these third-party customer service and technical support representatives working on our behalf and we expect to continue to rely heavily on third parties in the future. This strategy provides us with lower operating costs and greater flexibility, but also presents risks to our business, including the possibilities that we may not be able to impact the quality of support that we provide as directly as we would be able to do in our own company-run call centers, and that our customers may react negatively to providing information to, and receiving support from, third-party organizations, especially if based overseas. If we encounter problems with our third-party customer service and technical support providers, our reputation may be harmed and our revenue may be adversely affected.
Catastrophic events may disrupt our business.
We are a highly automated business and rely on our network infrastructure and enterprise applications, internal technology systems and our Website for our development, marketing, operational, support, hosted services and sales activities. In addition, some of our businesses rely on third-party hosted services and we do not control the operation of third-party data center facilities serving our customers from around the world, which increases our vulnerability. A disruption, infiltration or failure of these systems or third party hosted services in the event of a major earthquake, fire, power loss, telecommunications failure, cyber attack, war, terrorist attack, or other catastrophic event could cause system interruptions, reputational harm, loss of intellectual property, delays in our product development, lengthy interruptions in our services, breaches of data security and loss of critical data and could prevent us from fulfilling our customers' orders. Our corporate headquarters, a significant portion of our research and development activities, certain of our data centers, and certain other critical business operations are located in San Jose, California, which is near major earthquake faults. We have developed certain disaster recovery plans and certain backup systems to reduce the potentially adverse effect of such events, but a catastrophic event that results in the destruction or disruption of any of our data centers or our critical business or information technology systems could severely affect our ability to conduct normal business operations and, as a result, our future operating results could be adversely affected.
Net revenue, margin or earnings shortfalls or the volatility of the market generally may cause the market price of our stock to decline.
The market price for our common stock has experienced significant fluctuations and may continue to fluctuate significantly. The market price for our common stock may be affected by a number of factors, including shortfalls in our net revenue, margins, earnings or key performance metrics, changes in estimates or recommendations by securities analysts; the announcement of new products, product enhancements or service introductions by us or our competitors, seasonal variations
41
TABLE OF CONTENTS
in the demand for our products and services and the implementation cycles for our new customers, the loss of a large customer or our inability to increase sales to existing customers and attract new customers, quarterly variations in our or our competitors' results of operations, developments in our industry; unusual events such as significant acquisitions, divestitures and litigation, general socio-economic, regulatory, political or market conditions and other factors, including factors unrelated to our operating performance.
We are subject to risks associated with global operations which may harm our business.
We are a global business that generates over 50% of our total revenue from sales to customers outside of the Americas. This subjects us to a number of risks, including:
| · | foreign currency fluctuations; |
| · | changes in government preferences for software procurement; |
| · | international economic, political and labor conditions; |
| · | tax laws (including U.S. taxes on foreign subsidiaries); |
| · | increased financial accounting and reporting burdens and complexities; |
| · | unexpected changes in, or impositions of, legislative or regulatory requirements; |
| · | failure of laws to protect our intellectual property rights adequately; |
| · | inadequate local infrastructure and difficulties in managing and staffing international operations; |
| · | delays resulting from difficulty in obtaining export licenses for certain technology, tariffs, quotas and other trade barriers and restrictions; |
| · | transportation delays; |
| · | operating in locations with a higher incidence of corruption and fraudulent business practices; and |
| · | other factors beyond our control, including terrorism, war, natural disasters and diseases. |
If sales to any of our customers outside of the Americas are delayed or cancelled because of any of the above factors, our revenue may be negatively impacted.
In addition, approximately 42% of our employees are located outside the U.S. This means we have exposure to changes in foreign laws governing our relationships with our employees, including wage and hour laws and regulations, fair labor standards, unemployment tax rates, workers' compensation rates, citizenship requirements and payroll and other taxes, which likely would have a direct impact on our operating costs. We also intend to continue expansion of our international operations and international sales and marketing activities. Expansion in international markets has required, and will continue to require, significant management attention and resources. We may be unable to scale our infrastructure effectively, or as quickly as our competitors, in these markets and our revenues may not increase to offset these expected increases in costs and operating expenses, which would cause our results to suffer.
Moreover, as a global company, we are subject to varied and complex laws, regulations and customs domestically and internationally. These laws and regulations relate to a number of aspects of our business, including trade protection, import and export control, data and transaction processing security, records management, gift policies, employment and labor relations laws, securities regulations and other regulatory requirements affecting trade and investment. The application of these laws and regulations to our business is often unclear and may at times conflict. Compliance with these laws and regulations may involve significant costs or require changes in our business practices that result in reduced revenue and profitability. Non-compliance could also result in fines, damages, criminal sanctions against us, our officers, or our employees, prohibitions on the conduct of our business, and damage to our reputation. We incur additional legal compliance
42
TABLE OF CONTENTS
costs associated with our global operations and could become subject to legal penalties in foreign countries if we do not comply with local laws and regulations, which may be substantially different from those in the U.S. In many foreign countries, particularly in those with developing economies, it is common to engage in business practices that are prohibited by U.S. regulations applicable to us such as the Foreign Corrupt Practices Act. Although we implement policies and procedures designed to ensure compliance with these laws, there can be no assurance that all of our employees, contractors and agents, as well as those companies to which we outsource certain of our business operations, including those based in or from countries where practices which violate such U.S. laws may be customary, will not take actions in violation of our internal policies. Any such violation, even if prohibited by our internal policies, could have an adverse effect on our business.
We may incur losses associated with currency fluctuations and may not be able to effectively hedge our exposure.
Our operating results are subject to fluctuations in foreign currency exchange rates. We attempt to mitigate a portion of these risks through foreign currency hedging, based on our judgment of the appropriate trade-offs among risk, opportunity and expense. We have established a hedging program to partially hedge our exposure to foreign currency exchange rate fluctuations primarily for the Japanese Yen and the Euro. We regularly review our hedging program and make adjustments as necessary based on the judgment factors discussed above. Our hedging activities may not offset more than a portion of the adverse financial impact resulting from unfavorable movement in foreign currency exchange rates, which could adversely affect our financial condition or results of operations.
Changes in, or interpretations of, accounting principles could result in unfavorable accounting charges.
We prepare our consolidated financial statements in accordance with accounting principles generally accepted in the United States of America ("GAAP"). These principles are subject to interpretation by the SEC and various bodies formed to interpret and create appropriate accounting principles. A change in these principles can have a significant effect on our reported results and may even retroactively affect previously reported transactions. Our accounting principles that recently have been or may be affected by changes in the accounting principles are as follows:
| · | software and subscription revenue recognition; |
| · | accounting for stock-based compensation; |
| · | accounting for income taxes; and |
| · | accounting for business combinations and related goodwill. |
In December 2007, the Financial Accounting Standards Board ("FASB") issued revised standards for business combinations, which changes the accounting for business combinations including timing of the measurement of acquirer shares issued in consideration for a business combination, the timing of recognition and amount of contingent consideration, the accounting for pre-acquisition gain and loss contingencies, the recognition of capitalized in-process research and development, the accounting for acquisition related restructuring liabilities, the treatment of acquisition related transaction costs and the recognition of changes in the acquirer's income tax valuation allowance. The revised standards for business combinations is effective for financial statements issued for fiscal years beginning after December 15, 2008. The revised standards for business combinations are effective for us beginning the first quarter of fiscal 2010. We currently believe that the adoption of the revised standards for business combinations will result in the recognition of certain types of expenses in our results of operations that we currently capitalize pursuant to existing accounting standards.
If our goodwill or amortizable intangible assets become impaired we may be required to record a significant charge to earnings.
Under GAAP, we review our goodwill and amortizable intangible assets for impairment when events or changes in circumstances indicate the carrying value may not be recoverable. Goodwill is required to be tested for impairment at least annually. Factors that may be considered a change in circumstances indicating that the carrying value of our goodwill or amortizable intangible assets may not be recoverable include a decline in stock price and market capitalization, future cash flows, and slower growth rates in our industry. We may be required to record a significant charge to earnings in our financial statements during the period in which any impairment of our goodwill or amortizable intangible assets is determined, resulting in an impact on our results of operations. For example, our Mobile and Device Solutions business, which is reported
43
TABLE OF CONTENTS
as part of our Platform segment in fiscal 2009, is in an emerging market with high growth potential. In May 2008, we announced the OSP. As part of the project, we will be removing the license fees on the next major releases of Adobe Flash Player and Adobe AIR for devices. Revenue from this segment has begun to decrease. Although we would expect this decrease to be offset in time by an increased demand for tooling products, server technologies, hosted services and applications, if future revenue or revenue forecasts for our Platform segment do not meet our expectations, we may be required to record a charge to earnings reflecting an impairment of recorded goodwill or intangible assets.
Changes in, or interpretations of, tax rules and regulations may adversely affect our effective tax rates.
We are a U.S. based multinational company subject to tax in multiple U.S. and foreign tax jurisdictions. Unanticipated changes in our tax rates could affect our future results of operations. Our future effective tax rates could be unfavorably affected by changes in, or interpretation of, tax rules and regulations in the jurisdictions in which we do business, by unanticipated decreases in the amount of revenue or earnings in countries with low statutory tax rates, by lapses of the availability of the U.S. research and development tax credit, or by changes in the valuation of our deferred tax assets and liabilities.
In addition, we are subject to the continual examination of our income tax returns by the IRS and other domestic and foreign tax authorities, including a current examination by the IRS of our fiscal 2005, 2006 and 2007 tax returns. These examinations are expected to focus on our intercompany transfer pricing practices as well as other matters. We regularly assess the likelihood of outcomes resulting from these examinations to determine the adequacy of our provision for income taxes and have reserved for potential adjustments that may result from the current examination. We believe such estimates to be reasonable; however, there can be no assurance that the final determination of any of these examinations will not have an adverse effect on our operating results and financial position.
If we are unable to recruit and retain key personnel our business may be harmed.
Much of our future success depends on the continued service and availability of our senior management. These individuals have acquired specialized knowledge and skills with respect to Adobe. The loss of any of these individuals could harm our business. Our business is also dependent on our ability to retain, hire and motivate talented, highly skilled personnel. Experienced personnel in the information technology industry are in high demand and competition for their talents is intense, especially in the Bay Area, where many of our employees are located. We have relied on our ability to grant equity compensation as one mechanism for recruiting and retaining such highly skilled personnel. Accounting regulations requiring the expensing of equity compensation may impair our ability to provide these incentives without incurring significant compensation costs. Additionally, the recent significant adverse volatility in our stock price has resulted in many employees' stock option exercise prices exceeding the underlying stock's market value as well as deterioration in the value of employees' restricted stock units granted, thus lessening the effectiveness of retaining employees through stock-based awards. If we are unable to continue to successfully attract and retain key personnel, our business may be harmed. Effective succession planning is also a key factor for our long-term success. Our failure to enable the effective transfer of knowledge and facilitate smooth transitions with regards to our key employees could adversely affect our long-term strategic planning and execution.
We believe that a critical contributor to our success to date has been our corporate culture, which we believe fosters innovation and teamwork. As we grow, including from the integration of employees and businesses acquired in connection with our previous or future acquisitions, we may find it difficult to maintain important aspects of our corporate culture which could negatively affect our ability to retain and recruit personnel and otherwise adversely affect our future success.
Our investment portfolio may become impaired by deterioration of the capital markets.
Our cash equivalent and short-term investment portfolio as of November 27, 2009 consisted of US treasury securities, bonds of government agencies, obligations of foreign governments, corporate bonds and taxable money market mutual funds. We follow an established investment policy and set of guidelines to monitor and help mitigate our exposure to interest rate and credit risk. The policy sets forth credit quality standards and limits our exposure to any one issuer, as well as our maximum exposure to various asset classes.
As a result of current adverse financial market conditions, investments in some financial instruments may pose risks arising from recent market liquidity and credit concerns. As of November 27, 2009, we had no material impairment charges associated with our short-term investment portfolio relating to such adverse financial market conditions. Although we believe
44
TABLE OF CONTENTS
our current investment portfolio has very little risk of material impairment, we cannot predict future market conditions or market liquidity and can provide no assurance that our investment portfolio will remain materially unimpaired.
We may suffer losses from our equity investments which could harm our business.
We have investments and plan to continue to make future investments in privately held companies, many of which are considered in the start-up or development stages. These investments are inherently risky, as the market for the technologies or products these companies have under development is typically in the early stages and may never materialize. Our investment activities can impact our net income. Future price fluctuations in these securities and any significant long-term declines in value of any of our investments could reduce our net income in future periods.
We rely on turnkey assemblers and any adverse change in our relationship with our turnkey assemblers could result in a loss of revenue and harm our business.
We currently rely on seven turnkey assemblers of our products, with at least two turnkeys located in each major region we serve. If any significant turnkey assembler terminates its relationship with us, or if our supply from any significant turnkey assembler is interrupted or terminated for any other reason, we may not have enough time or be able to replace the supply of products replicated by that turnkey assembler to avoid serious harm to our business.
ITEM 1B. UNRESOLVED STAFF COMMENTS
None.
45
TABLE OF CONTENTS
ITEM 2. PROPERTIES
The following table sets forth the location, approximate square footage and use of each of the principal properties used by Adobe during fiscal 2009. We lease or sublease all of these properties with the exception of our property in India, where we own the building and lease the land, and San Francisco on Townsend and Waltham where we own the building and land. All properties are leased under operating leases. Such leases expire at various times through 2028, with the exception of the land lease that expires in 2091. The annual base rent expense (including operating expenses, property taxes and assessments, as applicable) for all facilities is currently approximately $84.8 million and is subject to annual adjustments as well as changes in interest rates.
Location | Approximate Square Footage | Use | |||||||
North America: | |||||||||
345 Park Avenue San Jose, CA 95110, USA | 378,000 | Research, product development, sales and marketing, and administration | |||||||
321 Park Avenue San Jose, CA 95110, USA | 321,000 | Research, product development, sales and marketing | |||||||
151 Almaden Boulevard San Jose, CA 95110, USA | 267,000 | Product development, sales and administration | |||||||
601 and 625 Townsend Street San Francisco, CA 94103, USA | 272,000 | * | Research, product development, sales, marketing and administration | ||||||
801 N. 34 th Street-Waterfront Seattle, WA 98103, USA | 182,000 | Product development, sales, technical support and administration | |||||||
550 East Timpanagos Circle Orem, UT 84097, USA | 135,000 | Research, product development, sales, marketing and administration | |||||||
10182 Telesis Court San Diego, CA 92121, USA | 61,000 | ** | Product development, sales and marketing | ||||||
21 Hickory Drive Waltham, MA 02451, USA | 108,000 | Research, product development, sales and marketing | |||||||
1-3 Riverside Center 275 Grove Street Newton, MA 02466, USA | 63,000 | *** | Research, product development, sales and marketing | ||||||
250 Brannan Street San Francisco, CA 94107, USA | 35,000 | Product development, sales and marketing | |||||||
13450 Sunrise Valley Drive Herndon, VA 20171,USA | 29,000 | Product development, sales and marketing | |||||||
343 Preston Street Ottawa, Ontario K1S 5N4, Canada | 122,000 | Research, product development, sales, marketing and administration | |||||||
India: | |||||||||
Adobe Towers, 1-1A, Sector 25A Noida, U.P. | 191,000 | Product development | |||||||
Adobe Towers, Plot #6, Sector 127 Expressway, Noida, U.P. | 65,000 | Product development | |||||||
Salapuria Infinity, 3rd Floor #5, Bannerghatta Road Bangalore | 94,000 | Research and product development | |||||||
46
TABLE OF CONTENTS
Location | Approximate Square Footage | Use |
Japan: | |||||||||
Gate City Ohsaki East Tower 1-11-2 Osaki, Shinagawa-ku Tokyo | 56,000 | Product development, sales and marketing | |||||||
China: | |||||||||
Block A, SP Tower, 21st & 22nd Floor Block D, SP Tower, 10th Floor Tsinghua Science Park, Yard 1 Zhongguancun Donglu, Haidian District Beijing | 77,000 | Research and product development | |||||||
Germany: | |||||||||
Grosse Elbstrasse 27 Hamburg 22767 | 36,000 | Research and product development | |||||||
Romania: | |||||||||
26 Z Timisoara Blvd, Anchor Plaza Lujerului, Sector 6 Bucharest | 44,000 | Research and product development | |||||||
UK: | |||||||||
3 Roundwood Avenue Stockley Park, Heathrow | 22,000 | Product development, sales, marketing and administration | |||||||
_________________________________________
* | The total square footage is 346,000, of which we occupy 272,000 square feet, or approximately 79% of this facility; 74,000 square feet is unoccupied basement space. |
** | The total square footage is 61,000, of which we occupy 21,000 square feet, or approximately 34% of this facility. The remaining square footage is subleased. |
*** | The total square footage is 63,000, of which we occupy 49,000 square feet, or approximately 78% of this facility. The remaining square footage is subleased. |
In general, all facilities are in good condition and are operating at an average capacity of approximately 80%.
ITEM 3. LEGAL PROCEEDINGS
On September 23, 2009, Richard Miner on behalf of himself and all similarly situated stockholders of Omniture, Inc. filed a class action lawsuit captioned Miner v. Omniture, Inc., et. al. , Case No. 090403559 (the "Miner Lawsuit") against Omniture, the members of Omniture's board of directors (collectively, the "Omniture Defendants") and Adobe in the United States Fourth Judicial District Court for Utah County, Provo Department, State of Utah seeking to enjoin the proposed acquisition between Omniture and Adobe. In the event the acquisition is consummated, the plaintiff seeks to recover an unspecified amount of damages. The plaintiff alleges that the members of Omniture's board of directors breached their fiduciary duties to Omniture's stockholders by failing to seek the highest possible price for Omniture and that Adobe induced or aided and abetted in the alleged breach of such fiduciary duties. Also on September 23, 2009, Christopher R. Barrell filed a substantially similar lawsuit to the Miner Lawsuit in the United States Fourth Judicial District Court for Utah County, Provo Department, State of Utah, captioned Barrell v. Omniture, Inc. et. al., Case No. 090403560 (the "Barrell Lawsuit"). The Barrell Lawsuit names the same defendants as the Miner Lawsuit, and also names Snowbird Acquisition Corporation as an additional defendant. Subsequently, on September 24, 2009, the plaintiff in the Barrell Lawsuit filed an amended complaint, which added allegations that the Schedule 14D-9 Solicitation/Recommendation Statement filed by Omniture on September 24, 2009 contained inadequate disclosures and was materially misleading. On September 25, 2009, the Omniture Defendants filed a motion requesting that the court consolidate the Barrell Lawsuit, Miner Lawsuit and a substantially similar
47
TABLE OF CONTENTS
lawsuit captioned Lodhia v. Omniture, Inc. et al., Case No. 090403499 (the "Lodhia Lawsuit") in which the Omniture Defendants, but not Adobe, were named. Additionally, on September 30, 2009, the plaintiff in the Lodhia Lawsuit filed a response to defendants' motion to consolidate, agreeing consolidation is appropriate, and also filed a motion seeking appointment as lead plaintiff in the consolidated action. Omniture moved for an order consolidating all three lawsuits. The plaintiffs in the three lawsuits filed a joint motion seeking preliminary injunction barring the consummation of the proposed acquisition and requiring additional disclosures by Omniture in its Schedule 14D-9. At a hearing on October 20, 2009, the court granted Omniture's motion to consolidate the three cases and denied the plaintiffs' motion for a preliminary injunction. On December 30, 2009, the plaintiffs served the defendants with a consolidated amended complaint. Adobe intends to defend the lawsuits vigorously.
In connection with our anti-piracy efforts, conducted both internally and through organizations such as the Business Software Alliance, from time to time we undertake litigation against alleged copyright infringers. Such lawsuits may lead to counter-claims alleging improper use of litigation or violation of other local laws. We believe we have valid defenses with respect to such counter-claims; however, it is possible that our consolidated financial position, cash flows or results of operations could be affected in any particular period by the resolution of one or more of these counter-claims.
From time to time, Adobe is subject to legal proceedings, claims and investigations in the ordinary course of business, including claims of alleged infringement of third-party patents and other intellectual property rights, commercial, employment and other matters. In accordance with GAAP, Adobe makes a provision for a liability when it is both probable that a liability has been incurred and the amount of the loss can be reasonably estimated. These provisions are reviewed at least quarterly and adjusted to reflect the impacts of negotiations, settlements, rulings, advice of legal counsel and other information and events pertaining to a particular case. Litigation is inherently unpredictable. However, we believe that we have valid defenses with respect to the legal matters pending against Adobe. It is possible, nevertheless, that our consolidated financial position, cash flows or results of operations could be negatively affected by an unfavorable resolution of one or more of such proceedings, claims or investigations.
ITEM 4. SUBMISSION OF MATTERS TO A VOTE OF SECURITY HOLDERS
No matters were submitted to a vote of security holders during the quarter ended November 27, 2009.
48
TABLE OF CONTENTS
PART II
ITEM 5. MARKET FOR REGISTRANT'S COMMON EQUITY, RELATED STOCKHOLDER MATTERS AND ISSUER PURCHASES OF EQUITY SECURITIES
Our common stock is traded on the NASDAQ Global Select Market under the symbol "ADBE." According to the records of our transfer agent, there were 1,709 holders of record of our common stock on January 15, 2010. Because many of such shares are held by brokers and other institutions on behalf of stockholders, we are unable to estimate the total number of stockholders represented by these record holders.
We did not declare or pay any cash dividends on our common stock during fiscal 2009 or fiscal 2008. Under the terms of our credit agreement and lease agreements, we are not prohibited from paying cash dividends unless payment would trigger an event of default or one currently exists. We do not anticipate paying any cash dividends in the foreseeable future. The following table sets forth the high and low sales price per share of our common stock for the periods indicated.
| Price Range | ||||||||
High | Low | |||||||
Fiscal 2009: | ||||||||
First Quarter | $ | 24.29 | $ | 16.70 | ||||
Second Quarter | $ | 28.18 | $ | 15.98 | ||||
Third Quarter | $ | 33.43 | $ | 26.34 | ||||
Fourth Quarter | $ | 36.90 | $ | 31.00 | ||||
Fiscal Year | $ | 36.90 | $ | 15.98 | ||||
Fiscal 2008: | ||||||||
First Quarter | $ | 44.62 | $ | 32.62 | ||||
Second Quarter | $ | 44.06 | $ | 30.79 | ||||
Third Quarter | $ | 45.89 | $ | 38.23 | ||||
Fourth Quarter | $ | 43.14 | $ | 20.75 | ||||
Fiscal Year | $ | 45.89 | $ | 20.75 | ||||
49
TABLE OF CONTENTS
Issuer Purchases of Equity Securities
Below is a summary of stock repurchases for the quarter ended November 27, 2009. See Note 14 of our Notes to Consolidated Financial Statements for information regarding our stock repurchase programs.
Plan/Period (1) |
| Shares Repurchased (2) | Average Price Per Share | Maximum Number of Shares that May Yet be Purchased Under the Plan | |||||||||
Stock Repurchase Program I | |||||||||||||
Beginning shares available to be repurchased as of August 28, 2009 | 131,855,184 | (3) | |||||||||||
August 29-September 25, 2009 | |||||||||||||
Structured repurchases | 1,842,160 | $ | 31.62 | ||||||||||
September 26-October 23, 2009 | |||||||||||||
Structured repurchases | 1,770,314 | $ | 32.73 | ||||||||||
October 24-November 27, 2009 | |||||||||||||
From employees (4) | 10 | $ | 34.78 | ||||||||||
Structured repurchases | 1,705,926 | $ | 33.88 | ||||||||||
Adjustments to repurchase authority for net dilution | - | 5,840,221 | (5) | ||||||||||
Total shares repurchased | 5,318,410 | (5,318,410 | ) | ||||||||||
Ending shares available to be repurchased under Program I as of November 27, 2009 | 132,376,995 | (6) | |||||||||||
________________________________________
(1) | In December 1997, our Board of Directors authorized Stock Repurchase Program I which is not subject to expiration. However, this repurchase program is limited to covering net dilution from stock issuances and is subject to business conditions and cash flow requirements as determined by our Board of Directors from time to time. |
(2) | All shares were purchased as part of publicly announced plans. |
(3) | Additional 109.0 million shares were issued for the acquisition of Macromedia which accounted for the majority of the repurchase authorization. |
(4) | The repurchases from employees represent shares cancelled when surrendered in lieu of cash payments for withholding taxes due. |
(5) | Adjustment of authority to reflect changes in the dilution from outstanding shares and options. |
(6) | The remaining authorization for the ongoing stock repurchase program is determined by combining all stock issuances, net of any cancelled, surrendered or exchanged shares less all stock repurchases under the ongoing plan, beginning in the first quarter of fiscal 1998. |
50
TABLE OF CONTENTS
Stock Performance Graph (*)
Five-Year Stockholder Return Comparison
The line graph below compares the cumulative stockholder return on our common stock with the cumulative total return of the Standard & Poor's 500 Index ("S&P 500") and the S&P 500 Software & Services Index for the five fiscal year periods ending November 27, 2009. The stock price information shown on the graph below is not necessarily indicative of future price performance.
The following table and graph assume that $100.00 was invested on December 3, 2004 in our common stock, the S&P 500 Index and the S&P 500 Software & Services Index, with reinvestment of dividends. For each reported year, our reported dates are the last trading dates of our fiscal year which ends on the Friday closest to November 30.
2004 | 2005 | 2006 | 2007 | 2008 | 2009 | |||||||||||||||||||
Adobe Systems | $ | 100.00 | $ | 111.13 | $ | 125.05 | $ | 133.91 | $ | 73.60 | $ | 112.43 | ||||||||||||
S&P 500 Index | $ | 100.00 | $ | 108.16 | $ | 121.69 | $ | 131.45 | $ | 81.83 | $ | 101.64 | ||||||||||||
S&P 500 Software & Services Index | $ | 100.00 | $ | 102.94 | $ | 107.51 | $ | 122.76 | $ | 70.42 | $ | 106.79 |
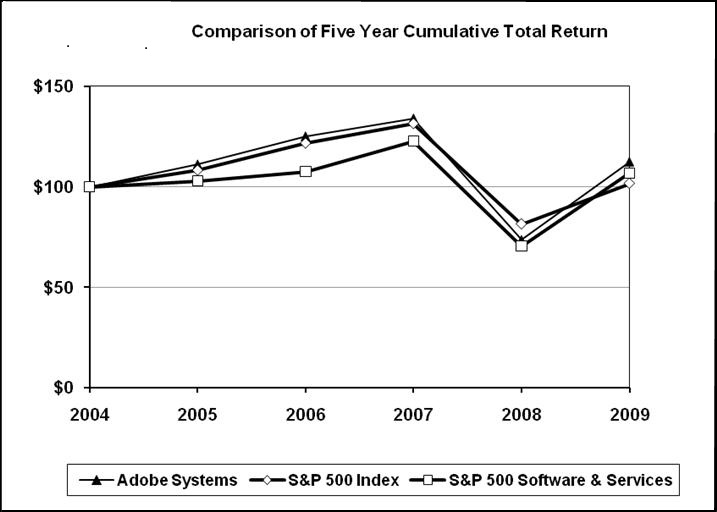
_________________________________________
(*) | The material in this report is not deemed "filed" with the SEC and is not to be incorporated by reference into any of our filings under the Securities Act of 1933 or the Securities Exchange Act of 1934, whether made before or after the date hereof and irrespective of any general incorporation language in any such filings. |
51
TABLE OF CONTENTS
ITEM 6. SELECTED FINANCIAL DATA
The following selected consolidated financial data (presented in thousands, except per share amounts and employee data) is derived from our consolidated financial statements. This data should be read in conjunction with the consolidated financial statements and notes thereto, and with Item 7, Management's Discussion and Analysis of Financial Condition and Results of Operations.
| Fiscal Years | ||||||||||||||||||||
| 2009 | 2008 | 2007 | 2006 | 2005 | |||||||||||||||
Operations: | ||||||||||||||||||||
Revenue | $ | 2,945,853 | $ | 3,579,889 | $ | 3,157,881 | $ | 2,575,300 | $ | 1,966,321 | ||||||||||
Gross profit | $ | 2,649,121 | $ | 3,217,259 | $ | 2,803,187 | $ | 2,282,843 | $ | 1,853,743 | ||||||||||
Income before income taxes | $ | 701,520 | $ | 1,078,508 | $ | 947,190 | $ | 679,727 | $ | 765,776 | ||||||||||
Net income (1) | $ | 386,508 | $ | 871,814 | $ | 723,807 | $ | 505,809 | $ | 602,839 | ||||||||||
Net income per share (1), (2) | ||||||||||||||||||||
Basic | $ | 0.74 | $ | 1.62 | $ | 1.24 | $ | 0.85 | $ | 1.23 | ||||||||||
Diluted | $ | 0.73 | $ | 1.59 | $ | 1.21 | $ | 0.83 | $ | 1.19 | ||||||||||
Cash dividends declared per common share | $ | - | $ | - | $ | - | $ | - | $ | 0.00625 | ||||||||||
Financial position: (3) | ||||||||||||||||||||
Cash, cash equivalents and short-term investments | $ | 1,904,473 | $ | 2,019,202 | $ | 1,993,854 | $ | 2,280,879 | $ | 1,700,834 | ||||||||||
Working capital | $ | 1,629,071 | $ | 1,972,504 | $ | 1,720,441 | $ | 2,208,688 | $ | 1,528,915 | ||||||||||
Total assets | $ | 7,282,237 | $ | 5,821,598 | $ | 5,713,679 | $ | 5,962,548 | $ | 2,440,315 | ||||||||||
Long-term debt | $ | 1,000,000 | $ | 350,000 | $ | - | $ | - | $ | - | ||||||||||
Stockholders' equity | $ | 4,890,568 | $ | 4,410,354 | $ | 4,649,982 | $ | 5,151,876 | $ | 1,865,164 | ||||||||||
Additional data: | ||||||||||||||||||||
Worldwide employees | 8,660 | 7,544 | 6,794 | 6,068 | 4,285 | |||||||||||||||
______________________________________
(1) | In fiscal 2009, 2008, 2007 and 2006, net income and net income per share includes the impact of stock-based compensation charges as well as the integration of Macromedia into our operations in fiscal 2006, neither of which were present in fiscal year 2005. Fiscal 2009, also includes the integration of Omniture into our operations which was not present in the prior years. See Notes 2 and 13 of our Notes to Consolidated Financial Statements for information regarding our Omniture and Macromedia acquisitions and stock-based compensation, respectively. |
(2) | On March 16, 2005, our Board of Directors approved a two-for-one stock split, in the form of a stock dividend, of our common stock payable on May 23, 2005 to stockholders of record as of May 2, 2005. Per share data, for all periods presented, have been adjusted to give effect to this stock split. |
(3) | Information associated with our financial position is as of the Friday closest to November 30 for the five fiscal periods through 2009. |
52
TABLE OF CONTENTS
ITEM 7. MANAGEMENT'S DISCUSSION AND ANALYSIS OF FINANCIAL CONDITION AND RESULTS OF OPERATIONS
The following discussion should be read in conjunction with our consolidated financial statements and notes thereto.
In addition to historical information, this Annual Report on Form 10-K contains forward-looking statements, including statements regarding product plans, future growth and market opportunities which involve risks and uncertainties that could cause actual results to differ materially from these forward-looking statements. Factors that might cause or contribute to such differences include, but are not limited to, those discussed in the section titled "Risk Factors" in Part 1, Item 1A of this report. You should carefully review the risks described herein and in other documents we file from time to time with the SEC, including the Quarterly Reports on Form 10-Q to be filed in fiscal 2010. When used in this report, the words "expects," "could," "would," "may," "anticipates," "intends," "plans," "believes," "seeks," "targets," "estimates," "looks for," "looks to" and similar expressions, as well as statements regarding our focus for the future, are generally intended to identify forward-looking statements. You should not place undue reliance on these forward-looking statements, which speak only as of the date of this Annual Report on Form 10-K. We undertake no obligation to publicly release any revisions to the forward-looking statements or reflect events or circumstances after the date of this document.
BUSINESS OVERVIEW
Founded in 1982, Adobe Systems Incorporated is one of the largest and most diversified software companies in the world. We offer a line of creative, business, Web and mobile software and services used by creative professionals, knowledge workers, consumers, OEMs, developers and enterprises for creating, managing, delivering, optimizing and engaging with compelling content and experiences across multiple operating systems, devices and media. We distribute our products through a network of distributors, VARs, systems integrators, ISVs and OEMs, direct to end users and through our own Website at www.adobe.com. We also license our technology to hardware manufacturers, software developers and service providers, and we offer integrated software solutions to businesses of all sizes. We have operations in the Americas, Europe, EMEA and Asia. Our software runs on personal computers with Microsoft Windows, Apple OS, Linux, UNIX and various non-PC platforms, depending on the product.
ACQUISITION OF OMNITURE
On October 23, 2009, we completed the acquisition of Omniture, an industry leader in Web analytics and online business optimization based in Orem, Utah, for approximately $1.8 billion. Accordingly, we have included the results of the business operations acquired from Omniture in our consolidated results of operations beginning on October 24, 2009. We expect the acquisition to have a significant impact on our consolidated financial position, results of operations and cash flows. We expect our revenues, cost of revenues and operating expenses to increase in the future, but we also anticipate both revenue and cost saving synergies. Coinciding with the integration of Omniture, we created a new reportable segment for financial reporting purposes. See Note 2 of our Notes to Consolidated Financial Statements for further information regarding this acquisition .
CRITICAL ACCOUNTING POLICIES AND ESTIMATES
In preparing our consolidated financial statements in accordance with GAAP and pursuant to the rules and regulations of the SEC, we make assumptions, judgments and estimates that affect the reported amounts of assets, liabilities, revenue and expenses, and related disclosures of contingent assets and liabilities. We base our assumptions, judgments and estimates on historical experience and various other factors that we believe to be reasonable under the circumstances. Actual results could differ materially from these estimates under different assumptions or conditions. On a regular basis, we evaluate our assumptions, judgments and estimates. We also discuss our critical accounting policies and estimates with the Audit Committee of the Board of Directors.
We believe that the assumptions, judgments and estimates involved in the accounting for revenue recognition, stock-based compensation, business combinations, goodwill impairment and income taxes have the greatest potential impact on our consolidated financial statements. These areas are key components of our results of operations and are based on complex rules which require us to make judgments and estimates, so we consider these to be our critical accounting policies. Historically, our assumptions, judgments and estimates relative to our critical accounting policies have not differed materially from actual results.
53
TABLE OF CONTENTS
Revenue Recognition
We recognize revenue when all four revenue recognition criteria have been met: persuasive evidence of an arrangement exists, we have delivered the product or performed the service, the fee is fixed or determinable and collection is probable. Determining whether and when some of these criteria have been satisfied often involves assumptions and judgments that can have a significant impact on the timing and amount of revenue we report. For example, for multiple element arrangements, we must: (1) determine whether and when each element has been delivered; (2) determine whether undelivered products or services are essential to the functionality of the delivered products and services; (3) determine whether vendor-specific objective evidence ("VSOE") of fair value exists for each undelivered element; and (4) allocate the total price among the various elements we must deliver. Changes in assumptions or judgments or changes to the elements in a software arrangement could cause a material increase or decrease in the amount of revenue that we report in a particular period.
In addition, we must estimate certain royalty revenue amounts due to the timing of securing information from our customers. While we believe we can make reliable estimates regarding these matters, these estimates are inherently subjective. Accordingly, our assumptions and judgments regarding future products and services as well as our estimates of royalty revenue could differ from actual events, thus materially impacting our financial position and results of operations.
Product revenue is recognized when the above criteria are met. We reduce the revenue recognized for estimated future returns, price protection and rebates at the time the related revenue is recorded. In determining our estimate for returns and in accordance with our internal policy regarding global channel inventory which is used to determine the level of product held by our distributors on which we have recognized revenue, we rely upon historical data, the estimated amount of product inventory in our distribution channel, the rate at which our product sells through to the end user, product plans and other factors. Our estimated provisions for returns can vary from what actually occurs. Product returns may be more or less than what was estimated. The amount of inventory in the channel could be different than what is estimated. Our estimate of the rate of sell through for product in the channel could be different than what actually occurs. There could be a delay in the release of our products. These factors and unanticipated changes in the economic and industry environment could make our return estimates differ from actual returns, thus materially impacting our financial position and results of operations.
We offer price protection to our distributors that allows for the right to a credit if we permanently reduce the price of a software product. When evaluating the adequacy of the price protection allowance, we analyze historical returns, current sell-through of distributor and retailer inventory of our products, changes in customer demand and acceptance of our products and other related factors. In addition, we monitor the volume of sales to our channel partners and their inventories. Changes to these assumptions or in the economic environment could result in higher returns or higher price protection costs in subsequent periods.
In the future, actual returns and price protection may materially exceed our estimates as unsold products in the distribution channels are exposed to rapid changes in consumer preferences, market conditions or technological obsolescence due to new platforms, product updates or competing products. While we believe we can make reliable estimates regarding these matters, these estimates are inherently subjective. Accordingly, if our estimates change, our returns and price protection reserves would change, which would impact the total net revenue we report.
We recognize revenues for hosting services that are based on a committed number of transactions, including implementation and set-up fees, ratably beginning on the date the customer commences use of our services and continuing through the end of the customer term. Over-usage fees, and fees billed based on the actual number of transactions from which we capture data, are billed in accordance with contract terms as these fees are incurred. We record amounts that have been invoiced in accounts receivable and in deferred revenue or revenue, depending on whether the revenue recognition criteria have been met.
Our consulting revenue is primarily recognized using the proportionate performance method and is measured monthly based on input measures, such as on hours incurred to date compared to total estimated hours to complete, with consideration given to output measures, such as contract milestones, when applicable. Accordingly, our estimates of consulting revenue could differ from actual events and may materially impact our financial position and results of operations.
Stock-based Compensation
Stock-based compensation cost is measured at the grant date based on the fair value of the award and is recognized as expense on a straight-line basis over the requisite service period, which is generally the vesting period.
54
TABLE OF CONTENTS
We currently use the Black-Scholes option pricing model to determine the fair value of stock options and employee stock purchase plan shares. The determination of the fair value of stock-based awards on the date of grant using an option pricing model is affected by our stock price as well as assumptions regarding a number of complex and subjective variables. These variables include our expected stock price volatility over the expected term of the awards, actual and projected employee stock option exercise behaviors, the risk-free interest rate, estimated forfeitures and expected dividends.
We estimate the expected term of options granted by calculating the average term from our historical stock option exercise experience. We estimate the volatility of our common stock by using implied volatility in market traded options. Our decision to use implied volatility was based upon the availability of actively traded options on our common stock and our assessment that implied volatility is more representative of future stock price trends than historical volatility. We base the risk-free interest rate on zero-coupon yields implied from U.S. Treasury issues with remaining terms similar to the expected term on the options. We do not anticipate paying any cash dividends in the foreseeable future and therefore use an expected dividend yield of zero in the option pricing model. We are required to estimate forfeitures at the time of grant and revise those estimates in subsequent periods if actual forfeitures differ from those estimates. We use historical data to estimate pre-vesting option forfeitures and record stock-based compensation expense only for those awards that are expected to vest.
If we use different assumptions for estimating stock-based compensation expense in future periods or if actual forfeitures differ materially from our estimated forfeitures, the change in our stock-based compensation expense could materially affect our operating income, net income and net income per share.
Business Combinations
We allocate the purchase price of acquired companies to the tangible and intangible assets acquired and liabilities assumed as well as to in-process research and development based upon their estimated fair values at the acquisition date. The purchase price allocation process requires management to make significant estimates and assumptions, especially at acquisition date with respect to intangible assets and deferred revenue obligations assumed.
Although we believe the assumptions and estimates we have made are reasonable, they are based in part on historical experience and information obtained from the management of the acquired companies and are inherently uncertain. Examples of critical estimates in valuing certain of the intangible assets we have acquired or may acquire in the future include but are not limited to:
· | future expected cash flows from software license sales, subscriptions, support agreements, consulting contracts and acquired developed technologies and patents; |
· | expected costs to develop the in-process research and development into commercially viable products and estimated cash flows from the projects when completed; |
· | the acquired company's trade name and trademarks as well as assumptions about the period of time the acquired trade name and trademarks will continue to be used in the combined company's product portfolio; and |
· | discount rates. |
In connection with the purchase price allocations for our acquisitions, we estimate the fair value of the deferred revenue obligations assumed. The estimated fair value of the support obligations is determined utilizing a cost build-up approach. The cost build-up approach determines fair value by estimating the costs related to fulfilling the obligations plus a normal profit margin. The estimated costs to fulfill the obligations are based on the historical costs related to fulfilling the obligations.
Unanticipated events and circumstances may occur which may affect the accuracy or validity of such assumptions, estimates or actual results.
Goodwill Impairment
We complete our goodwill impairment test on an annual basis, during the second quarter of our fiscal year, or more frequently, if changes in facts and circumstances indicate that an impairment in the value of goodwill recorded on our balance sheet may exist. In order to estimate the fair value of goodwill, we typically estimate future revenue, consider market factors
55
TABLE OF CONTENTS
and estimate our future cash flows. Based on these key assumptions, judgments and estimates, we determine whether we need to record an impairment charge to reduce the value of the asset carried on our balance sheet to its estimated fair value. Assumptions, judgments and estimates about future values are complex and often subjective. They can be affected by a variety of factors, including external factors such as industry and economic trends, and internal factors such as changes in our business strategy or our internal forecasts. Although we believe the assumptions, judgments and estimates we have made in the past have been reasonable and appropriate, different assumptions, judgments and estimates could materially affect our reported financial results.
We completed our annual impairment test in the second quarter of fiscal 2009 and determined there was no impairment. We currently believe that there is no significant risk of future material goodwill impairment in any of our reporting units.
Accounting for Income Taxes
We use the asset and liability method of accounting for income taxes. Under this method, income tax expense is recognized for the amount of taxes payable or refundable for the current year. In addition, deferred tax assets and liabilities are recognized for the expected future tax consequences of temporary differences between the financial reporting and tax bases of assets and liabilities, and for operating losses and tax credit carryforwards. Management must make assumptions, judgments and estimates to determine our current provision for income taxes and also our deferred tax assets and liabilities and any valuation allowance to be recorded against a deferred tax asset.
Our assumptions, judgments and estimates relative to the current provision for income taxes take into account current tax laws, our interpretation of current tax laws and possible outcomes of current and future audits conducted by foreign and domestic tax authorities. We have established reserves for income taxes to address potential exposures involving tax positions that could be challenged by tax authorities. In addition, we are subject to the continual examination of our income tax returns by the IRS and other domestic and foreign tax authorities, including a current examination by the IRS for our fiscal 2005, 2006 and 2007 tax returns. These examinations are expected to focus on our intercompany transfer pricing practices as well as other matters. Although we believe our assumptions, judgments and estimates are reasonable, changes in tax laws or our interpretation of tax laws and the resolution of the current and any future tax audits could significantly impact the amounts provided for income taxes in our consolidated financial statements.
Our assumptions, judgments and estimates relative to the value of a deferred tax asset take into account predictions of the amount and category of future taxable income, such as income from operations or capital gains income. Actual operating results and the underlying amount and category of income in future years could render our current assumptions, judgments and estimates of recoverable net deferred taxes inaccurate. Any of the assumptions, judgments and estimates mentioned above could cause our actual income tax obligations to differ from our estimates, thus materially impacting our financial position and results of operations.
RESULTS OF OPERATIONS
Overview of 2009
Effective in the first quarter of fiscal 2009, our former Mobile and Devices Solutions segment, which was integrated into our Platform business unit to better align our engineering and marketing efforts, is now reported as part of the Platform segment. Prior year information has been updated to reflect the integration of these business units.
During fiscal 2009, our business was broadly impacted by the global economic recession and generally weak macro-economic environment. This resulted in a significant year-over-year decline in our revenue and earnings results.
In our Creative Solutions segment, revenue decreased by 18% during fiscal 2009 as compared to fiscal 2008. We attribute this decline to reduced adoption of our CS4 family of products during the year, as the global financial crisis significantly affected demand in the creative professional end user market. All major creative product categories declined on a year-over-year basis.
Our Business Productivity Solutions business declined 19% in fiscal 2009 when compared to fiscal 2008. A decline in demand primarily due to the macro-economic environment with our Acrobat product family – which makes up the majority of revenue in our Knowledge Worker segment – was the primary factor for this decline. In our Enterprise business, our LiveCycle revenue declined 7% when compared to revenue achieved in fiscal 2008. We attribute this smaller percentage decline in comparison to our other segments to focused execution by our sales teams and the large market opportunities these product solutions address.
56
TABLE OF CONTENTS
In our Platform segment, revenue declined 22% on a year-over-year basis primarily due to the impact of the OSP. The removal of license fees associated with our Flash technologies on mobile devices commenced in fiscal 2009, and as such, OEM revenue from device manufacturers began to decline from rates of revenue we achieved in fiscal 2008. We continue to expect this decline to be offset over time by an increased demand for tooling products, server technologies, services and applications in many of our other business segments.
In our Print and Publishing segment, revenue was also impacted by the global macroeconomic environment, resulting in a 16% year-over-year decline.
The Omniture business appeared to stabilize during the fourth quarter with the improvement in the general economy, as indicated by an increase in the transaction volume on our network. In addition, customer retention rates began stabilizing and we experienced an increase in the number of subscription services provided to our existing customers.
Revenue (dollars in millions)
Fiscal 2009 | % Change 2009 to 2008 | Fiscal 2008 | % Change 2008 to 2007 | Fiscal 2007 | ||||||||||||||
Product | $ | 2,759.4 | (19 | )% | $ | 3,396.5 | 12 | % | $ | 3,019.5 | ||||||||
Percentage of total revenue | 94 | % | 95 | % | 96 | % | ||||||||||||
Services and support | 186.5 | 2 | % | 183.4 | 33 | % | 138.4 | |||||||||||
Percentage of total revenue | 6 | % | 5 | % | 4 | % | ||||||||||||
Total revenue | $ | 2,945.9 | (18 | )% | $ | 3,579.9 | 13 | % | $ | 3,157.9 | ||||||||
In fiscal 2009, we categorized our products into the following segments: Creative Solutions, Knowledge Worker, Enterprise, Platform, Print and Publishing and Omniture products.
Our Creative Solutions segment focuses on delivering a complete professional line of integrated tools for a full range of creative and developer tasks to an extended set of customers. Our Knowledge Worker segment focuses on the needs of knowledge worker customers, providing essential applications and services to help them reliably share information and collaborate effectively. This segment contains revenue generated by the Adobe Acrobat family of products. Our Enterprise segment provides server-based enterprise interaction solutions that automate people-centric processes and contains revenue generated by our LiveCycle line of products. The Platform segment provides developer solutions and technologies, including Adobe Flash Player, Adobe AIR and Flash Builder which are used to build rich application experiences in addition to solutions that create compelling experiences through rich content, user interfaces and data services on mobile and non-PC devices such as cellular phones, consumer devices and Internet connected hand-held devices. The Print and Publishing segment addresses market opportunities ranging from the diverse publishing needs of technical and business publishing, to our legacy type and OEM printing businesses. Finally, our Omniture segment provides Web analytics and online business optimization products and services.
We will adjust our reporting segments at the beginning of fiscal 2010 to reflect changes in how we manage our business as we enter the new fiscal year. Specifically, we are moving responsibility for our Adobe Connect Pro product line from our Knowledge Worker segment to our Enterprise segment.
Our services and support revenue is composed of consulting, training and maintenance and support, primarily related to the licensing of our enterprise, developer and platform products. Our support revenue also includes technical support and developer support to partners and developer organizations related to our desktop products. Our maintenance and support offerings which entitle customers to receive product upgrades and enhancements or technical support, depending on the offering, are recognized ratably over the term of the arrangement.
57
TABLE OF CONTENTS
Segment Information (dollars in millions)
Fiscal 2009 | % Change 2009 to 2008 | Fiscal 2008 | % Change 2008 to 2007 | Fiscal 2007 | ||||||||||||||
Creative Solutions | $ | 1,702.1 | (18 | )% | $ | 2,072.8 | 9 | % | $ | 1,899.0 | ||||||||
Percentage of total revenue | 58 | % | 58 | % | 60 | % | ||||||||||||
Knowledge Worker | 623.0 | (23 | )% | 810.9 | 11 | % | 728.5 | |||||||||||
Percentage of total revenue | 21 | % | 23 | % | 23 | % | ||||||||||||
Enterprise | 235.5 | (7 | )% | 253.0 | 32 | % | 191.3 | |||||||||||
Percentage of total revenue | 8 | % | 7 | % | 6 | % | ||||||||||||
Platform | 181.0 | (22 | )% | 231.6 | 74 | % | 133.4 | |||||||||||
Percentage of total revenue | 6 | % | 6 | % | 4 | % | ||||||||||||
| Print and Publishing | 178.0 | (16 | )% | 211.6 | 3 | % | 205.7 | |||||||||||
Percentage of total revenue | 6 | % | 6 | % | 7 | % | ||||||||||||
Omniture | 26.3 | * | % | - | - | % | - | |||||||||||
Percentage of total revenue | 1 | % | - | % | - | % | ||||||||||||
Total revenue | $ | 2,945.9 | (18 | )% | $ | 3,579.9 | 13 | % | $ | 3,157.9 | ||||||||
_____________________________________
* | Percentage is not meaningful. |
Fiscal 2009 Revenue Compared to Fiscal 2008 Revenue
Revenue from our Creative Solutions segment decreased $370.7 million during fiscal 2009 as compared to fiscal 2008 primarily due to reduced adoption of our CS family of products because of the global recession and generally weak macro-economic environment. The decrease was driven largely by a 15% decline in Creative Suites related revenue and a decline of 27% in Photoshop point product revenue. Also contributing to the decrease was an overall decline in the number of units licensed. Average unit selling prices have remained relatively consistent.
Revenue in our Knowledge Worker segment decreased $187.9 million during fiscal 2009 as compared to fiscal 2008 for similar reasons as Creative Solutions in addition to a decrease in the licensing of our Acrobat family of products. We attribute the decline in revenue to lower volume licensing by our enterprise customers, as well as a decrease in the number of units sold through our shrink-wrap distribution channel. Average unit selling prices have remained relatively consistent.
Revenue from our Enterprise segment decreased $17.5 million during fiscal 2009 as compared to fiscal 2008 primarily due to the economic impact which resulted in reduced spending by our enterprise customers.
Revenue from our Platform segment decreased by $50.6 million during fiscal 2009 as compared to fiscal 2008 due to the impact of the OSP which we announced on May 1, 2008, and involves the removal of certain licensing fees of our Flash Lite client with OEMs.
Revenue in our Print and Publishing business decreased by $33.6 million during fiscal 2009 as compared to fiscal 2008 due to reduced demand because of the global macro-economic downturn.
We acquired Omniture in the fourth quarter of fiscal 2009, and as such, there is no prior fiscal 2008 period with which to compare Omniture fiscal 2009 revenue.
Fiscal 2008 Revenue Compared to Fiscal 2007 Revenue
Revenue from our Creative Solutions segment increased $173.8 million during fiscal 2008 as compared to fiscal 2007 primarily due to ongoing adoption of our CS3 family of products, as well as the launch of our CS4 family of products in the fourth quarter of fiscal 2008. We also achieved solid growth in our Scene7 business and with our hobbyist products. The increase was also driven by a 7% increase in Creative Suites related revenue and an increase of 5% in Photoshop point product revenue. Also contributing to the increase in fiscal 2008 as compared to fiscal 2007 was an increase in certain unit average selling prices. Units sold remained relatively stable.
Revenue in our Knowledge Worker segment increased $82.4 million during fiscal 2008 as compared to fiscal 2007 primarily due to an increase in the licensing of our Acrobat 8 and new Acrobat 9 family of products. An increase in the number of units sold as well as a slight increase in certain unit average selling prices also contributed to higher revenue as compared to fiscal 2007.
58
TABLE OF CONTENTS
Revenue from our Enterprise segment increased $61.7 million during fiscal 2008 as compared to fiscal 2007 primarily due to an increased adoption of our LiveCycle family of products and a larger number of enterprise solution transactions at a higher average transaction size.
Revenue from our Platform segment increased by $98.2 million during fiscal 2008 as compared to fiscal 2007 due to continued adoption of Flash Lite by mobile and non-PC device manufacturers, as well as increased revenue related to Flash Player and the launch of Adobe AIR which resulted in increased revenue from our developer tools.
Revenue in our Print and Publishing business increased by $5.9 million during fiscal 2008 as compared to fiscal 2007, driven by ongoing adoption of our eLearning solutions as well as some of our legacy print and publishing products.
Geographic Information (dollars in millions)
Fiscal 2009 | % Change 2009 to 2008 | Fiscal 2008 | % Change 2008 to 2007 | Fiscal 2007 | ||||||||||||||
Americas | $ | 1,382.6 | (15 | )% | $ | 1,632.8 | 8 | % | $ | 1,508.9 | ||||||||
Percentage of total revenue | 46 | % | 46 | % | 48 | % | ||||||||||||
EMEA | 928.9 | (24 | )% | 1,229.2 | 20 | % | 1,026.4 | |||||||||||
Percentage of total revenue | 32 | % | 34 | % | 32 | % | ||||||||||||
Asia | 634.4 | (12 | )% | 717.9 | 15 | % | 622.6 | |||||||||||
Percentage of total revenue | 22 | % | 20 | % | 20 | % | ||||||||||||
Total revenue | $ | 2,945.9 | (18 | )% | $ | 3,579.9 | 13 | % | $ | 3,157.9 | ||||||||
Fiscal 2009 Revenue by Geography Compared to Fiscal 2008 Revenue by Geography
Overall revenue in each of the geographic segments for fiscal 2009 decreased compared to fiscal 2008 primarily due to the global economic recession, which resulted in reduced adoption of many of our major products.
Included in the overall decrease in revenue were impacts associated with foreign currency. Revenue in EMEA measured in U.S. dollars decreased approximately $47.1 million, due to the strength of the U.S. dollar against the Euro, as compared to fiscal 2008. Our currency hedging program is used to mitigate a portion of the foreign currency impact to revenue. During fiscal 2009, our currency hedging program related to the Euro resulted in hedging gains of $25.8 million. Revenue in Asia measured in U.S. dollars was favorably impacted by approximately $32.8 million due to the strength of the Yen against the U.S. dollar as compared to fiscal 2008. During fiscal 2009, our currency hedging program related to the Yen resulted in hedging gains of $1.2 million.
Fiscal 2008 Revenue by Geography Compared to Fiscal 2007 Revenue by Geography
Overall revenue in each of the geographic segments for fiscal 2008 increased compared to fiscal 2007 primarily due to the ongoing adoption of our CS3 family of products during the first half of the year, the launch of our CS4 family of products in the fourth quarter of the year, the launch of our Acrobat 9 family of products in the third quarter of the year and strong growth in our enterprise business.
Included in the overall increase in revenue were impacts associated with foreign currency. Revenue in EMEA measured in U.S. dollars was favorably impacted by approximately $69.3 million during fiscal 2008 as compared to fiscal 2007 primarily due to the strength of the Euro against the U.S. dollar. Additionally, during fiscal 2008 we had a hedging gain of $13.2 million. Revenue in Asia was favorably impacted by approximately $39.6 million during fiscal 2008 as compared to fiscal 2007 primarily due to the strength of the Yen against the U.S. dollar.
See Item 7A, Quantitative and Qualitative Disclosures About Market Risk regarding foreign currency risks.
Product Backlog
With regard to our product backlog, the actual amount of backlog at any particular time may not be a meaningful indicator of future business prospects. Backlog is comprised of unfulfilled orders, excluding those associated with new product releases, those pending credit review and those not shipped due to the application of our global inventory policy. Our backlog for the fourth quarter of fiscal 2009 was approximately 9% of fourth quarter fiscal 2009 revenue compared with approximately 2% of third quarter fiscal 2009 revenue. We had minimal backlog at the end of the fourth quarter of fiscal 2008.
59
TABLE OF CONTENTS
Cost of Revenue (dollars in millions)
Fiscal 2009 | % Change 2009 to 2008 | Fiscal 2008 | % Change 2008 to 2007 | Fiscal 2007 | ||||||||||||||
Product | $ | 228.9 | (14 | )% | $ | 266.4 | (2 | )% | $ | 270.8 | ||||||||
Percentage of total revenue | 8 | % | 7 | % | 9 | % | ||||||||||||
Services and support | 67.8 | (30 | )% | 96.2 | 15 | % | 83.9 | |||||||||||
Percentage of total revenue | 2 | % | 3 | % | 3 | % | ||||||||||||
Total cost of revenue | $ | 296.7 | (18 | )% | $ | 362.6 | 2 | % | $ | 354.7 | ||||||||
Product
Cost of product revenue includes product packaging, third-party royalties, excess and obsolete inventory, amortization related to localization costs and acquired rights to use technology and the costs associated with the manufacturing of our products.
Cost of product revenue decreased due to the following:
% Change 2009 to 2008 | % Change 2008 to 2007 | |||||||
Amortization of acquired rights to use technology | (8 | )% | 6 | % | ||||
Amortization of purchased intangibles | (10 | ) | (10 | ) | ||||
Royalty cost | (1 | ) | 3 | |||||
Hosted services | 9 | 3 | ||||||
Various individually insignificant items | (4 | ) | (4 | ) | ||||
Total change | (14 | )% | (2 | )% | ||||
The decrease in amortization of acquired rights to use technology primarily relates to a charge for historical use of licensing rights associated with certain technology licensing arrangements entered into in fiscal 2008 that did not recur in fiscal 2009. Amortization of acquired rights to use technology increased in fiscal 2008 as compared to fiscal 2007, primarily due to the fact that we entered into certain technology licensing arrangements totaling $100.4 million and $60.0 million during fiscal 2008 and fiscal 2007, respectively. Of this cost, an estimated $56.4 million and $44.8 million during fiscal 2008 and fiscal 2007, respectively, was related to future licensing rights and has been capitalized and will be amortized on a straight-line basis over the estimated useful lives up to fifteen years. Of the remaining costs, we estimated that approximately $27.2 million and $15.2 million was related to historical use of licensing rights which was expensed as cost of sales and the residual of $16.8 million for fiscal 2008 was expensed as general and administrative costs. In connection with these licensing arrangements, we have the ability to acquire additional rights to use technology in the future.
Amortization of purchased intangibles decreased during fiscal 2009 as compared to fiscal 2008 and decreased during fiscal 2008 as compared to fiscal 2007, due to a decrease in amortization primarily associated with intangible assets purchased through the Macromedia acquisition which were fully amortized during fiscal 2009.
The increase in hosted service costs was primarily related to the amortization of our investment in capitalized infrastructure costs related to our SaaS business in fiscal 2009 as compared to fiscal 2008.
Services and Support
Cost of services and support revenue is primarily comprised of employee-related costs and associated costs incurred to provide consulting services, training and product support.
Cost of services and support revenue decreased during fiscal 2009 as compared to fiscal 2008, due to decreases in compensation and related benefits driven by headcount reductions as well as increased consulting support provided by third- party systems integrators resulting in the downsizing of our consulting organization.
Cost of services and support revenue increased during fiscal 2008 as compared to fiscal 2007, primarily due to increases in compensation and related benefits driven by increases in headcount related to product support and utilization by customers of our consulting services.
60
TABLE OF CONTENTS
Operating Expenses (dollars in millions)
Research and Development, Sales and Marketing and General and Administrative Expenses
The decrease in research and development, sales and marketing and general and administrative expenses in fiscal 2009 was primarily driven by decreases in compensation expense and a decrease in the costs associated with acquired rights to use technology. The decrease in compensation costs during fiscal 2009 as compared to fiscal 2008 was primarily due to lower profit sharing and employee bonuses based on company performance. The increase in compensation costs during fiscal 2008 as compared to fiscal 2007 related to increases in headcount and stock-based compensation offset by decreases in profit sharing and employee bonuses based on company performance.
Research and Development
Fiscal 2009 | % Change 2009 to 2008 | Fiscal 2008 | % Change 2008 to 2007 | Fiscal 2007 | ||||||||||||||
Expenses | $ | 565.1 | (15 | )% | $ | 662.1 | 8 | % | $ | 613.2 | ||||||||
Percentage of total revenue | 19 | % | 18 | % | 19 | % | ||||||||||||
Research and development expenses consist primarily of salary and benefit expenses for software developers, contracted development efforts, related facilities costs and expenses associated with computer equipment used in software development.
Research and development expenses decreased due to the following:
% Change 2009 to 2008 | % Change 2008 to 2007 | |||||||
Compensation and related benefits associated with headcount growth | 1 | % | 7 | % | ||||
Compensation associated with incentive compensation and stock-based compensation | (13 | ) | - | |||||
Various individually insignificant items | (3 | ) | 1 | |||||
Total change | (15 | )% | 8 | % | ||||
We believe that investments in research and development, including the recruiting and hiring of software developers, are critical to remaining competitive in the marketplace and are directly related to continued timely development of new and enhanced products. We will continue to focus on long-term opportunities available in our end markets and make significant investments in the development of our desktop application and server-based software products.
Sales and Marketing
Fiscal 2009 | % Change 2009 to 2008 | Fiscal 2008 | % Change 2008 to 2007 | Fiscal 2007 | ||||||||||||||
Expenses | $ | 981.9 | (10 | )% | $ | 1,089.3 | 11 | % | $ | 984.4 | ||||||||
Percentage of total revenue | 33 | % | 30 | % | 31 | % | ||||||||||||
Sales and marketing expenses consist primarily of salary and benefit expenses, sales commissions, travel expenses and related facilities costs for our sales, marketing, order management and global supply chain management personnel. Sales and marketing expenses also include the costs of programs aimed at increasing revenue, such as advertising, trade shows, public relations and other market development programs.
Sales and marketing expenses decreased due to the following:
% Change 2009 to 2008 | % Change 2008 to 2007 | |||||||
Compensation and related benefits associated with headcount growth | 2 | % | 5 | % | ||||
Compensation associated with incentive compensation and stock-based compensation | (8 | ) | 1 | |||||
Marketing spending related to product launches and overall marketing efforts to further increase revenue | (1 | ) | 4 | |||||
Various individually insignificant items | (3 | ) | 1 | |||||
Total change | (10 | )% | 11 | % | ||||
61
TABLE OF CONTENTS
General and Administrative
Fiscal 2009 | % Change 2009 to 2008 | Fiscal 2008 | % Change 2008 to 2007 | Fiscal 2007 | ||||||||||||||
Expenses | $ | 298.7 | (11 | )% | $ | 337.3 | 23 | % | $ | 275.0 | ||||||||
Percentage of total revenue | 10 | % | 9 | % | 9 | % | ||||||||||||
General and administrative expenses consist primarily of compensation and benefit expenses, travel expenses and related facilities costs for our finance, facilities, human resources, legal, information services and executive personnel. General and administrative expenses also include outside legal and accounting fees, provision for bad debts, expenses associated with computer equipment and software used in the administration of the business, charitable contributions and various forms of insurance.
| General and administrative expenses decreased due to the following: |
% Change 2009 to 2008 | % Change 2008 to 2007 | |||||||
Allocation of costs associated with acquired rights to use technology | (5 | )% | 6 | % | ||||
Compensation and related benefits associated with headcount growth | 2 | 4 | ||||||
Compensation associated with incentive compensation and stock-based compensation | (8 | ) | 2 | |||||
Charitable contributions | (3 | ) | 4 | |||||
Professional and consulting fees | 1 | 2 | ||||||
Provision for bad debt | - | 2 | ||||||
Depreciation and amortization | 1 | 1 | ||||||
Various individually insignificant items | 1 | 2 | ||||||
Total change | (11 | )% | 23 | % | ||||
The decrease in allocation of costs associated with acquired rights to use technology in fiscal 2009 as compared to fiscal 2008 primarily relates to the historical use of licensing rights associated with certain technology licensing arrangements entered into in fiscal 2008 that did not recur in fiscal 2009. Allocation of costs associated with acquired rights to use technology increased in fiscal 2008 as compared to fiscal 2007 primarily due to the fact that we entered into certain technology licensing arrangements totaling $100.4 million and $60.0 million during fiscal 2008 and fiscal 2007, respectively. Of this cost, an estimated $56.4 million and $44.8 million during fiscal 2008 and fiscal 2007, respectively, was related to future licensing rights and has been capitalized and will be amortized on a straight-line basis over the estimated useful lives up to fifteen years. Of the remaining costs, we estimated that approximately $27.2 million and $15.2 million during fiscal 2008 and fiscal 2007, respectively, was related to historical use of licensing rights which was expensed as cost of sales and the residual of $16.8 million for fiscal 2008 was expensed as general and administrative costs. In connection with these licensing arrangements, we have the ability to acquire additional rights to use technology in the future.
Charitable contributions represent funding of the Adobe Foundation which is a private foundation created to leverage human, technological and financial resources to drive social change and improve the communities in which we live and work. The decrease in charitable contributions during fiscal 2009 as compared to fiscal 2008 and increase in fiscal 2008 as compared to fiscal 2007 reflects a change in the timing of contributions to the Adobe Foundation.
Restructuring Charges
Fiscal 2009 | % Change 2009 to 2008 | Fiscal 2008 | % Change 2008 to 2007 | Fiscal 2007 | ||||||||||||||
Expenses | $ | 41.3 | 29 | % | $ | 32.1 | * | % | $ | 0.6 | ||||||||
Percentage of total revenue | 1 | % | 1 | % | * | % | ||||||||||||
_____________________________________
* | Percentage is not meaningful. |
Fiscal 2009 Restructuring Charges
On November 10, 2009, we initiated a restructuring plan to appropriately align our costs in connection with our fiscal 2010 operating plan impacting up to approximately 630 full-time positions worldwide. In connection with this restructuring plan, in the fourth quarter of fiscal 2009, we recorded restructuring charges of approximately $25.5 million related to ongoing
62
TABLE OF CONTENTS
termination benefits for the elimination of approximately 340 of these full-time positions worldwide. As of November 27, 2009, approximately $2.5 million was paid. The remaining accrual associated with these ongoing termination benefits is expected to be paid during fiscal 2010. The restructuring activities related to this program affect only those employees and facilities that were associated with Adobe prior to the acquisition of Omniture on October 23, 2009.
Beginning in the first quarter of fiscal 2010, we expect to record additional restructuring charges of approximately $15 million to $18 million primarily related to the consolidation of leased facilities and up to approximately $26 million related to employee severance arrangements for the elimination of the remaining full-time positions worldwide. We expect to accrue the facility related liabilities beginning in the first quarter of fiscal 2010 and pay these liabilities through fiscal 2021 based on current lease terms. Substantially all of these charges will result in cash expenditures.
Omniture Restructuring Charges
We completed our acquisition of Omniture on October 23, 2009. In the fourth quarter of fiscal 2009, we initiated a plan to restructure the pre-merger operations of Omniture to eliminate certain duplicative activities, focus our resources on future growth opportunities and reduce our cost structure. In connection with this restructuring plan, we accrued a total of approximately $10.6 million in costs related to termination benefits for the elimination of approximately 100 regular positions and for the closure of duplicative facilities. We also accrued approximately $0.2 million in costs related to the cancellation of certain contracts associated with the wind-down of subsidiaries and other service contracts held by Omniture. These costs were recorded as a part of the purchase price allocation, as discussed in Note 2 of our Notes to Consolidated Financial Statements , and have been accrued for as of November 27, 2009. We expect to pay the termination benefits and facility related liabilities through fiscal 2010 and fiscal 2013, respectively.
Additionally, approximately $1.5 million of restructuring costs related to facilities were included in the liabilities assumed by us upon our acquisition of Omniture on October 23, 2009.
Fiscal 2008 Restructuring Charges
In the fourth quarter of fiscal 2008, we initiated a restructuring program, consisting of reductions in workforce of approximately 560 full-time positions globally and the consolidation of facilities, in order to reduce our operating costs and focus our resources on key strategic priorities. In connection with this restructuring program, we recorded restructuring charges totaling $29.2 million related to ongoing termination benefits for the elimination of approximately 460 of the 560 full-time positions globally. As of November 28, 2008, $0.4 million was paid.
During fiscal 2009, we continued to implement restructuring activities under this program. We vacated approximately 89,000 square feet of research and development and sales facilities in the U.S., the United Kingdom and Canada. We accrued $8.5 million for the fair value of our future contractual obligations under these operating leases using our credit-adjusted risk-free interest rate, estimated at approximately 6% as of the date we ceased to use the leased properties. This amount is net of the fair value of future estimated sublease income of approximately $4.4 million. We also recorded additional charges of $6.7 million for termination benefits for the elimination of substantially all of the remaining 100 full-time positions expected to be terminated.
We have paid substantially all of the accrued termination benefits during fiscal 2009 and expect to pay the remaining amounts in fiscal 2010. We expect to pay facilities-related liabilities through fiscal 2013.
Macromedia Restructuring Charges
We completed our acquisition of Macromedia on December 3, 2005. In connection with this acquisition, we initiated plans to restructure both the pre-merger operations of Adobe and Macromedia to eliminate certain duplicative activities, focus our resources on future growth opportunities and reduce our cost structure. In connection with the worldwide restructuring plan, we recognized costs related to termination benefits for employee positions that were eliminated and for the closure of duplicative facilities. We also recognized costs related to the cancellation of certain contracts associated with the wind-down of subsidiaries and other service contracts held by Macromedia. Costs for termination benefits and contract cancellations were completed during fiscal 2007. Total costs incurred were $27.0 million and $3.2 million, respectively.
63
TABLE OF CONTENTS
As of November 27, 2009, accrued restructuring charges related to the 2009 restructuring program, 2008 restructuring program, Omniture acquisition, and Macromedia acquisition totaled approximately $23.0 million, $4.4 million, $12.3 million, and $5.0 million respectively. We expect to pay the liabilities associated with the 2009 and 2008 restructuring programs through fiscal 2021 and 2013, respectively. We expect to pay the restructuring liabilities associated with the Omniture and Macromedia acquisitions through fiscal 2013 and fiscal 2012, respectively.
See Note 11 of our Notes to Consolidated Financial Statements for further information regarding our restructuring charges.
Amortization of Purchased Intangibles and Incomplete Technology
Fiscal 2009 | % Change 2009 to 2008 | Fiscal 2008 | % Change 2008 to 2007 | Fiscal 2007 | ||||||||||||||
Expenses | $ | 71.6 | 5 | % | $ | 68.2 | (6 | )% | $ | 72.4 | ||||||||
Percentage of total revenue | 2 | % | 2 | % | 2 | % | ||||||||||||
As a result of our acquisition of Omniture in fiscal 2009, we acquired purchased intangibles which are amortized over their estimated useful lives of one to twelve years. In addition, as a result of our acquisition of Macromedia in fiscal 2006, we acquired purchased intangibles which are amortized over their estimated useful lives of two to four years. During fiscal 2009, we completed one business combination, in addition to Omniture. During fiscal 2008 we completed one business combination and during fiscal 2007, we completed two business combinations and one asset acquisition. We acquired purchased intangibles through these acquisitions which are amortized over their estimated useful lives.
Amortization expense increased during fiscal 2009 as compared to fiscal 2008, primarily due to amortization expense associated with intangibles assets purchased through the acquisition of Omniture.
Amortization expense decreased during fiscal 2008 as compared to fiscal 2007, due to a decrease in amortization expense associated with intangible assets purchased through the Macromedia acquisition.
Non-Operating Income (Expense) (dollars in millions)
Fiscal 2009 | % Change 2009 to 2008 | Fiscal 2008 | % Change 2008 to 2007 | Fiscal 2007 | ||||||||||||||
Interest and other income, net | $ | 31.4 | (28 | )% | $ | 43.8 | (47 | )% | $ | 82.7 | ||||||||
Percentage of total revenue | 1 | % | 1 | % | 3 | % | ||||||||||||
Interest expense | (3.4 | ) | 66 | % | (10.0 | ) | * | (0.2 | ) | |||||||||
Percentage of total revenue | * | * | * | |||||||||||||||
Investment gains (losses), net | (17.0 | ) | (204 | )% | 16.4 | 131 | % | 7.1 | ||||||||||
Percentage of total revenue | (1 | )% | * | % | * | |||||||||||||
Total non-operating income (expense), net | $ | 11.0 | (78 | )% | $ | 50.2 | (44 | )% | $ | 89.6 | ||||||||
_________________________________________
* | Percentage is not meaningful. |
Interest and Other Income, Net
Interest and other income, net, consists primarily of interest earned on cash, cash equivalents and short-term fixed income investments. Interest and other income, net also includes foreign exchange gains and losses, including those from hedging revenue transactions primarily denominated in Euro and Japanese Yen currencies.
Interest and other income, net, decreased during fiscal 2009 as compared to fiscal 2008 primarily due to lower interest rates, partially offset by lower average invested balances, realized gains on sales of fixed income securities and lower foreign exchange losses.
Interest and other income, net, decreased during fiscal 2008 as compared to fiscal 2007 primarily as a result of lower average invested balances due to cash used for our share repurchase programs, lower interest rates and increased hedging costs. Additionally, during fiscal 2008, interest and other income, net included losses on fixed income investments associated with a write-down for an other-than-temporary impairment totaling approximately $1.3 million during the second quarter of fiscal 2008.
64
TABLE OF CONTENTS
Interest Expense
Interest expense for fiscal 2009 and 2008, primarily represents interest associated with our credit facility. The outstanding balance as of November 27, 2009 was $1.0 billion. Interest due under the credit facility is paid upon expiration of the London interbank offered rate ("LIBOR") contract or at a minimum, quarterly. The decline in interest expense was primarily due to lower interest rates.
Investment Gains (Losses), Net
Investment gains (losses), net, consists principally of realized gains or losses from the sale of marketable equity investments, other-than-temporary declines in the value of marketable and non-marketable equity securities, unrealized holding gains and losses associated with our deferred compensation plan assets (classified as trading securities), and gains and losses of Adobe Ventures.
Investment gains and (losses), net fluctuated due to the following (in millions):
2009 | 2008 | 2007 | ||||||||||
Net gains (losses) related to our investments in Adobe Ventures and cost method investments | $ | (16.7 | ) | $ | 15.9 | $ | 6.9 | |||||
Gains from sale of equity investments | - | 5.4 | 0.2 | |||||||||
Write-downs due to other-than-temporary declines in value of our marketable equity securities | (0.3 | ) | (4.9 | ) | - | |||||||
Total investment gains (losses), net | $ | (17.0 | ) | $ | 16.4 | $ | 7.1 |
During fiscal 2009, investment gains (losses), net decreased as compared to fiscal 2008 primarily due to net unrealized losses related to our Adobe Ventures and direct investments.
During fiscal 2008, investment gains (losses), net increased as compared to fiscal 2007 due primarily to investment gains from our direct and Adobe Ventures investments. Additionally, during fiscal 2008, we received cash and recognized a gain resulting from the expiration of the escrow period related to the sale of our investment in Atom Entertainment, Inc. that occurred during the fourth quarter of fiscal 2006.
Provision for Income Tax es (dollars in millions)
Fiscal 2009 | % Change 2009 to 2008 | Fiscal 2008 | % Change 2008 to 2007 | Fiscal 2007 | ||||||||||||||
Provision | $ | 315.0 | 52 | % | $ | 206.7 | (7 | )% | $ | 223.4 | ||||||||
Percentage of total revenue | 11 | % | 6 | % | 7 | % | ||||||||||||
Effective tax rate | 45 | % | 19 | % | 24 | % | ||||||||||||
Our effective tax rate increased approximately twenty-six percentage points during fiscal 2009 as compared to fiscal 2008. The increase was primarily due to a one-time charge that was related to our acquisition of Omniture. The charge was the tax cost of inter-company transactions necessary to license certain Omniture assets to Adobe's trading companies, so that Omniture's services can be offered to customers from Adobe companies.
65
TABLE OF CONTENTS
LIQUIDITY AND CAPITAL RESOURCES
This data should be read in conjunction with the Consolidated Statements of Cash Flows.
(in millions) | Fiscal 2009 | Fiscal 2008 | ||||||
Cash, cash equivalents and short-term investments | $ | 1,904.5 | $ | 2,019.2 | ||||
Working capital | $ | 1,629.1 | $ | 1,972.5 | ||||
Stockholders' equity | $ | 4,890.6 | $ | 4,410.4 |
Summary of our cash flows is as follows (in millions):
Fiscal 2009 | Fiscal 2008 | Fiscal 2007 | ||||||||||
Net cash provided by operating activities | $ | 1,117.7 | $ | 1,280.7 | $ | 1,441.1 | ||||||
Net cash (used for) provided by investing activities | (1,497.1 | ) | (304.7 | ) | 81.5 | |||||||
Net cash provided by (used for) financing activities | 477.7 | (1,021.6 | ) | (1,350.4 | ) | |||||||
Effect of foreign currency exchange rates on cash and cash equivalents | 14.7 | (14.4 | ) | 1.7 | ||||||||
Net increase (decrease) in cash and cash equivalents | $ | 113.0 | $ | (60.0 | ) | $ | 173.9 |
Our primary source of cash is receipts from revenue. The primary uses of cash are payroll related expenses; general operating expenses including marketing, travel and office rent; and cost of product revenue. Another source of cash is proceeds from the exercise of employee options and participation in the employee stock purchase plan ("ESPP"). Another use of cash is our stock repurchase program, which is described below.
Cash flows from operating activities
Net cash provided by operating activities of $1.1 billion for fiscal 2009, was primarily comprised of net income plus the net effect of non-cash expenses. The primary working capital sources of cash were net income coupled with decreases in trade receivables, prepaid expenses and other current assets and increases in income taxes payable. Trade receivables decreased primarily from CS4 revenue that was shipped in the latter half of the fourth quarter of fiscal 2008 and collected during the first quarter of fiscal 2009, in addition to lower overall gross revenue and improved collections.
The primary working capital uses of cash were decreases in accrued expenses, deferred revenue, trade payables and accrued restructuring. Accrued expenses decreased primarily due to payments for employee bonuses and commissions related to fiscal 2008. Decreases in deferred revenue related primarily to deferred revenue that was recognized in the first quarter of fiscal 2009 associated with our free of charge upgrades for CS4 and Adobe Photoshop Lightroom products, as well as declines in maintenance and support orders. Accrued restructuring decreased primarily due to payments related to the 2008 restructuring program that was initiated in the fourth quarter of fiscal 2008, offset in part by new charges related to our 2009 restructuring program and acquisition of Omniture.
Net cash provided by operating activities of $1.3 billion for fiscal 2008, was primarily comprised of net income plus the net effect of non-cash expenses. The primary working capital sources of cash were increases in net income, deferred revenue, accrued restructuring and trade payables. Increases in deferred revenue related to maintenance and support and free of charge upgrade plan purchases which offset in part, decreases in deferred revenue related to royalties. Accrued restructuring costs increased due to the restructuring program initiated in the fourth quarter of fiscal 2008 offset in part by payments of facility costs during fiscal 2008 associated with the Macromedia acquisition. See Note 11 of our Notes to Consolidated Financial Statements for information regarding our restructuring charges.
The primary working capital uses of cash were increases in trade receivables and prepaid expenses and other current assets coupled with decreases in income taxes payable and accrued expenses. Trade receivables increased primarily as a result of high sales of our CS4 family of products at the end of fiscal 2008. Income taxes payable decreased primarily due to payments made as the result of the completion of a U.S. income tax examination covering our fiscal years 2001 through 2004. Accrued expenses decreased primarily due to payments for employee bonuses and profit sharing offset in part by increases in royalty accruals and charitable contributions.
Net cash provided by operating activities of $1.4 billion for fiscal 2007, was primarily comprised of net income, net of non-cash related expenses.
66
TABLE OF CONTENTS
The primary working capital sources of cash for fiscal 2007 were increases in net income, accrued expenses, income taxes payable, deferred revenue and trade payables coupled with decreases in trade receivables and prepaid expenses and other current assets. Net changes in accrued expenses was primarily attributable to increases in accrued bonuses and accrued localization costs related to the localization of our CS3 family of products during fiscal 2007. Income taxes payable increased due to overall increased taxable income. Increases to deferred revenue related primarily to deferred maintenance and service revenue due to strong upgrade plan sales in the fourth quarter of fiscal 2007 for our CS3 family of products and related individual creative products. The decrease in trade receivables was due to collections in the first quarter of fiscal 2007 related to high Acrobat 8 sales at the end of fiscal 2006 and strong collections during the third quarter of fiscal 2007 resulting from shipments of our CS3 family of products.
The primary working capital use of cash in fiscal 2007 was a decrease in accrued restructuring costs which was primarily due to payments for facility and severance costs for fiscal 2007.
Cash flows from investing activities
Net cash used for investing activities of $1.5 billion for fiscal 2009, was primarily due to the acquisition of Omniture, purchases of short-term investments and property and equipment, offset in part by maturities and sales of short-term investments. Purchases of long-term investments and other assets during fiscal 2009 were less than fiscal 2008 primarily due to $56.0 million paid in the third quarter of fiscal 2008 for future licensing rights acquired through certain technology licensing arrangements which did not recur in fiscal 2009.
Net cash from investing activities changed from cash provided for fiscal 2007 of $81.5 million to cash used in fiscal 2008 of $304.7 million primarily due to purchases of short-term investments offset in part by maturities and sales of short-term investments. Other uses of cash during fiscal 2008 represented purchases of property and equipment, long-term investments and other assets and one business combination offset in part by proceeds from the sale of other investments in equity securities. The uses associated with the purchase of long-term investments and other assets related primarily to cash paid for future licensing rights acquired through certain technology licensing arrangements totaling $56.0 million in fiscal 2008.
The primary sources of cash from investment activities during fiscal 2007 were sales and maturities of short-term investments offset in part by purchases of short-term investments. The proceeds from the sales of short-term investments were primarily used for stock repurchases. Uses of cash during fiscal 2007 included purchases of property and equipment, purchases of long-term investments and other assets which related primarily to the technology licensing arrangements that occurred during the second quarter of fiscal 2007, the completion of two business combinations and one asset acquisition in fiscal 2007, and the purchase of a portion of the lease receivable totaling $80.4 million associated with our lease extension for the Almaden tower lease. See Note 17 of our Notes to Consolidated Financial Statements for further information regarding this lease extension.
Cash flows from financing activities
Net cash from financing activities changed from cash used in fiscal 2008 of $1.0 billion to cash provided for fiscal 2009 of $477.7 million, primarily due to additional borrowing under our credit agreement of $650.0 million and lower purchases of treasury stock, offset in part by proceeds related to the issuance of treasury stock (See sections entitled "Stock Repurchase Program I" and "Stock Repurchase Program II" discussed below).
Net cash used for financing activities decreased $328.8 million for a total of $1.0 billion in fiscal 2008 as compared to fiscal 2007, primarily due to net borrowings under our credit agreement of $350.0 million. Additionally, we had lower purchases of treasury stock when compared to the prior year (See sections entitled "Stock Repurchase Program I" and "Stock Repurchase Program II" discussed below), offset in part by lower proceeds related to the issuance of treasury stock.
We expect to continue our investing activities, including short-term and long-term investments, venture capital, facilities expansion and purchases of computer systems for research and development, sales and marketing, product support and administrative staff. Furthermore, cash reserves may be used to repurchase stock under our stock repurchase programs and strategically acquire software companies, products or technologies that are complementary to our business. The Board of Directors has approved a facilities expansion for our operations in India, which may include the purchase of land and buildings.
67
TABLE OF CONTENTS
Acquisition of Omniture
On October 23, 2009, we completed the acquisition of Omniture, an industry leader in Web analytics and online business optimization based in Orem, Utah for approximately $1.8 billion. Under the terms of the agreement, we completed our tender offer to acquire all of the outstanding shares of Omniture common stock at a price of $21.50 per share, net to the seller in cash, without interest. We expect to incur significant incremental costs, such as direct costs related to the acquisition and costs associated with restructuring our operations. We believe that our existing cash and cash equivalents, short-term investments and cash generated from operations will be sufficient to meet these cash outlays.
Restructuring
On November 10, 2009, we initiated a restructuring plan to appropriately align our costs in connection with our fiscal 2010 operating plan impacting up to approximately 630 full-time positions worldwide. In connection with this restructuring plan, in the fourth quarter of fiscal 2009, we recorded restructuring charges of approximately $25.5 million related to ongoing termination benefits for the elimination of approximately 340 of these full-time positions worldwide. As of November 27, 2009, approximately $2.5 million was paid. The remaining accrual associated with these ongoing termination benefits is expected to be paid during fiscal 2010. The restructuring activities related to this program are only to those employees and facilities that were associated with Adobe prior to the acquisition of Omniture on October 23, 2009.
Beginning in the first quarter of fiscal 2010, we expect to record approximately $15 million to $18 million primarily related to the consolidation of leased facilities and up to approximately $26 million related to employee severance arrangements for the elimination of the remaining full-time positions worldwide. We expect to accrue the facility related liabilities beginning in the first quarter of fiscal 2010 and pay these liabilities through fiscal 2021 based on current lease terms. Substantially all of these charges will result in cash expenditures.
We completed our acquisition of Omniture on October 23, 2009. In the fourth quarter of fiscal 2009, we initiated a plan to restructure the pre-merger operations of Omniture to eliminate certain duplicative activities, focus our resources on future growth opportunities and reduce our cost structure. In connection with this restructuring plan, we accrued a total of approximately $10.6 million in costs related to termination benefits for the elimination of approximately 100 regular positions and for the closure of duplicative facilities. We also accrued approximately $0.2 million in costs related to the cancellation of certain contracts associated with the wind-down of subsidiaries and other service contracts held by Omniture. These costs were recorded as a part of the purchase price allocation, as discussed in Note 2 of our Notes to Consolidated Financial Statements , and have been accrued for as of November 27, 2009. We expect to pay the termination benefits and facility related liabilities through fiscal 2010 and fiscal 2013, respectively.
Additionally, approximately $1.5 million of restructuring costs related to facilities were included in the liabilities assumed by us upon acquisition of Omniture on October 23, 2009.
In the fourth quarter of fiscal 2008, we initiated a restructuring program, consisting of reductions in workforce of approximately 560 full-time positions globally and the consolidation of facilities, in order to reduce our operating costs and focus our resources on key strategic priorities. In connection with this restructuring program, we recorded restructuring charges in the fourth quarter of fiscal 2008 totaling $29.2 million related to termination benefits for the elimination of approximately 460 of the 560 full-time positions globally.
During fiscal 2009, we continued to implement restructuring activities under this program. We vacated approximately 89,000 square feet of research and development and sales facilities in the U.S., the United Kingdom and Canada. We accrued $8.5 million for the fair value of our future contractual obligations under these operating leases using our credit-adjusted risk-free interest rate, estimated at approximately 6% as of the date we ceased to use the leased properties. This amount is net of the fair value of future estimated sublease income of approximately $4.4 million. We also recorded charges of $6.7 million for ongoing termination benefits for the elimination of substantially all of the remaining 100 full-time positions expected to be terminated. We have paid substantially all of the accrued termination benefits during fiscal 2009 with and expect to pay the remaining amounts in fiscal 2010. We expect to pay facilities-related liabilities through fiscal 2013.
We believe that our existing cash and cash equivalents, short-term investments and cash generated from operations will be sufficient to meet the cash outlays for the restructuring changes described above.
68
TABLE OF CONTENTS
Other Liquidity and Capital Resources Considerations
Our existing cash, cash equivalents and investment balances may further decline during fiscal 2010 in the event of a further weakening of the economy or changes in our planned cash outlay, including changes in incremental costs such as direct and integration costs related to the acquisition. Cash from operations could also be affected by various risks and uncertainties, including, but not limited to the risks detailed in Part I, Item 1A titled "Risk Factors." However, based on our current business plan and revenue prospects, we believe that our existing balances and our anticipated cash flows from operations will be sufficient to meet our working capital and operating resource expenditure requirements for the next twelve months. At November 27, 2009, our existing credit facility is $1.0 billion and we have borrowed against the entire amount. See Note 18 of our Notes to Consolidated Financial Statements for further information regarding our credit agreement.
We use professional investment management firms to manage a large portion of our invested cash. External investment firms managed, on average, 50% of our consolidated invested balances during the fourth quarter of fiscal 2009. Within the U.S., the portfolio is invested primarily in money market funds for working capital purposes. Outside of the U.S., our fixed income portfolio is primarily invested in U.S. Treasury securities.
Stock Repurchase Program I
To facilitate our stock repurchase program, designed to return value to our stockholders and minimize dilution from stock issuances, we repurchase shares in the open market and also enter into structured repurchases with third-parties.
Authorization to repurchase shares to cover on-going dilution is not subject to expiration. However, this repurchase program is limited to covering net dilution from stock issuances and is subject to business conditions and cash flow requirements as determined by our Board of Directors from time to time.
During fiscal 2009, 2008 and 2007 we entered into several structured repurchase agreements with large financial institutions, whereupon we provided the financial institutions with prepayments of $350.0 million, $525.0 million and $1.1 billion, respectively. We entered into these agreements in order to take advantage of repurchasing shares at a guaranteed discount to the Volume Weighted Average Price ("VWAP") of our common stock over a specified period of time. We only enter into such transactions when the discount that we receive is higher than the foregone return on our cash prepayments to the financial institutions. There were no explicit commissions or fees on these structured repurchases. Under the terms of the agreements, there is no requirement for the financial institutions to return any portion of the prepayment to us.
The financial institutions agree to deliver shares to us at monthly intervals during the contract term. The parameters used to calculate the number of shares deliverable are: the total notional amount of the contract, the number of trading days in the contract, the number of trading days in the interval, and the average VWAP of our stock during the interval less the agreed upon discount. During fiscal 2009, we repurchased approximately 15.2 million shares at an average price per share of $27.89 through structured repurchase agreements entered into during fiscal 2008 and fiscal 2009. During fiscal 2008, we repurchased 22.4 million shares at an average price of $36.26 through structured repurchase agreements which included prepayments from fiscal 2007. During fiscal 2007, we repurchased 22.0 million shares at an average price of $40.04 through structured repurchase agreements which included prepayments from fiscal 2006.
During fiscal 2008, we also repurchased 3.6 million shares at an average price of $36.41 in open market transactions.
For fiscal 2009, 2008 and 2007, the prepayments were classified as treasury stock on our Consolidated Balance Sheets at the payment date, though only shares physically delivered to us by November 27, 2009, November 28, 2008 and November 30, 2007 were excluded from the denominator in the computation of earnings per share. As of November 27, 2009 and November 28, 2008, approximately $59.9 million and $134.7 million, respectively, of up-front payments remained under the agreements.
See Item 5, Market for Registrant's Common Equity, Related Stockholder Matters and Issuer Purchases of Equity Securities, for share repurchases during the quarter ended November 27, 2009.
Stock Repurchase Program II
Under this stock repurchase program, we had authorization to repurchase an aggregate of 50.0 million shares of our common stock. From the inception of the 50.0 million share authorization under this program, we provided prepayments of $1.9 billion under structured share repurchase agreements to large financial institutions. During the third quarter of fiscal 2008, the remaining authorized number of shares were repurchased.
69
TABLE OF CONTENTS
During fiscal 2008, we provided prepayments of $1.0 billion and repurchased 31.9 million shares under these structured agreements at an average price of $37.15. During fiscal 2007, we provided prepayments of $850.0 million under structured share repurchase agreements to large financial institutions. During fiscal 2007, we repurchased 17.7 million shares under these structured agreements at an average price of $40.50 and approximately $133.7 million of up-front payments remained under these agreements as of November 30, 2007.
During fiscal 2008, we also repurchased 0.5 million shares at an average price of $39.79 in open market transactions.
Summary of Stock Repurchases for fiscal 2009, 2008 and 2007
(in thousands, except average amounts)
Board Approval | Repurchases | 2009 | 2008 | 2007 | ||||||||||||||||||||
Date | Under the Plan | Shares | Average | Shares | Average | Shares | Average | |||||||||||||||||
December 1997 | From employees (1) | 1 | $ | 24.00 | 5 | $ | 34.89 | 39 | $ | 39.24 | ||||||||||||||
Open market | - | $ | - | 3,554 | $ | 36.41 | - | $ | - | |||||||||||||||
Structured repurchases (2) | 15,231 | $ | 27.89 | 22,418 | $ | 36.26 | 22,012 | $ | 40.04 | |||||||||||||||
April 2007 | Structured repurchases (2) | - | $ | - | 31,859 | $ | 37.15 | 17,684 | $ | 40.50 | ||||||||||||||
Open market | - | $ | - | 456 | $ | 39.79 | - | $ | - | |||||||||||||||
Total shares | 15,232 | $ | 27.89 | 58,292 | $ | 36.79 | 39,735 | $ | 40.25 | |||||||||||||||
Total cost | $ | 424,851 | $ | 2,144,400 | $ | 1,599,214 | ||||||||||||||||||
(1) | The repurchases from employees represent shares cancelled when surrendered in lieu of cash payments for the option exercise price or withholding taxes due. |
(2) | Stock repurchase agreements executed with large financial institutions. See "Stock Repurchase Program I" and "Stock Repurchase Program II" above. |
Off-Balance Sheet Arrangements and Aggregate Contractual Obligations
Our principal commitments as of November 27, 2009, consist of obligations under operating leases, royalty agreements and various service agreements. See Note 17 of our Notes to Consolidated Financial Statements for additional information regarding our contractual commitments .
Contractual Obligations
The following table summarizes our contractual obligations as of November 27, 2009 (in millions):
| Payment Due by Period | ||||||||||||||||||||
Total | Less than 1 year | 1-3 years | 3-5 years | More than 5 years | ||||||||||||||||
Operating leases | $ | 249.3 | $ | 53.2 | $ | 74.7 | $ | 44.8 | $ | 76.6 | ||||||||||
Purchase obligations | 210.5 | 165.5 | 26.0 | 6.0 | 13.0 | |||||||||||||||
Debt | 1,000.0 | - | - | 1,000.0 | - | |||||||||||||||
Total | $ | 1,459.8 | $ | 218.7 | $ | 100.7 | $ | 1,050.8 | $ | 89.6 | ||||||||||
As of November 27, 2009, the principal outstanding under the credit agreement was $1.0 billion which is due in full no later than February 16, 2013. Interest associated with this agreement cannot be estimated with certainty by period throughout the term since it is based on a fluctuating interest rate calculation. Our credit facility contains a financial covenant requiring us not to exceed a certain maximum leverage ratio.
Our leases for the East and West Towers and the Almaden Tower are both subject to standard covenants including certain financial ratios as defined in the lease agreements that are reported to the lessors quarterly. As of November 27, 2009, we were in compliance with all of our covenants. We believe these covenants will not impact our credit or cash in the coming fiscal year or restrict our ability to execute our business plan.
Under the terms of our credit agreement and lease agreements, we are not prohibited from paying cash dividends unless payment would trigger an event of default or one currently exists.
70
TABLE OF CONTENTS
The gross liability for unrecognized tax benefits at November 27, 2009 was $218.0 million, exclusive of interest and penalties. The timing of the resolution of income tax examinations is highly uncertain as are the amounts and timing of tax payments that are part of any audit settlement process. These events could cause large fluctuations in the balance sheet classification of current and non-current assets and liabilities. We believe that before the end of fiscal 2010, it is reasonably possible that either certain audits will conclude or statutes of limitations on certain income tax examination periods will expire, or both. Given the uncertainties described above, we can only determine a range of estimated potential decreases in underlying unrecognized tax benefits equal to $0 to approximately $10.0 million. These amounts would decrease income tax expense under accounting for income taxes and as a result of the revised accounting guidance for business combinations in fiscal 2010. See Note 1 of our Notes to Consolidated Financial Statements. Under the revised accounting guidance for business combinations, adjustments to acquired income tax liabilities (including adjustments for acquisitions completed prior to the effective date) that are recorded subsequent to the acquisition date will be recognized in income from continuing operations, with certain exceptions, if such changes occur after the measurement period.
Royalties
We have certain royalty commitments associated with the shipment and licensing of certain products. Royalty expense is generally based on a dollar amount per unit shipped or a percentage of the underlying revenue.
Guarantees
The lease agreements for our corporate headquarters provide for residual value guarantees. The fair value of a residual value guarantee in lease agreements entered into after December 31, 2002, must be recognized as a liability on our Consolidated Balance Sheets. As such, we recognized $5.2 million and $3.0 million in liabilities, related to the extended East and West Towers and Almaden Tower leases, respectively. These liabilities are recorded in other long-term liabilities with the offsetting entry recorded as prepaid rent in other assets. The balance will be amortized to our Consolidated Statements of Income over the life of the leases. As of November 27, 2009, the unamortized portion of the fair value of the residual value guarantees remaining in other long-term liabilities and prepaid rent was $1.3 million.
Indemnifications
In the normal course of business, we provide indemnifications of varying scope to customers against claims of intellectual property infringement made by third-parties arising from the use of our products. Historically, costs related to these indemnification provisions have not been significant and we are unable to estimate the maximum potential impact of these indemnification provisions on our future results of operations.
To the extent permitted under Delaware law, we have agreements whereby we indemnify our directors and officers for certain events or occurrences while the director or officer is, or was serving, at our request in such capacity. The indemnification period covers all pertinent events and occurrences during the director's or officer's lifetime. The maximum potential amount of future payments we could be required to make under these indemnification agreements is unlimited; however, we have director and officer insurance coverage that limits our exposure and enables us to recover a portion of any future amounts paid. We believe the estimated fair value of these indemnification agreements in excess of applicable insurance coverage is minimal.
As part of our limited partnership interests in Adobe Ventures, we have provided a general indemnification to Granite Ventures, an independent venture capital firm and sole general partner of Adobe Ventures, for certain events or occurrences while Granite Ventures is, or was serving, at our request in such capacity provided that Granite Ventures acts in good faith on behalf of the partnership. We are unable to develop an estimate of the maximum potential amount of future payments that could potentially result from any hypothetical future claim, but believe the risk of having to make any payments under this general indemnification to be remote.
Recent Accounting Pronouncements
See Note 1 of our Notes to Consolidated Financial Statements for information regarding the effect of new accounting pronouncements on our financial statements.
71
TABLE OF CONTENTS
ITEM 7A. QUANTITATIVE AND QUALITATIVE DISCLOSURES ABOUT MARKET RISK
All market risk sensitive instruments were entered into for non-trading purposes.
Foreign Currency Risk
Foreign Currency Hedging Instruments
In countries outside the U.S., we transact business, in U.S. dollars and in various other currencies. In Europe and Japan, transactions that are denominated in Euro and Yen, respectively, are subject to exposure from movements in exchange rates. We hedge our net recognized foreign currency assets and liabilities with foreign exchange forward contracts to reduce the risk that our earnings and cash flows will be adversely affected by changes in exchange rates. We may use foreign exchange option or forward contracts for Euro- or Yen-denominated revenue.
In fiscal 2009, 2008 and 2007, our revenue exposures were 504.3 million Euros, 628.2 million Euros and 595.5 million Euros, respectively. In fiscal 2009, 2008 and 2007, our revenue exposures were 30.3 billion Yen, 36.8 billion Yen and 35.5 billion Yen, respectively.
Our European operating expenses are primarily in Euro and our Japanese operating expenses are in Yen, which mitigates a portion of the exposure related to Euro and Yen denominated product revenue. In addition, we hedge firmly committed transactions using forward contracts. These contracts do subject us to risk of accounting gains and losses; however, the gains and losses on these contracts largely offset gains and losses on the assets, liabilities and transactions being hedged. We also hedge a percentage of forecasted international revenue with purchased option contracts and forward contracts. Our revenue hedging policy is intended to help mitigate the impact on our forecasted revenue due to foreign currency exchange rate movements. As of November 27, 2009, total outstanding contracts were $510.4 million which included the notional equivalent of $283.9 million in Euro, 182.1 million in Yen and $44.4 million in other foreign currencies. These hedges are foreign currency forward exchange contracts which hedged our balance sheet exposures and purchased put option contracts which hedged our forecasted revenue. As of November 27, 2009, all contracts were set to expire at various times through July 2010. The bank counterparties in these contracts expose us to credit-related losses in the event of their nonperformance. However, to mitigate that risk, we only contract with counterparties who meet our minimum requirements under our counterparty risk assessment process. In addition, our hedging policy establishes maximum limits for each counterparty.
In addition, we also have long-term investment exposures consisting of the capitalization and retained earnings in our non-USD functional currency foreign subsidiaries. As of November 27, 2009 and November 28, 2008, this long-term investment exposure totaled a notional equivalent of $228.8 million and $149.1 million, respectively. At this time, we do not hedge these long-term investment exposures.
Economic Hedging-Hedges of Forecasted Transactions
We may use foreign exchange option contracts or forward contracts to hedge certain operational ("cash flow") exposures resulting from changes in foreign currency exchange rates. These foreign exchange contracts, carried at fair value, may have maturities between one and twelve months. Such cash flow exposures result from portions of our forecasted revenue denominated in currencies other than the U.S. dollar, primarily the Euro and the Japanese Yen. We enter into these foreign exchange contracts to hedge forecasted product licensing revenue in the normal course of business and accordingly, they are not speculative in nature.
We record changes in the intrinsic value of these cash flow hedges in accumulated other comprehensive income, until the forecasted transaction occurs. When the forecasted transaction occurs, we reclassify the related gain or loss on the cash flow hedge to revenue. In the event the underlying forecasted transaction does not occur, or it becomes probable that it will not occur, we reclassify the gain or loss on the related cash flow hedge from accumulated other comprehensive income to interest and other income, net on our Consolidated Statements of Income at that time. For the fiscal year ended November 27, 2009, there were no such net gains or losses recognized in other income relating to hedges of forecasted transactions that did not occur.
See Note 5 of our Notes to Consolidated Financial Statements for information regarding our hedging activities.
Balance Sheet Hedging-Hedging of Foreign Currency Assets and Liabilities
We hedge our net recognized foreign currency assets and liabilities with foreign exchange forward contracts to reduce the risk that our earnings and cash flows will be adversely affected by changes in foreign currency exchange rates. These derivative instruments hedge assets and liabilities that are denominated in foreign currencies and are carried at fair value with
72
TABLE OF CONTENTS
changes in the fair value recorded as interest and other income, net. These derivative instruments do not subject us to material balance sheet risk due to exchange rate movements because gains and losses on these derivatives are intended to offset gains and losses on the assets and liabilities being hedged. At November 27, 2009, the outstanding balance sheet hedging derivatives had maturities of 90 days or less.
A sensitivity analysis was performed on all of our foreign exchange derivatives as of November 27, 2009. This sensitivity analysis was based on a modeling technique that measures the hypothetical market value resulting from a 10% shift in the value of exchange rates relative to the U.S. dollar. For option contracts, the Black-Scholes equation model was used. For forward contracts, duration modeling was used where hypothetical changes are made to the spot rates of the currency. A 10% increase in the value of the U.S. dollar (and a corresponding decrease in the value of the hedged foreign currency asset) would lead to an increase in the fair value of our financial hedging instruments by $22.2 million. Conversely, a 10% decrease in the value of the U.S. dollar would result in a decrease in the fair value of these financial instruments by $12.9 million.
We do not use derivative financial instruments for speculative trading purposes, nor do we hedge our foreign currency exposure in a manner that entirely offsets the effects of changes in foreign exchange rates.
As a general rule, we do not use financial instruments to hedge local currency denominated operating expenses in countries where a natural hedge exists. For example, in many countries, revenue from the local currency product licenses substantially offsets the local currency denominated operating expenses. We assess the need to utilize financial instruments to hedge currency exposures, primarily related to operating expenses, on an ongoing basis.
We regularly review our hedging program and may as part of this review determine to change our hedging program.
See Note 5 of our Notes to Consolidated Financial Statements for information regarding our hedging activities.
Interest Rate Risk
Short-Term Investments and Fixed Income Securities
At November 27, 2009, we had debt securities classified as short-term investments of $900.0 million. Changes in interest rates could adversely affect the market value of these investments. The following table separates these investments, based on stated maturities, to show the approximate exposure to interest rates (in millions):
Due within one year | $ | 387.6 | ||
Due within two years | 249.9 | |||
Due within three years | 218.6 | |||
Due after three years | 43.9 | |||
Total | $ | 900.0 |
A sensitivity analysis was performed on our investment portfolio as of November 27, 2009. The analysis is based on an estimate of the hypothetical changes in market value of the portfolio that would result from an immediate parallel shift in the yield curve of various magnitudes.
The following tables present the hypothetical fair values of our debt securities classified as short-term investments assuming immediate parallel shifts in the yield curve of 50 basis points ("BPS"), 100 BPS and 150 BPS. The analysis is shown as of November 27, 2009 and November 28, 2008 (dollars in millions):
-150 BPS | -100 BPS | -50 BPS | Fair Value 11/27/2009 | +50 BPS | +100 BPS | +150 BPS |
910.8 | 909.2 | 905.4 | 900.0 | 893.9 | 888.0 | 882.2 |
-150 BPS | -100 BPS | -50 BPS | Fair Value 11/28/2008 | +50 BPS | +100 BPS | +150 BPS |
1,145.8 | 1,142.3 | 1,136.4 | 1,129.7 | 1,123.0 | 1,116.4 | 1,109.9 |
73
TABLE OF CONTENTS
Other Market Risk
Privately Held Long-Term Investments
The privately held companies in which we invest, can still be considered in the start-up or development stages which are inherently risky. The technologies or products these companies have under development are typically in the early stages and may never materialize, which could result in a loss of a substantial part of our initial investment in these companies. The evaluation of privately held companies is based on information that we request from these companies which is not subject to the same disclosure regulations as U.S. publicly traded companies and as such, the basis for these evaluations is subject to the timing and accuracy of the data received from these companies.
See Note 4 and Note 8 of our Notes to Consolidated Financial Statements for information regarding our limited partnership interest in Adobe Ventures.
Short-Term Investments and Marketable Equity Securities
We are exposed to equity price risk on our portfolio of marketable equity securities. As of November 27, 2009, our total equity holdings in publicly traded companies were valued at $5.0 million compared to $3.0 million at November 28, 2008. The increase was primarily due to the change in the fair value of our equity holdings during fiscal 2009.
The following table represents the potential decrease in fair values of our marketable equity securities as of November 27, 2009, that are sensitive to changes in the stock market. Fair value deteriorations of 50%, 35% and 15% were selected for illustrative purposes because none is more likely to occur than another.
(in millions) | 50% | 35% | 15% | |||||||||
Marketable equity securities | $ | (2.5 | ) | $ | (1.7 | ) | $ | (0.8 | ) |
74
TABLE OF CONTENTS
ITEM 8. FINANCIAL STATEMENTS AND SUPPLEMENTARY DATA
INDEX TO CONSOLIDATED FINANCIAL STATEMENTS
Page | ||
Consolidated Balance Sheets | 76 | |
Consolidated Statements of Income | 77 | |
Consolidated Statements of Stockholders' Equity and Comprehensive Income | 78 | |
Consolidated Statements of Cash Flows | 79 | |
Notes to Consolidated Financial Statements | 80 | |
Report of KPMG LLP, Independent Registered Public Accounting Firm | 122 |
All financial statement schedules have been omitted, since the required information is not applicable or is not present in amounts sufficient to require submission of the schedule, or because the information required is included in the Consolidated Financial Statements and Notes thereto.
75
TABLE OF CONTENTS
ADOBE SYSTEMS INCORPORATED
CONSOLIDATED BALANCE SHEETS
(In thousands, except par value)
November 27, | November 28, | |||||||
2009 | 2008 | |||||||
ASSETS | ||||||||
Current assets: | ||||||||
Cash and cash equivalents | $ | 999,487 | $ | 886,450 | ||||
Short-term investments | 904,986 | 1,132,752 | ||||||
Trade receivables, net of allowances for doubtful accounts of $15,225 and $4,128, respectively | 410,879 | 467,234 | ||||||
Deferred income taxes | 77,417 | 110,713 | ||||||
Prepaid expenses and other current assets | 80,855 | 137,954 | ||||||
Total current assets | 2,473,624 | 2,735,103 | ||||||
Property and equipment, net | 388,132 | 313,037 | ||||||
Goodwill | 3,494,589 | 2,134,730 | ||||||
Purchased and other intangibles, net | 527,388 | 214,960 | ||||||
Investment in lease receivable | 207,239 | 207,239 | ||||||
Other assets | 191,265 | 216,529 | ||||||
Total assets | $ | 7,282,237 | $ | 5,821,598 | ||||
LIABILITIES AND STOCKHOLDERS' EQUITY | ||||||||
Current liabilities: | ||||||||
Trade payables | $ | 58,904 | $ | 55,840 | ||||
Accrued expenses | 419,646 | 399,969 | ||||||
Accrued restructuring | 37,793 | 35,690 | ||||||
Income taxes payable | 46,634 | 27,136 | ||||||
Deferred revenue | 281,576 | 243,964 | ||||||
Total current liabilities | 844,553 | 762,599 | ||||||
Long-term liabilities: | ||||||||
Debt | 1,000,000 | 350,000 | ||||||
Deferred revenue | 36,717 | 31,356 | ||||||
Accrued restructuring | 6,921 | 6,214 | ||||||
Income taxes payable | 223,528 | 123,182 | ||||||
Deferred income taxes | 252,486 | 117,328 | ||||||
Other liabilities | 27,464 | 20,565 | ||||||
Total liabilities | 2,391,669 | 1,411,244 | ||||||
Commitments and contingencies | ||||||||
Stockholders' equity: | ||||||||
Preferred stock, $0.0001 par value; 2,000 shares authorized; none issued | - | - | ||||||
Common stock, $0.0001 par value; 900,000 shares authorized; 600,834 shares issued; 522,657 and 526,111shares outstanding, respectively | 61 | 61 | ||||||
Additional paid-in-capital | 2,390,061 | 2,396,819 | ||||||
Retained earnings | 5,299,914 | 4,913,406 | ||||||
Accumulated other comprehensive income | 24,446 | 57,222 | ||||||
Treasury stock, at cost (78,177 and 74,723 shares, respectively), net of re-issuances | (2,823,914 | ) | (2,957,154 | ) | ||||
Total stockholders' equity | 4,890,568 | 4,410,354 | ||||||
Total liabilities and stockholders' equity | $ | 7,282,237 | $ | 5,821,598 |
See accompanying Notes to Consolidated Financial Statements.
76
TABLE OF CONTENTS
ADOBE SYSTEMS INCORPORATED
CONSOLIDATED STATEMENTS OF INCOME
(In thousands, except per share data)
| Years Ended | ||||||||||||
November 27, 2009 | November 28, 2008 | November 30, 2007 | ||||||||||
Revenue: | ||||||||||||
Products | $ | 2,759,391 | $ | 3,396,542 | $ | 3,019,524 | ||||||
Services and support | 186,462 | 183,347 | 138,357 | |||||||||
Total revenue | 2,945,853 | 3,579,889 | 3,157,881 | |||||||||
Cost of revenue: | ||||||||||||
Products | 228,897 | 266,389 | 270,818 | |||||||||
Services and support | 67,835 | 96,241 | 83,876 | |||||||||
Total cost of revenue | 296,732 | 362,630 | 354,694 | |||||||||
Gross profit | 2,649,121 | 3,217,259 | 2,803,187 | |||||||||
Operating expenses: | ||||||||||||
Research and development | 565,141 | 662,057 | 613,242 | |||||||||
Sales and marketing | 981,903 | 1,089,341 | 984,388 | |||||||||
General and administrative | 298,749 | 337,291 | 274,982 | |||||||||
Restructuring charges | 41,260 | 32,053 | 555 | |||||||||
Amortization of purchased intangibles and incomplete technology | 71,555 | 68,246 | 72,435 | |||||||||
Total operating expenses | 1,958,608 | 2,188,988 | 1,945,602 | |||||||||
Operating income | 690,513 | 1,028,271 | 857,585 | |||||||||
Non-operating income (expense): | ||||||||||||
Interest and other income, net | 31,380 | 43,847 | 82,724 | |||||||||
Interest expense | (3,407 | ) | (10,019 | ) | (253 | ) | ||||||
Investment gains (losses), net | (16,966 | ) | 16,409 | 7,134 | ||||||||
Total non-operating income (expense), net | 11,007 | 50,237 | 89,605 | |||||||||
Income before income taxes | 701,520 | 1,078,508 | 947,190 | |||||||||
Provision for income taxes | 315,012 | 206,694 | 223,383 | |||||||||
Net income | $ | 386,508 | $ | 871,814 | $ | 723,807 | ||||||
Basic net income per share | $ | 0.74 | $ | 1.62 | $ | 1.24 | ||||||
Shares used in computing basic income per share | 524,470 | 539,373 | 584,203 | |||||||||
Diluted net income per share | $ | 0.73 | $ | 1.59 | $ | 1.21 | ||||||
Shares used in computing diluted income per share | 530,610 | 548,553 | 598,775 | |||||||||
See accompanying Notes to Consolidated Financial Statements.
77
TABLE OF CONTENTS
ADOBE SYSTEMS INCORPORATED
CONSOLIDATED STATEMENTS OF STOCKHOLDERS' EQUITY AND COMPREHENSIVE INCOME
(In thousands)
Common Stock | Additional Paid-In | Retained | Accumulated Other Comprehensive | Treasury Stock | ||||||||||||||||
Shares | Amount | Capital | Earnings | Income | Shares | Amount | Total | |||||||||||||
Balances at December 1, 2006 | 600,834 | $ | 61 | $ | 2,451,610 | $ | 3,317,785 | $ | 6,344 | (13,608 | ) | $ | (623,924 | ) | $ | 5,151,876 | ||||
Comprehensive income: | ||||||||||||||||||||
Net income | - | - | - | 723,807 | - | - | - | 723,807 | ||||||||||||
Other comprehensive income, net of taxes | - | - | - | - | 21,604 | - | - | 21,604 | ||||||||||||
Total comprehensive income, net of taxes | - | - | - | - | - | - | - | 745,411 | ||||||||||||
Re-issuance of treasury stock under stock compensation plans | - | - | (298,776 | ) | - | - | 23,918 | 814,863 | 516,087 | |||||||||||
Tax benefit from employee stock option plans | - | - | 66,966 | - | - | - | - | 66,966 | ||||||||||||
Purchase of treasury stock | - | - | - | - | - | (39,735 | ) | (1,951,527 | ) | (1,951,527 | ) | |||||||||
Stock-based compensation | - | - | 149,987 | - | - | - | - | 149,987 | ||||||||||||
Adjustment to the valuation of Macromedia assumed options | - | - | (28,818 | ) | - | - | - | - | (28,818 | ) | ||||||||||
Balances at November 30, 2007 | 600,834 | $ | 61 | $ | 2,340,969 | $ | 4,041,592 | $ | 27,948 | (29,425 | ) | $ | (1,760,588 | ) | $ | 4,649,982 | ||||
Comprehensive income: | ||||||||||||||||||||
Net income | - | - | - | 871,814 | - | - | - | 871,814 | ||||||||||||
Other comprehensive income, net of taxes | - | - | - | - | 29,274 | - | - | 29,274 | ||||||||||||
Total comprehensive income, net of taxes | - | - | - | - | - | - | - | 901,088 | ||||||||||||
Re-issuance of treasury stock under stock compensation plans | - | - | (206,984 | ) | - | - | 12,994 | 526,149 | 319,165 | |||||||||||
Tax benefit from employee stock option plans | - | - | 90,360 | - | - | - | - | 90,360 | ||||||||||||
Purchase of treasury stock | - | - | - | - | - | (58,292 | ) | (1,722,715 | ) | (1,722,715 | ) | |||||||||
Stock-based compensation | - | - | 172,474 | - | - | - | - | 172,474 | ||||||||||||
Balances at November 28, 2008 | 600,834 | $ | 61 | $ | 2,396,819 | $ | 4,913,406 | $ | 57,222 | (74,723 | ) | $ | (2,957,154 | ) | $ | 4,410,354 | ||||
Comprehensive income: | ||||||||||||||||||||
Net income | - | - | - | 386,508 | - | - | - | 386,508 | ||||||||||||
Other comprehensive income, net of taxes | - | - | - | - | (32,776) | - | - | (32,776) | ||||||||||||
Total comprehensive income, net of taxes | - | - | - | - | - | - | - | 353,732 | ||||||||||||
Re-issuance of treasury stock under stock compensation plans | - | - | (303,688 | ) | - | - | 11,777 | 483,254 | 179,566 | |||||||||||
Tax benefit from employee stock option plans | - | - | 44,381 | - | - | - | - | 44,381 | ||||||||||||
Purchase of treasury stock | - | - | - | - | - | (15,231 | ) | (350,014 | ) | (350,014 | ) | |||||||||
Equity awards assumed for acquisition | - | - | 84,968 | - | - | - | - | 84,968 | ||||||||||||
Stock-based compensation | - | - | 167,581 | - | - | - | - | 167,581 | ||||||||||||
Balances at November 27, 2009 | 600,834 | $ | 61 | $ | 2,390,061 | $ | 5,299,914 | $ | 24,446 | (78,177 | ) | $ | (2,823,914 | ) | $ | 4,890,568 | ||||
See accompanying Notes to Consolidated Financial Statements.
78
TABLE OF CONTENTS
ADOBE SYSTEMS INCORPORATED
CONSOLIDATED STATEMENTS OF CASH FLOWS
(In thousands)
| Years Ended | ||||||||||||
November 27, 2009 | November 28, 2008 | November 30, 2007 | ||||||||||
Cash flows from operating activities: | ||||||||||||
Net income | $ | 386,508 | $ | 871,814 | $ | 723,807 | ||||||
Adjustments to reconcile net income to net cash provided by operating activities: | ||||||||||||
Depreciation, amortization and accretion | 282,423 | 270,269 | 315,464 | |||||||||
Stock-based compensation | 167,581 | 172,474 | 149,987 | |||||||||
Deferred income taxes | 49,590 | 46,584 | 58,385 | |||||||||
Unrealized losses (gains) on investments | 11,623 | (17,377 | ) | (6,776 | ) | |||||||
Tax benefit from employee stock option plans | 44,381 | 90,360 | 55,074 | |||||||||
Other non-cash items | 4,434 | 4,784 | (176 | ) | ||||||||
Excess tax benefits from stock-based compensation | (11,980 | ) | (31,983 | ) | (85,050 | ) | ||||||
Changes in operating assets and liabilities, net of acquired assets and assumed liabilities: | ||||||||||||
Trade receivables, net | 172,287 | (153,386 | ) | 46,332 | ||||||||
Prepaid expenses and other current assets | 21,814 | (5,584 | ) | 6,418 | ||||||||
Trade payables | (13,601 | ) | 14,078 | 3,518 | ||||||||
Accrued expenses | (53,320 | ) | (13,904 | ) | 83,281 | |||||||
Accrued restructuring | (8,446 | ) | 24,330 | (13,796 | ) | |||||||
Income taxes payable | 109,620 | (57,656 | ) | 61,448 | ||||||||
Deferred revenue | (45,142 | ) | 65,879 | 43,137 | ||||||||
Net cash provided by operating activities | 1,117,772 | 1,280,682 | 1,441,053 | |||||||||
Cash flows from investing activities: | ||||||||||||
Purchases of short-term investments | (1,307,366 | ) | (2,381,533 | ) | (2,503,147 | ) | ||||||
Maturities of short-term investments | 464,031 | 1,568,874 | 516,839 | |||||||||
Proceeds from sales of short-term investments | 1,057,176 | 717,076 | 2,457,347 | |||||||||
Purchases of property and equipment | (119,592 | ) | (111,792 | ) | (132,075 | ) | ||||||
Acquisitions, net of cash acquired | (1,582,669 | ) | (3,584 | ) | (75,528 | ) | ||||||
Purchases of long-term investments and other assets | (29,143 | ) | (124,469 | ) | (111,939 | ) | ||||||
Investment in lease receivable | - | - | (80,439 | ) | ||||||||
Issuance costs for credit facility | - | - | (856 | ) | ||||||||
Proceeds from sale of long-term investments | 17,696 | 30,747 | 11,342 | |||||||||
Other | 2,771 | - | - | |||||||||
Net cash (used for) provided by investing activities | (1,497,096 | ) | (304,681 | ) | 81,544 | |||||||
Cash flows from financing activities: | ||||||||||||
Purchases of treasury stock | (350,013 | ) | (1,722,715 | ) | (1,951,527 | ) | ||||||
Proceeds from issuance of treasury stock | 179,566 | 319,165 | 516,087 | |||||||||
Excess tax benefits from stock-based compensation | 11,980 | 31,983 | 85,050 | |||||||||
Proceeds from borrowings on credit facility | 650,000 | 800,000 | - | |||||||||
Repayments of borrowings on credit facility | - | (450,000 | ) | - | ||||||||
Repayments of acquired debt | (13,875 | ) | - | - | ||||||||
Net cash provided by (used for) financing activities | 477,658 | (1,021,567 | ) | (1,350,390 | ) | |||||||
Effect of foreign currency exchange rates on cash and cash equivalents | 14,703 | (14,406 | ) | 1,715 | ||||||||
Net increase (decrease) in cash and cash equivalents | 113,037 | (59,972 | ) | 173,922 | ||||||||
Cash and cash equivalents at beginning of year | 886,450 | 946,422 | 772,500 | |||||||||
Cash and cash equivalents at end of year | $ | 999,487 | $ | 886,450 | $ | 946,422 | ||||||
Supplemental disclosures: | ||||||||||||
Cash paid for income taxes, net of refunds | $ | 105,158 | $ | 126,299 | $ | 55,236 | ||||||
Cash paid for interest | $ | 2,088 | $ | 9,604 | $ | - | ||||||
Non-cash investing activities: | ||||||||||||
Issuance of common stock and stock awards assumed in business acquisitions | $ | 84,968 | $ | - | $ | - | ||||||
See accompanying Notes to Consolidated Financial Statements.
79
TABLE OF CONTENTS
ADOBE SYSTEMS INCORPORATED
NOTES TO CONSOLIDATED FINANCIAL STATEMENTS
NOTE 1. SIGNIFICANT ACCOUNTING POLICIES
Operations
Founded in 1982, Adobe Systems Incorporated is one of the largest and most diversified software companies in the world. We offer a line of creative, business, Web and mobile software and services used by creative professionals, knowledge workers, consumers, original equipment manufacturers ("OEMs"), developers and enterprises for creating, managing, delivering, optimizing and engaging with compelling content and experiences across multiple operating systems, devices and media. We distribute our products through a network of distributors, value-added resellers ("VARs"), systems integrators, independent software vendors ("ISVs") and OEMs, direct to end users and through our own Website at www.adobe.com. We also license our technology to hardware manufacturers, software developers and service providers, and we offer integrated software solutions to businesses of all sizes. We have operations in the Americas, Europe, Middle East and Africa ("EMEA") and Asia. Our software runs on personal computers with Microsoft Windows, Apple Mac OS, Linux, UNIX and various non-PC platforms, depending on the product.
Basis of Presentation
The accompanying Consolidated Financial Statements include those of Adobe and its subsidiaries, after elimination of all intercompany accounts and transactions. We have prepared the accompanying Consolidated Financial Statements in accordance with accounting principles generally accepted in the United States of America ("GAAP") and pursuant to the rules and regulations of the Securities and Exchange Commission ("SEC").
Use of Estimates |
In preparation of consolidated financial statements and related disclosures in conformity with GAAP and pursuant to the rules and regulations of the SEC, we must make estimates and judgments that affect the amounts reported in the Consolidated Financial Statements and accompanying notes. Estimates are used for, but not limited to sales allowances and programs, bad debts, stock-based compensation, allocation of purchase price allocations, excess inventory and purchase commitments, restructuring costs, facilities lease losses, impairment of goodwill and intangible assets, litigation, income taxes and investments. Actual results may differ materially from these estimates.
Fiscal Year |
Our fiscal year is a 52- or 53-week year that ends on the Friday closest to November 30. Fiscal years 2009, 2008 and 2007 were all 52 weeks.
Reclassification
Certain prior year amounts have been reclassified to conform to current year presentation in the Consolidated Statements of Cash Flows. The previously reported classifications of net cash provided by (used for) operating activities, investing activities and financing activities for any period presented were not affected by these reclassifications.
Allowance for Doubtful Accounts
We maintain an allowance for doubtful accounts which reflects our best estimate of potentially uncollectible trade receivables. We regularly review our trade receivables allowances by considering such factors as historical experience, credit-worthiness, the age of the trade receivable balances and current economic conditions that may affect a customer's ability to pay and we specifically reserve for those deemed uncollectible.
(in thousands) | 2009 | 2008 | 2007 | |||||||||
Beginning balance | $ | 4,128 | $ | 4,398 | $ | 6,798 | ||||||
Increase due to acquisition | 9,421 | - | - | |||||||||
Charged (credited) to operating expenses | 2,841 | 4,414 | (1,367 | ) | ||||||||
Preference claim, credited to operating expense | (1,000 | ) | (2,000 | ) | - | |||||||
Deductions (*) | (165 | ) | (2,684 | ) | (1,033 | ) | ||||||
Ending balance | $ | 15,225 | $ | 4,128 | $ | 4,398 |
| _________________________________________ |
(*) | Deductions related to the allowance for doubtful accounts represent amounts written off against the allowance, less recoveries. |
80
TABLE OF CONTENTS
ADOBE SYSTEMS INCORPORATED
NOTES TO CONSOLIDATED FINANCIAL STATEMENTS (Continued)
Foreign Currency Translation
We translate assets and liabilities of foreign subsidiaries, whose functional currency is their local currency, at exchange rates in effect at the balance sheet date. We translate revenue and expenses at the monthly average exchange rates. We include accumulated net translation adjustments in stockholders' equity as a component of accumulated other comprehensive income.
Property and Equipment
We record property and equipment at cost less accumulated depreciation and amortization. Property and equipment are depreciated using the straight-line method over their estimated useful lives ranging from 1 to 5 years for computers and equipment, 1 to 6 years for furniture and fixtures and up to 35 years for buildings. Leasehold improvements are amortized using the straight-line method over the lesser of the remaining respective lease term or useful lives.
Goodwill, Purchased Intangibles and Other Long-Lived Assets
We review our goodwill for impairment annually, or more frequently, if facts and circumstances warrant a review. We completed our annual impairment test in the second quarter of fiscal 2009 and determined that there was no impairment.
Goodwill is assigned to one or more reporting segments on the date of acquisition. We evaluate goodwill for impairment by comparing the fair value of each of our reporting segments to its carrying value, including the associated goodwill. To determine the fair values, we use the market approach based on comparable publicly traded companies in similar lines of businesses and the income approach based on estimated discounted future cash flows. Our cash flow assumptions consider historical and forecasted revenue, operating costs and other relevant factors.
We amortize intangible assets with finite lives over their estimated useful lives and review them for impairment whenever an impairment indicator exists. We continually monitor events and changes in circumstances that could indicate carrying amounts of our long-lived assets, including our intangible assets may not be recoverable. When such events or changes in circumstances occur, we assess recoverability by determining whether the carrying value of such assets will be recovered through the undiscounted expected future cash flows. If the future undiscounted cash flows are less than the carrying amount of these assets, we recognize an impairment loss based on the excess of the carrying amount over the fair value of the assets. We did not recognize any intangible asset impairment charges in fiscal 2009, 2008 or 2007.
Our intangible assets are amortized over their estimated useful lives of 1 to 13 years as shown in the table below. Amortization is based on the pattern in which the economic benefits of the intangible asset will be consumed.
Weighted Average Useful Life (years ) | ||||
Purchased technology | 7 | |||
Localization | 1 | |||
Trademarks | 7 | |||
Customer contracts and relationships | 10 | |||
Other intangibles | 2 | |||
Software Development Costs
Capitalization of software development costs for software to be sold, leased, or otherwise marketed begins upon the establishment of technological feasibility, which is generally the completion of a working prototype that has been certified as having no critical bugs and is a release candidate. Amortization begins once the software is ready for its intended use, generally based on the pattern in which the economic benefits will be consumed. To date, software development costs incurred between completion of a working prototype and general availability of the related product have not been material.
Revenue Recognition
Our revenue is derived from the licensing of software products, consulting, hosting services and maintenance and support. Primarily, we recognize revenue when persuasive evidence of an arrangement exists, we have delivered the product or performed the service, the fee is fixed or determinable and collection is probable.
81
TABLE OF CONTENTS
ADOBE SYSTEMS INCORPORATED
NOTES TO CONSOLIDATED FINANCIAL STATEMENTS (Continued)
Multiple Element Arrangements
We enter into multiple element revenue arrangements in which a customer may purchase a combination of software, upgrades, hosting services, maintenance and support, and consulting (multiple-element arrangements). When vendor specific objective evidence ("VSOE") of fair value does not exist for all delivered elements, we allocate and defer revenue for the undelivered items based on VSOE of fair value of the undelivered elements and recognize the difference between the total arrangement fee and the amount deferred for the undelivered items as license revenue.
VSOE of fair value for each element is based on the price for which the element is sold separately. We determine the VSOE of fair value of each element based on historical evidence of our stand-alone sales of these elements to third-parties or from the stated renewal rate for the elements contained in the initial software license arrangement. When VSOE of fair value does not exist for any undelivered element, revenue is deferred until the earlier of the point at which such VSOE of fair value exists or until all elements of the arrangement have been delivered. The only exception to this guidance is when the only undelivered element is maintenance and support or other services, then the entire arrangement fee is recognized ratably over the performance period.
Product Revenue
We recognize our product revenue upon shipment, provided all other revenue recognition criteria have been met. Our desktop application products' revenue from distributors is subject to agreements allowing limited rights of return, rebates and price protection. Our direct sales and OEM sales are also subject to limited rights of return. Accordingly, we reduce revenue recognized for estimated future returns, price protection and rebates at the time the related revenue is recorded. The estimates for returns are adjusted periodically based upon historical rates of returns, inventory levels in the distribution channel and other related factors.
We record the estimated costs of providing free technical phone support to customers for our software products.
We recognize OEM licensing revenue, primarily royalties, when OEMs ship products incorporating our software, provided collection of such revenue is deemed probable. For certain OEM customers, we must estimate royalty revenue due to the timing of securing customer information. This estimate is based on a combination of our generated forecasts and actual historical reporting by our OEM customers. To substantiate our ability to estimate revenue, we review license royalty revenue reports ultimately received from our significant OEM customers in comparison to the amounts estimated in the prior period.
Our product-related deferred revenue includes maintenance upgrade revenue and customer advances under OEM license agreements. Our maintenance upgrade revenue for our desktop application products is included in our product revenue line item as the maintenance primarily entitles customers to receive product upgrades. In cases where we provide a specified free upgrade to an existing product, we defer the fair value for the specified upgrade right until the future obligation is fulfilled or when the right to the specified free upgrade expires.
Services and Support Revenue
Our services and support revenue is composed of consulting, training and maintenance and support, primarily related to the licensing of our Enterprise and Mobile and Device Solutions products. Our support revenue also includes technical support and developer support to partners and developer organizations related to our desktop products.
We recognize revenue for hosting services that are based on a committed number of transactions, including implementation and set-up fees, ratably beginning on the date the customer commences use of our services and continuing through the end of the customer term. Over-usage fees, and fees billed based on the actual number of transactions from which we capture data, are billed in accordance with contract terms as these fees are incurred. We record amounts that have been invoiced in accounts receivable and in deferred revenue or revenue, depending on whether the revenue recognition criteria have been met.
Our consulting revenue is primarily recognized using the proportionate performance method and is measured monthly based on input measures, such as hours incurred to date compared to total estimated hours to complete, with consideration given to output measures, such as contract milestones when applicable. Our maintenance and support offerings, which entitle customers to receive product upgrades and enhancements or technical support, depending on the offering, are recognized ratably over the performance period of the arrangement.
82
TABLE OF CONTENTS
ADOBE SYSTEMS INCORPORATED
NOTES TO CONSOLIDATED FINANCIAL STATEMENTS (Continued)
Rights of Return, Rebates and Price Protection
As discussed above, we offer limited rights of return, rebates and price protection of our products under various policies and programs with our distributors, resellers and/or end-user customers. We estimate and record reserves for these programs as an offset to revenue. Below is a summary of each of the general provisions in our contracts:
| · | Distributors are allowed limited rights of return of products purchased during the previous quarter. In addition, distributors are allowed to return products that have reached the end of their lives and products that are being replaced by new versions. |
| · | We offer rebates to our distributors, resellers and/or end user customers. The amount of revenue that is reduced for distributor and reseller rebates is based on actual performance against objectives set forth by us for a particular reporting period (volume, timely reporting, etc.). If mail-in or other promotional rebates are offered, the amount of revenue reduced is based on the dollar amount of the rebate, taking into consideration an estimated redemption rate calculated using historical trends. |
| · | From time to time, we may offer price protection to our distributors that allow for the right to a credit if we permanently reduce the price of a software product. The amount of revenue that is reduced for price protection is calculated as the difference between the old and new price of a software product on inventory held by the distributor prior to the effective date of the decrease. |
Although our subscription contracts are generally non-cancelable, a limited number of customers have the right to cancel their contracts by providing prior written notice to us of their intent to cancel the remainder of the contract term. In the event a customer cancels its contract, they are not entitled to a refund for prior services we have provided to them.
On a quarterly basis, the amount of revenue that is reserved for future returns is calculated based on our historical trends and data specific to each reporting period. We review the actual returns evidenced in prior quarters as a percent of revenue to determine a historical returns rate. We then apply the historical rate to the current period revenue as a basis for estimating future returns. When necessary, we also provide a specific returns reserve for product in the distribution channel in excess of estimated requirements. This estimate can be affected by the amount of a particular product in the channel, the rate of sell-through, product plans and other factors.
Revenue Reserve
Revenue reserve rollforward (in thousands):
2009 | 2008 | 2007 | ||||||||||
Beginning balance | $ | 50,943 | $ | 43,532 | $ | 55,526 | ||||||
Increase due to acquisition | 6,566 | - | - | |||||||||
Amount charged to revenue | 113,009 | 153,129 | 156,761 | |||||||||
Actual returns | (136,117 | ) | (145,718 | ) | (168,755 | ) | ||||||
Ending balance | $ | 34,401 | $ | 50,943 | $ | 43,532 |
Deferred Revenue
Deferred revenue consist of billings or payments received in advance of revenue recognition for our products and services described above. We recognize deferred revenue as revenue only when the revenue recognition criteria are met.
Taxes Collected from Customers
We net taxes collected from customers against those remitted to government authorities in our financial statements. Accordingly, taxes collected from customers are not reported as revenue.
Advertising Expenses
Advertising costs are expensed as incurred. Advertising expenses for fiscal 2009, 2008 and 2007 were $67.0 million, $67.1 million and $45.3 million, respectively.
83
TABLE OF CONTENTS
ADOBE SYSTEMS INCORPORATED
NOTES TO CONSOLIDATED FINANCIAL STATEMENTS (Continued)
Foreign Currency and Other Hedging Instruments |
In countries outside the United States ("U.S."), we transact business in U.S. dollars and in various other currencies. In Europe and Japan, transactions that are denominated in Euro and Yen are subject to exposure from movements in exchange rates. We hedge our net recognized foreign currency assets and liabilities with foreign exchange forward contracts to reduce the risk that our earnings and cash flows will be adversely affected by changes in exchange rates. We use foreign exchange option and forward contracts for Euro- and Yen-denominated revenue.
We account for our derivative instruments as either assets or liabilities on the balance sheet and measure them at fair value. Gains and losses resulting from changes in fair value are accounted for depending on the use of the derivative and whether it is designated and qualifies for hedge accounting. Derivatives that do not qualify for hedge accounting are adjusted to fair value through earnings. See Note 5 for information regarding our hedging activities.
Gains and losses from foreign exchange forward contracts which hedge certain balance sheet positions, primarily non-functional currency denominated assets and liabilities (e.g., trade receivables and accounts payable) are recorded each period as a component of interest and other income, net in our Consolidated Statements of Income. Foreign exchange forward and option contracts hedging forecasted non-functional currency product licensing revenue, are designated as cash flow hedges under accounting for derivative instruments and hedging activities, with gains and losses recorded net of tax, as a component of other comprehensive income in stockholders' equity and reclassified into revenue at the time the forecasted transactions occur.
Income Taxes
We use the asset and liability method of accounting for income taxes. Under this method, income tax expense is recognized for the amount of taxes payable or refundable for the current year. In addition, deferred tax assets and liabilities are recognized for expected future tax consequences of temporary differences between the financial reporting and tax bases of assets and liabilities, and for operating losses and tax credit carryforwards. We record a valuation allowance to reduce deferred tax assets to an amount for which realization is more likely than not.
Recent Accounting Pronouncements
In October 2009, the Financial Accounting Standards Board ("FASB") issued new revenue recognition standards for arrangements with multiple deliverables, where certain of those deliverables are non-software related. The new standards permit entities to initially use management's best estimate of selling price to value individual deliverables when those deliverables do not have VSOE of fair value or when third-party evidence is not available. Additionally, these new standards modify the manner in which the transaction consideration is allocated across the separately identified deliverables by no longer permitting the residual method of allocating arrangement consideration. These new standards are effective for annual periods ending after June 15, 2010 and are effective for us beginning in the first quarter of fiscal 2011, however early adoption is permitted. We are currently evaluating the impact of adopting these new standards on our consolidated financial position, results of operations and cash flows, including possible early adoption.
In June 2009, the FASB issued the FASB Accounting Standards Codification (the "Codification") for financial statements issued for interim and annual periods ending after September 15, 2009, which was effective for us beginning in the fourth quarter of fiscal 2009. The Codification became the single authoritative source for GAAP. Accordingly, previous references to GAAP accounting standards are no longer used in our disclosures, including these Notes to the Consolidated Financial Statements. The Codification does not affect our consolidated financial position, cash flows, or results of operations.
In June 2009, the FASB issued amended standards for determining whether to consolidate a variable interest entity. These new standards amend the evaluation criteria to identify the primary beneficiary of a variable interest entity and requires ongoing reassessment of whether an enterprise is the primary beneficiary of the variable interest entity. The provisions of the new standards are effective for annual reporting periods beginning after November 15, 2009 and interim periods within those fiscal years. These standards will be effective for us beginning in the first quarter of fiscal 2010. The adoption of the new standards will not have an impact on our consolidated financial position, results of operations and cash flows.
84
TABLE OF CONTENTS
ADOBE SYSTEMS INCORPORATED
NOTES TO CONSOLIDATED FINANCIAL STATEMENTS (Continued)
In May 2009, the FASB issued new standards for subsequent events, which establishes general standards of accounting for and disclosure of events that occur after the balance sheet date but before financial statements are issued or are available to be issued. The new standards are effective for interim and annual reporting periods ending after June 15, 2009. We adopted the new standards during the third quarter of fiscal 2009 and, as the pronouncement only requires additional disclosures, the adoption did not have an impact on our consolidated financial position, results of operations or cash flows. We have evaluated subsequent events through January 22, 2010, the date that these financial statements were issued.
In April 2009, the FASB issued new standards for the recognition and measurement of other-than-temporary impairments for debt securities which replaced the pre-existing "intent and ability" indicator. These new standards specify that if the fair value of a debt security is less than its amortized cost basis, an other-than-temporary impairment is triggered in circumstances where (1) an entity has an intent to sell the security, (2) it is more likely than not that the entity will be required to sell the security before recovery of its amortized cost basis, or (3) the entity does not expect to recover the entire amortized cost basis of the security (that is, a credit loss exists). Other-than-temporary impairments are separated into amounts representing credit losses which are recognized in earnings and amounts related to all other factors which are recognized in other comprehensive income (loss). We adopted these standards in the third quarter of fiscal 2009 and they did not have a material effect on our consolidated financial position, results of operations or cash flows.
In April 2009, the FASB issued new standards which provide guidance on how to determine the fair value of assets and liabilities when the volume and level of activity for the asset or liability has significantly decreased. These new standards also provide guidance on identifying circumstances that indicate a transaction is not orderly. In addition, we are required to disclose in interim as well as annual reporting periods the inputs and valuation techniques used to measure fair value and discussion of changes in valuation techniques. We adopted these standards in the third quarter of fiscal 2009 and they did not have a material effect on our consolidated financial position, results of operations or cash flows.
In September 2008, the FASB issued additional guidance which requires additional disclosures by sellers of credit derivatives, including credit derivatives embedded in hybrid instruments. This new guidance also amends previous guidance related to accounting for guarantees to require additional disclosure about the current status of the payment/performance risk of a guarantee. These new provisions are effective for reporting periods ending after November 15, 2008. These provisions further clarify the effective date of new disclosure requirements regarding derivative instruments and hedging activities. We adopted these disclosures requirements in the first quarter of fiscal 2009. Since the new guidance only required additional disclosures, the adoption did not impact our consolidated financial position, results of operations or cash flows.
In April 2008, the FASB issued new standards which provided guidance on how to determine the useful life of intangible assets by amending the factors an entity should consider in developing renewal or extension assumptions used in determining the useful life of recognized intangible assets. This new guidance applies prospectively to intangible assets that are acquired individually or with a group of other assets in business combinations and asset acquisitions. These standards are effective for financial statements issued for fiscal years beginning after December 15, 2008 and interim periods within those fiscal years and is effective for us beginning in the first quarter of fiscal 2010. Early adoption is not permitted. As this guidance is to be applied prospectively, on adoption, there will be no impact to our current consolidated financial statements.
In March 2008, the FASB issued new standards which requires companies with derivative instruments to disclose information that should enable financial statement users to understand how and why a company uses derivative instruments, how derivative instruments and related hedged items are accounted for and how derivative instruments and related hedged items affect a company's financial position, financial performance and cash flows. We adopted these new standards in the first quarter of fiscal 2009. Since the new standards only required additional disclosure, the adoption did not impact our consolidated financial position, results of operations or cash flows. See Note 5 for further information regarding derivative instruments and related hedged items.
In December 2007, the FASB revised their guidance for business combinations and non-controlling interests. The new standards will change how business acquisitions are accounted for and will impact financial statements both on the acquisition date and in subsequent periods. The changes also impact the accounting and reporting for minority interests, which will be recharacterized as non-controlling interests and classified as a component of equity. The new standards are effective for us beginning in the first quarter of fiscal 2010. Early adoption is not permitted. We are currently evaluating the impact the new standards will have on our consolidated financial statements however, we currently believe that depending on the size and frequency of acquisitions, the adoption of these standards may have a material effect on our future consolidated financial statements as more costs associated with acquisitions will be required to be expensed rather than accounted for as part of the purchase price.
85
TABLE OF CONTENTS
ADOBE SYSTEMS INCORPORATED
NOTES TO CONSOLIDATED FINANCIAL STATEMENTS (Continued)
NOTE 2. ACQUISITIONS
Fiscal 2009 Acquisitions
On October 23, 2009, we completed the acquisition of Omniture, Inc. ("Omniture"), an industry leader in Web analytics and online business optimization based in Orem, Utah, for approximately $1.8 billion. Under the terms of the agreement, we completed our tender offer to acquire all of the outstanding shares of Omniture common stock at a price of $21.50 per share, net to the seller in cash, without interest. Acquiring Omniture accelerates our strategy of delivering more effective solutions for assembling, delivering, targeting and optimizing Web content and applications. The transaction was accounted for using the purchase method of accounting. We have included the financial results of Omniture in our Consolidated Financial Statements beginning on the acquisition date. Following the closing, we integrated Omniture as a new reportable segment for financial reporting purposes.
Assets acquired and liabilities assumed were recorded at their fair values as of October 23, 2009. The total $1.8 billion purchase price was comprised of the following (in thousands):
Acquisition of approximately 79 million shares of outstanding common stock of Omniture at $21.50 per share in cash | $ | 1,698,926 | ||
Estimated fair value of earned stock options and restricted stock units assumed and converted | 84,968 | |||
Estimated direct transaction costs | 13,964 | |||
Total purchase price | $ | 1,797,858 |
In connection with the acquisition, each Omniture stock option that was outstanding and unexercised was assumed and converted into an option to purchase Adobe common stock based on one of two conversion ratios, dependent on which plan the award was granted under. The conversion ratio was either 0.6182, which was calculated as the consideration price of $21.50 divided by the closing price on the date of acquisition, or 0.6083 calculated as the consideration price of $21.50 divided by the average closing price from October 16, 2009 to October 22, 2009. We assumed the stock options in accordance with the terms of the applicable Omniture stock option plan and terms of the stock option agreement relating to that Omniture stock option. Based on Omniture's stock options outstanding at October 23, 2009, we converted options to purchase approximately 8.9 million shares of Omniture common stock into options to purchase approximately 5.5 million shares of Adobe common stock. We also assumed and converted approximately 2.5 million shares of outstanding Omniture restricted stock units into approximately 1.6 million shares of Adobe restricted stock units, using the same conversion ratios stated above. The estimated value of the stock options and restricted stock units assumed and converted that is included in the preliminary purchase price equals the fair value of the options to purchase approximately 5.5 million of Adobe common stock and the 1.6 million shares of Adobe restricted stock units, reduced by the portion of the respective values considered unearned compensation.
The estimated fair value of the stock options assumed was determined to be approximately $97.1 million using a Binomial option valuation model with the following assumptions: volatility of 33.6-35.4%; weighted average risk-free interest rate of 0.20-3.64%; dividend yield of 0%; early exercise threshold of $14.20; and post vesting cancellation rate of 1.89%. The underlying stock price used in valuing the options was $34.33, which was the average of closing prices for a range of trading days from September 11, 2009 through September 17, 2009, comprising two days before through two days after the date the acquisition was announced. The value of stock options considered unearned compensation was determined to be approximately $34.9 million, net of estimated forfeitures, also using a Binomial option valuation model with the following assumptions: volatility of 36.5-37.0%; weighted average risk-free interest rate of 0.24%-3.25%; dividend yield of 0%; early exercise threshold of $14.20; and post vesting cancellation rate of 1.89%. The underlying stock price used in valuing the options for which a portion was considered unearned compensation was $34.78, which was the closing price on October 23, 2009. The fair value of the converted restricted stock units was determined to be approximately $55.6 million based on Adobe's average stock price of $34.33, as discussed above. This amount was reduced by the fair value of the restricted stock units considered unearned compensation of approximately $32.8 million, net of estimated forfeitures, based on the $34.78 stock price referred to above. $67.7 million in unearned compensation will be recorded as an expense on a straight-line basis over the remaining service periods of the respective awards. The recognition of expense associated with the portion of the assumed and converted stock options and restricted stock units that are subject to future service requirements, which are not included in the purchase accounting, have not been included in the pro forma statements of income.
86
TABLE OF CONTENTS
ADOBE SYSTEMS INCORPORATED
NOTES TO CONSOLIDATED FINANCIAL STATEMENTS (Continued)
Direct transaction costs of approximately $14.0 million include estimated investment banking, legal and accounting fees, and other external costs directly related to the acquisition. As of November 27, 2009, substantially all costs for accounting, legal, and other professional services have been paid.
Preliminary Purchase Price Allocation
Under the purchase accounting method, the total preliminary purchase price was allocated to Omniture's net tangible and intangible assets based upon their estimated fair values as of October 23, 2009. The excess purchase price over the value of the net tangible and identifiable intangible assets was recorded as goodwill.
The table below represents the allocation of the preliminary purchase price to the acquired net assets of Omniture based on their estimated fair values as of October 23, 2009 and the associated estimated useful lives at that date. The preliminary allocation of the purchase price was based upon a preliminary valuation and our estimates and assumptions are subject to change within the purchase price allocation period as valuations are finalized.
(in thousands) | Amount | Weighted Average Useful Life (years) | ||||||
Net tangible assets | $ | 31,138 | N/A | |||||
Identifiable intangible assets: | ||||||||
Existing technology | 176,100 | 6 | ||||||
Customer contracts and relationships | 167,900 | 11 | ||||||
Contract backlog | 52,100 | 2 | ||||||
Non-competition agreements | 900 | 2 | ||||||
Trademarks | 41,000 | 8 | ||||||
In-process research and development | 4,600 | N/A | ||||||
Goodwill | 1,334,980 | N/A | ||||||
Restructuring liability | (10,860 | ) | N/A | |||||
Total estimated purchase price allocation | $ | 1,797,858 | ||||||
Net tangible assets - Omniture's tangible assets and liabilities as of October 23, 2009 were reviewed and adjusted to their fair value as necessary. Among the net tangible assets assumed were $137.4 million in cash and cash equivalents, $119.1 million in trade receivables, $40.9 million in property, plant and equipment, $46.0 million in accrued expenses and $110.9 million in deferred tax liabilities.
Deferred revenue- Included in net tangible assets is Omniture's deferred revenue which represents advance payments from customers related to subscription contracts and professional services. We estimated our obligation related to the deferred revenue using the cost build-up approach. The cost build-up approach determines fair value by estimating the costs relating to supporting the obligation plus an assumed profit. The sum of the costs and assumed profit approximates, in theory, the amount that we would be required to pay a third party to assume the obligation. The estimated costs to fulfill the obligation were based on the near-term projected cost structure for subscription and professional services. As a result, we recorded an adjustment to reduce Omniture's carrying value of deferred revenue by $39.7 million to $87.4 million, which represents our estimate of the fair value of the contractual obligations assumed based on a preliminary valuation.
Identifiable intangible assets - Existing technology acquired primarily consists of Omniture's SiteCatalyst Web analytics, Omniture Test & Target, and HBX subscription service offerings and also consists of Omniture SiteSearch, Omniture Merchandising and Omniture Insight products and subscription services. The preliminary estimated fair value of the existing technology was determined based on the present value of the expected cash flows to be generated by each existing technology. Customer relationships consist of Omniture's contractual relationships and customer loyalty related to their enterprise and mid-market customers as well as partner customers that resell Omniture's services to end users. Contract backlog relates to subscription contracts and professional services. We will amortize the fair value of the contract backlog based on the pattern in which the economic benefits will be consumed. Trademarks include the Omniture trade name as well
87
TABLE OF CONTENTS
ADOBE SYSTEMS INCORPORATED
NOTES TO CONSOLIDATED FINANCIAL STATEMENTS (Continued)
as SiteCatalyst, Omniture SearchCenter, Omniture Discover, Omniture Genesis, and HBX product names. Non-compete agreements include agreements with key Omniture employees that preclude them from competing against Omniture for a period of two years. With the exception of contract backlog, we expect to amortize the fair value of these intangible assets on a straight-line basis over their respective estimated useful lives.
In-process research and development - In-process research and development ("IPR&D") was expensed to amortization of purchased intangibles and incomplete technology in our Consolidated Statements of Income upon acquisition as it represents incomplete Omniture research and development projects that had not reached technological feasibility and had no alternative future use as of the date of the acquisition. Technological feasibility is established when an enterprise has completed all planning, designing, coding, and testing activities that are necessary to establish that a product can be produced to meet its design specifications including functions, features, and technical performance requirements. The estimated fair value of $4.6 million was determined by estimating the net cash flows expected to be generated from the project and discounting the net cash flows to their present value.
Goodwill - Approximately $1.3 billion has been allocated to goodwill. Goodwill represents the excess of the purchase price over the fair value of the underlying acquired net tangible and intangible assets. The factors that contributed to the recognition of goodwill included securing buyer-specific synergies that increase revenue and profits and are not otherwise available to a marketplace participant, acquiring a talented workforce, and cost savings opportunities. The preliminary goodwill recorded in connection with Omniture has been allocated to the Omniture and Creative Solutions reportable segments of $1.1 billion and $0.2 billion, respectively, based on expected revenue and cost synergies to be gained as a result of the acquisition.
Restructuring- $10.9 million in restructuring related primarily to costs for severance and associated benefits, outplacement services, and cost of redundant facilities. See Note 11 for further details of the amounts accrued during 2009.
Taxes- As part of our accounting for the Omniture acquisition, a portion of the overall purchase price was allocated to goodwill and acquired intangible assets. Amortization expense associated with acquired intangible assets is not deductible for tax purposes. Thus, approximately $174.4 million, included in the net tangible assets, was established as a deferred tax liability for the future amortization of the intangible assets.
Any impairment charges made in the future associated with goodwill will not be tax deductible and will result in an increased effective income tax rate in the quarter the impairment is recorded.
Pro Forma Results
The financial information in the table below summarizes the combined results of operations of Adobe and Omniture, on a pro forma basis, as though the companies had been combined as of the beginning of the periods presented. The pro forma financial information is presented for informational purposes only and is not indicative of the results of operations that would have been achieved if the acquisition had taken place on November 29, 2008 and December 1, 2007 or of results that may occur in the future.
The following pro forma financial information for fiscal 2009 and 2008 combines the historical results for Adobe for the years ended November 27, 2009 and November 28, 2008 and the historical results of Omniture for the period January 1, 2009 through October 23, 2009 and the year ended December 31, 2008 (in thousands):
2009 | 2008 | |||||||
Net revenues | $ | 3,168,731 | $ | 3,835,799 | ||||
Net income | $ | 308,904 | $ | 742,749 | ||||
Basic net income per share | $ | 0.59 | $ | 1.38 | ||||
| Shares used in computing basic net income per share | 524,470 | 539,373 | ||||||
| Diluted net income per share | $ | 0.58 | $ | 1.35 | ||||
| Shares used in computing diluted net income per share | 531,293 | 549,883 |
88
TABLE OF CONTENTS
ADOBE SYSTEMS INCORPORATED
NOTES TO CONSOLIDATED FINANCIAL STATEMENTS (Continued)
In addition to the acquisition of Omniture, we acquired one other company during fiscal 2009 for cash consideration of approximately $35.3 million. The impact of this acquisition was not material to our consolidated balance sheets and results of operations.
Fiscal 2008 Acquisition
During fiscal 2008, we completed one business combination for cash consideration of approximately $4.3 million. This acquisition was not material to our consolidated balance sheets and results of operations.
Fiscal 2007 Acquisitions
During fiscal 2007, we completed two business combinations and one asset acquisition for cash consideration of $77.0 million. Both individually and in the aggregate, these acquisitions were not material to our consolidated balance sheets and results of operations. See Note 7 for information regarding goodwill and purchased and other intangibles.
NOTE 3. CASH, CASH EQUIVALENTS AND SHORT-TERM INVESTMENTS
Cash equivalents consist of instruments with remaining maturities of three months or less at the date of purchase. We classify all of our cash equivalents and short-term investments as "available-for-sale." These investments are free of trading restrictions. We carry these investments at fair value, based on quoted market prices or other readily available market information. Unrealized gains and losses, net of taxes, are included in accumulated other comprehensive income, which is reflected as a separate component of stockholders' equity in our Consolidated Balance Sheets. Gains are recognized when realized in our Consolidated Statements of Income. Losses are recognized as realized. When we have determined that an other-than-temporary decline in fair value has occurred the amount of the decline that is related to a credit loss is recognized in earnings. Gains and losses are determined using the specific identification method.
Cash, cash equivalents and short-term investments consisted of the following as of November 27, 2009 (in thousands):
Amortized Cost | Unrealized Gains | Unrealized Losses | Estimated Fair Value | |||||||||||||
Current assets: | ||||||||||||||||
Cash | $ | 75,110 | $ | - | $ | - | $ | 75,110 | ||||||||
Cash equivalents: | ||||||||||||||||
Money market mutual funds | 884,240 | - | - | 884,240 | ||||||||||||
Bank deposits | 40,137 | - | - | 40,137 | ||||||||||||
Total cash equivalents | 924,377 | - | - | 924,377 | ||||||||||||
Total cash and cash equivalents | 999,487 | - | - | 999,487 | ||||||||||||
Short-term investments: | ||||||||||||||||
United States treasury notes | 373,180 | 3,199 | (1 | ) | 376,378 | |||||||||||
United States government agency bonds | 59,447 | 273 | - | 59,720 | ||||||||||||
Government guaranteed bonds | 221,730 | 3,409 | (1 | ) | 225,138 | |||||||||||
Corporate bonds | 185,735 | 4,702 | - | 190,437 | ||||||||||||
Obligations of foreign governments | 23,022 | 397 | - | 23,419 | ||||||||||||
Bonds of multi-lateral government agencies | 24,598 | 269 | - | 24,867 | ||||||||||||
Subtotal | 887,712 | 12,249 | (2 | ) | 899,959 | |||||||||||
Other marketable equity securities | 2,527 | 2,500 | - | 5,027 | ||||||||||||
Total short-term investments | 890,239 | 14,749 | (2 | ) | 904,986 | |||||||||||
Total cash, cash equivalents and short-term investments | $ | 1,889,726 | $ | 14,749 | $ | (2 | ) | $ | 1,904,473 | |||||||
89
TABLE OF CONTENTS
ADOBE SYSTEMS INCORPORATED
NOTES TO CONSOLIDATED FINANCIAL STATEMENTS (Continued)
Cash, cash equivalents and short-term investments consisted of the following as of November 28, 2008 (in thousands):
Amortized Cost | Unrealized Gains | Unrealized Losses | Estimated Fair Value | |||||||||||||
Current assets: | ||||||||||||||||
Cash | $ | 117,681 | $ | - | $ | - | $ | 117,681 | ||||||||
Cash equivalents: | ||||||||||||||||
Money market mutual funds | 682,148 | - | - | 682,148 | ||||||||||||
Bank deposits | 40,594 | - | - | 40,594 | ||||||||||||
United States treasury notes | 35,992 | 7 | - | 35,999 | ||||||||||||
Corporate bonds | 10,028 | - | - | 10,028 | ||||||||||||
Total cash equivalents | 768,762 | 7 | - | 768,769 | ||||||||||||
Total cash and cash equivalents | 886,443 | 7 | - | 886,450 | ||||||||||||
Short-term investments: | ||||||||||||||||
United States treasury notes | 863,772 | 14,384 | (1 | ) | 878,155 | |||||||||||
Corporate bonds | 109,415 | 219 | (997 | ) | 108,637 | |||||||||||
Obligations of foreign governments | 115,316 | 811 | (33 | ) | 116,094 | |||||||||||
Bonds of multi-lateral government agencies | 26,559 | 260 | - | 26,819 | ||||||||||||
Subtotal | 1,115,062 | 15,674 | (1,031 | ) | 1,129,705 | |||||||||||
Other marketable equity securities | 2,773 | 274 | - | 3,047 | ||||||||||||
Total short-term investments | 1,117,835 | 15,948 | (1,031 | ) | 1,132,752 | |||||||||||
Total cash, cash equivalents and short-term investments | $ | 2,004,278 | $ | 15,955 | $ | (1,031 | ) | $ | 2,019,202 | |||||||
See Note 4 for further information regarding the fair value of our financial instruments.
The following table summarizes the fair value and gross unrealized losses related to available-for-sale securities, aggregated by investment category and length of time that individual securities have been in a continuous unrealized loss position, at November 27, 2009 (in thousands):
| Less Than 12 Months | Total | |||||||||||||||
Fair Value | Gross Unrealized Losses | Fair Value | Gross Unrealized Losses | |||||||||||||
United States treasury notes and agency bonds | $ | 11,179 | $ | (1 | ) | $ | 11,179 | $ | (1 | ) | ||||||
Government guaranteed bonds | 5,041 | (1 | ) | 5,041 | (1 | ) | ||||||||||
Total | $ | 16,220 | $ | (2 | ) | $ | 16,220 | $ | (2 | ) | ||||||
As of November 27, 2009, there were no securities in a continuous unrealized loss position for more than twelve months. There were 4 securities that were in an unrealized loss position at November 27, 2009.
The following table summarizes the fair value and gross unrealized losses related to available-for-sale securities, aggregated by investment category and length of time that individual securities have been in a continuous unrealized loss position, at November 28, 2008 (in thousands):
| Less Than 12 Months | Total | |||||||||||||||
Fair Value | Gross Unrealized Losses | Fair Value | Gross Unrealized Losses | |||||||||||||
United States treasury notes | $ | 37,400 | $ | (1 | ) | $ | 37,400 | $ | (1 | ) | ||||||
Corporate bonds | 67,606 | (997 | ) | 67,606 | (997 | ) | ||||||||||
Obligations of foreign governments | 28,033 | (33 | ) | 28,033 | (33 | ) | ||||||||||
Total | $ | 133,039 | $ | (1,031 | ) | $ | 133,039 | $ | (1,031 | ) | ||||||
As of November 28, 2008, there were no securities in a continuous unrealized loss position for more than twelve months. There were 33 securities that were in an unrealized loss position at November 28, 2008.
90
TABLE OF CONTENTS
ADOBE SYSTEMS INCORPORATED
NOTES TO CONSOLIDATED FINANCIAL STATEMENTS (Continued)
The following table summarizes the cost and estimated fair value of debt securities classified as short-term investments based on stated maturities as of November 27, 2009 (in thousands):
Amortized Cost | Estimated Fair Value | |||||||
Due within one year | $ | 385,828 | $ | 387,572 | ||||
Due within two years | 246,169 | 249,882 | ||||||
Due within three years | 214,108 | 218,621 | ||||||
Due after three years | 41,607 | 43,884 | ||||||
Total | $ | 887,712 | $ | 899,959 |
We review our debt and marketable equity securities classified as short-term investments on a regular basis to evaluate whether or not any security has experienced an other-than-temporary decline in fair value. We consider factors such as the length of time and extent to which the market value has been less than the cost, the financial condition and near-term prospects of the issuer and our intent to sell, or whether it is more likely than not we will be required to sell, the investment before recovery of the investment's amortized cost basis. If we believe that an other-than-temporary decline exists in one of these securities, we write down these investments to fair value. For debt securities, the portion of the write-down related to credit loss would be recorded to interest and other income, net in our Consolidated Statements of Income. Any portion not related to credit loss would be recorded to accumulated other comprehensive income, which is reflected as a separate component of stockholders' equity in our Consolidated Balance Sheets. For equity securities, the write-down would be recorded to investment gains (losses), net in our Consolidated Statements of Income. As of November 27, 2009, we do not consider any of our investments to be other-than-temporarily impaired.
NOTE 4. FAIR VALUE MEASUREMENTS
We measure certain financial assets and liabilities at fair value on a recurring basis. The fair value of these financial assets and liabilities was determined using the following inputs at November 27, 2009 (in thousands):
| Fair Value Measurements at Reporting Date Using | ||||||||||||||||
Quoted Prices in Active Markets for Identical Assets | Significant Other Observable Inputs | Significant Unobservable Inputs | ||||||||||||||
Total | (Level 1) | (Level 2) | (Level 3) | |||||||||||||
Current assets: | ||||||||||||||||
Money market funds and overnight deposits (1) | $ | 924,378 | $ | 924,378 | $ | - | $ | - | ||||||||
Fixed income available-for-sale securities (2) | 899,960 | - | 899,960 | - | ||||||||||||
Available-for-sale equity securities (3) | 5,026 | 5,026 | - | - | ||||||||||||
Total current assets | 1,829,364 | 929,404 | 899,960 | - | ||||||||||||
Non-current assets: | ||||||||||||||||
Investments of limited partnership (4) | 37,121 | - | - | 37,121 | ||||||||||||
Foreign currency derivatives (5) | 4,307 | - | 4,307 | - | ||||||||||||
Deferred compensation plan assets (4) : | ||||||||||||||||
Money market funds | 717 | 717 | - | - | ||||||||||||
Equity and fixed income mutual funds | 8,328 | - | 8,328 | - | ||||||||||||
Subtotal for deferred compensation plan assets | 9,045 | 717 | 8,328 | - | ||||||||||||
Total non-current assets | 50,473 | 717 | 12,635 | 37,121 | ||||||||||||
Total assets | $ | 1,879,837 | $ | 930,121 | $ | 912,595 | $ | 37,121 | ||||||||
Liabilities: | ||||||||||||||||
Foreign currency derivatives (6) | $ | 1,589 | $ | - | $ | 1,589 | $ | - | ||||||||
Total liabilities | $ | 1,589 | $ | - | $ | 1,589 | $ | - | ||||||||
91
TABLE OF CONTENTS
ADOBE SYSTEMS INCORPORATED
NOTES TO CONSOLIDATED FINANCIAL STATEMENTS (Continued)
The fair value of these financial assets and liabilities was determined using the following inputs at November 28, 2008 (in thousands):
| Fair Value Measurements at Reporting Date Using | ||||||||||||||||
Quoted Prices in Active Markets for Identical Assets | Significant Other Observable Inputs | Significant Unobservable Inputs | ||||||||||||||
Total | (Level 1) | (Level 2) | (Level 3) | |||||||||||||
Current assets: | ||||||||||||||||
Money market funds and overnight deposits (1) | $ | 722,742 | $ | 722,742 | $ | - | $ | - | ||||||||
Fixed income available-for-sale securities (2) | 1,175,732 | - | 1,175,732 | - | ||||||||||||
Available-for-sale equity securities (3) | 3,047 | 3,047 | - | - | ||||||||||||
Total current assets | 1,901,521 | 725,789 | 1,175,732 | - | ||||||||||||
Non-current assets: | ||||||||||||||||
Investments of limited partnership (4) | 39,004 | 251 | - | 38,753 | ||||||||||||
Foreign currency derivatives (5) | 49,848 | - | 49,848 | - | ||||||||||||
Deferred compensation plan assets (4) : | ||||||||||||||||
Money market funds | 704 | 704 | - | - | ||||||||||||
Equity and fixed income mutual funds | 6,856 | - | 6,856 | - | ||||||||||||
Subtotal for deferred compensation plan assets | 7,560 | 704 | 6,856 | - | ||||||||||||
Total non-current assets | 96,412 | 955 | 56,704 | 38,753 | ||||||||||||
Total assets | $ | 1,997,933 | $ | 726,744 | $ | 1,232,436 | $ | 38,753 | ||||||||
Liabilities: | ||||||||||||||||
Foreign currency derivatives (6) | $ | 1,739 | $ | - | $ | 1,739 | $ | - | ||||||||
Total liabilities | $ | 1,739 | $ | - | $ | 1,739 | $ | - | ||||||||
_________________________________________
(1) | Included in cash and cash equivalents on our Consolidated Balance Sheets. |
(2) | Included in either cash and cash equivalents or short-term investments on our Consolidated Balance Sheets. |
(3) | Included in short-term investments on our Consolidated Balance Sheets. |
(4) | Included in other assets on our Consolidated Balance Sheets. |
(5) | Included in prepaid expenses and other current assets on our Consolidated Balance Sheets. |
(6) | Included in accrued expenses on our Consolidated Balance Sheets. |
See Note 3 for further information regarding the fair value of our financial instruments.
Fixed income available-for-sale securities include U.S. treasury securities, Agency or U.S. government guaranteed securities (70% of total), corporate bonds (21% of total), obligations of foreign governments and their agencies (6% of total), and obligations of multi-lateral government agencies (3% of total) at November 27, 2009 and U.S. treasury securities, Agency or U.S. government guaranteed securities (78% of total), corporate bonds (10% of total), obligations of foreign governments and their agencies (10% of total), and obligations of multi-lateral government agencies (2% of total) at November 28, 2008. These are all high quality, investment grade securities with a minimum credit rating of A- and a weighted average credit rating better than AA+. We value these securities based on pricing from pricing vendors, who may use quoted prices in active markets for identical assets (Level 1 inputs) or inputs other than quoted prices that are observable either directly or indirectly (Level 2 inputs) in determining fair value. However, we classify all of our fixed income available-for-sale securities as having Level 2 inputs. Our procedures include controls to ensure that appropriate fair values are recorded such as comparing prices obtained from multiple independent sources.
92
TABLE OF CONTENTS
ADOBE SYSTEMS INCORPORATED
NOTES TO CONSOLIDATED FINANCIAL STATEMENTS (Continued)
The investments of limited partnership relate to our interest in Adobe Ventures IV L.P. ("Adobe Ventures"), which are consolidated in our Consolidated Financial Statements. The Level 1 investments of limited partnership relate to investments in publicly-traded companies and the Level 3 investments consist of investments in privately-held companies. These investments are remeasured at fair value each period with any gains or losses recognized in investment gains (losses), net in our Consolidated Statements of Income. We estimated fair value of the Level 3 investments by considering available information such as pricing in recent rounds of financing, current cash positions, earnings and cash flow forecasts, recent operational performance and any other readily available market data.
A reconciliation of the beginning and ending balances for investments of limited partnership using significant unobservable inputs (Level 3) as of November 27, 2009 and November 28, 2008 was as follows (in thousands):
Balance as of November 30, 2007 | $ | 30,647 | ||
Purchases and sales of investments, net | 363 | |||
Unrealized net investment gains included in earnings | 7,743 | |||
Balance as of November 28, 2008 | 38,753 | |||
Purchases and sales of investments, net | 1,921 | |||
Unrealized net investment losses included in earnings | (3,553 | ) | ||
Balance as of November 27, 2009 | $ | 37,121 |
We also have direct investments in privately-held companies accounted for under the cost method, which are periodically assessed for other-than-temporary impairment. If we determine that an other-than-temporary impairment has occurred, we write-down the investment to its fair value. We estimated fair value of our cost method investments considering available information such as pricing in recent rounds of financing, current cash positions, earnings and cash flow forecasts, recent operational performance and any other readily available market data. During fiscal 2009, we determined that certain of our cost method investments were other-than-temporarily impaired which resulted in a charge of $13.9 million, included in investment gains (losses), net in our Consolidated Statements of Income. The fair value of cost method investments that were impaired was estimated using Level 3 inputs.
See Note 8 for further information regarding our limited partnership interest in Adobe Ventures and our cost method investments.
NOTE 5. FINANCIAL INSTRUMENTS
Hedge Accounting
We recognize derivative instruments and hedging activities as either assets or liabilities in our Consolidated Balance Sheets and measure them at fair value. Gains and losses resulting from changes in fair value are accounted for depending on the use of the derivative and whether it is designated and qualifies for hedge accounting.
Economic Hedging-Hedges of Forecasted Transactions
In countries outside the U.S., we transact business in U.S. dollars and in various other currencies. In Europe and Japan, transactions that are denominated in Euro and Yen are subject to exposure from movements in exchange rates. We may use foreign exchange option contracts or forward contracts to hedge certain operational ("cash flow") exposures resulting from changes in foreign currency exchange rates. These foreign exchange contracts, carried at fair value, may have maturities between one and twelve months. The maximum original duration of any contract is twelve months. We enter into these foreign exchange contracts to hedge a portion of our forecasted foreign currency denominated revenue in the normal course of business and accordingly, they are not speculative in nature.
To receive hedge accounting treatment, all hedging relationships are formally documented at the inception of the hedge, and the hedges must be highly effective in offsetting changes to future cash flows on hedged transactions. We record changes in the intrinsic value of these cash flow hedges in accumulated other comprehensive income in our Consolidated Balance Sheets, until the forecasted transaction occurs. When the forecasted transaction occurs, we reclassify the related gain or loss on the cash flow hedge to revenue. In the event the underlying forecasted transaction does not occur, or it becomes probable
93
TABLE OF CONTENTS
ADOBE SYSTEMS INCORPORATED
NOTES TO CONSOLIDATED FINANCIAL STATEMENTS (Continued)
that it will not occur, we reclassify the gain or loss on the related cash flow hedge from accumulated other comprehensive income to interest and other income, net in our Consolidated Statements of Income at that time. For fiscal 2009, 2008 and 2007 there were no such gains or losses recognized in interest and other income, net relating to hedges of forecasted transactions that did not occur.
We evaluate hedge effectiveness at the inception of the hedge prospectively as well as retrospectively and record any ineffective portion of the hedging instruments in interest and other income, net on our Consolidated Statements of Income. The net gain (loss) recognized in interest and other income, net for cash flow hedges due to hedge ineffectiveness was insignificant for fiscal 2009, 2008 and 2007. The time value of purchased derivative instruments is recorded in interest and other income, net in our Consolidated Statements of Income.
The effect of derivative instruments designated as cash flow hedges and of derivative instruments not designated as hedges in our Consolidated Statements of Income for fiscal 2009 was as follows (in thousands):
| 2009 | ||||||||
Foreign Exchange Option Contracts | Foreign Exchange Forward Contracts | |||||||
Derivatives in cash flow hedging relationships: | ||||||||
Net gain (loss) recognized in OCI, net of tax (1) | $ | (14,618 | ) | $ | - | |||
Net gain (loss) reclassified from accumulated OCI into income, net of tax (2) | $ | 27,138 | $ | - | ||||
Net gain (loss) recognized in income (3) | $ | (18,027 | ) | $ | - | |||
Derivatives not designated as hedging relationships: | ||||||||
Net gain (loss) recognized in income (4) | $ | - | $ | (14,407 | ) | |||
_________________________________________
(1) | Net change in the fair value of the effective portion classified in other comprehensive income ("OCI"). |
(2) | Effective portion classified as revenue. |
(3) | Ineffective portion and amount excluded from effectiveness testing classified in interest and other income, net. |
(4) | Classified in interest and other income, net. |
Balance Sheet Hedging - Hedging of Foreign Currency Assets and Liabilities
We also hedge our net recognized foreign currency assets and liabilities with foreign exchange forward contracts to reduce the risk that our earnings and cash flows will be adversely affected by changes in exchange rates. These derivative instruments hedge assets and liabilities that are denominated in foreign currencies and are carried at fair value with changes in the fair value recorded to interest and other income, net in our Consolidated Statements of Income. These derivative instruments do not subject us to material balance sheet risk due to exchange rate movements because gains and losses on these derivatives are intended to offset gains and losses on the assets and liabilities being hedged. As of November 27, 2009, total notional amounts of outstanding contracts were $154.9 million which included the notional equivalent of $87.6 million in Euro, $22.9 million in Yen and $44.4 million in other foreign currencies. At November 27, 2009, the outstanding balance sheet hedging derivatives had maturities of 90 days or less.
94
TABLE OF CONTENTS
ADOBE SYSTEMS INCORPORATED
NOTES TO CONSOLIDATED FINANCIAL STATEMENTS (Continued)
The fair value of derivative instruments in our Consolidated Balance Sheets as of November 27, 2009 were as follows (in thousands):
Fair Values of Derivative Instruments | ||||||||||
Asset Derivatives | Liability Derivatives | |||||||||
Balance Sheet Location |
Fair Value | Balance Sheet Location |
Fair Value | |||||||
| Derivatives designated as hedging instruments: | ||||||||||
Foreign exchange option contracts (*) | Prepaid expense and other current assets | $ | 4,175 | Accrued expenses | $ | - | ||||
| Derivatives not designated as hedging instruments: | ||||||||||
Foreign exchange forward contracts | Prepaid expense and other current assets | 132 | Accrued expenses | 1,589 | ||||||
Total derivatives | $ | 4,307 | $ | 1,589 | ||||||
_________________________________________
(*) Hedging effectiveness expected to be recognized to income within the next twelve months.
Net gains (losses) recognized in interest and other income, net relating to balance sheet hedging for fiscal 2009, 2008 and 2007 were as follows (in thousands):
2009 | 2008 | 2007 | ||||||||||
Gain (loss) on foreign currency assets and liabilities: | ||||||||||||
Net realized gain (loss) recognized in other income | $ | 25,384 | $ | (7,738 | ) | $ | 13,388 | |||||
Net unrealized (loss) gain recognized in other income related to instruments outstanding | (6,390 | ) | 5,223 | (4,035 | ) | |||||||
| 18,994 | (2,515 | ) | 9,353 | |||||||||
(Loss) gain on hedges of foreign currency assets and liabilities: | ||||||||||||
Net realized loss recognized in other income | (11,872 | ) | (3,255 | ) | (8,394 | ) | ||||||
Net unrealized (loss) gain recognized in other income | (2,535 | ) | 3,920 | 1,887 | ||||||||
| (14,407 | ) | 665 | (6,507 | ) | ||||||||
| Net gain (loss) recognized in other income | $ | 4,587 | $ | (1,850 | ) | $ | 2,846 |
Concentration of Risk
Financial instruments that potentially subject us to concentrations of credit risk are short-term investments, primarily fixed-income securities, structured repurchase transactions, derivatives, hedging foreign currency and interest rate risk and trade receivables.
Our investment portfolio consists of investment-grade securities diversified among security types, industries and issuers. Our cash and investments are held and managed by recognized financial institutions that follow our investment policy. Our policy limits the amount of credit exposure to any one security issue or issuer and we believe no significant concentration of credit risk exists with respect to these investments.
We mitigate concentration of risk related to foreign currency hedges through a policy that establishes counterparty limits. The bank counterparties in these contracts expose us to credit-related losses in the event of their nonperformance. However, to mitigate that risk, we only contract with counterparties who meet our minimum requirements under our counterparty risk assessment process. In addition, our hedging policy establishes maximum limits for each counterparty. We monitor ratings, credit spreads and potential downgrades on at least a quarterly basis. Based on our on-going assessment of counterparty risk, we will adjust our exposure to various counterparties.
95
TABLE OF CONTENTS
ADOBE SYSTEMS INCORPORATED
NOTES TO CONSOLIDATED FINANCIAL STATEMENTS (Continued)
The aggregate fair value of derivative instruments in net asset positions as of November 27, 2009 was $4.3 million. This amount represents the maximum exposure to loss at the reporting date as a result of all of the counterparties failing to perform as contracted. This exposure could be reduced by up to $1.6 million of liabilities included in master netting arrangements with those same counterparties.
Credit risk in receivables is limited to OEMs, dealers and distributors of hardware and software products to the retail market, and to customers to whom we license software directly. A credit review is completed for our new distributors, dealers and OEMs. We also perform ongoing credit evaluations of our customers' financial condition and require letters of credit or other guarantees, whenever deemed necessary. The credit limit given to the customer is based on our risk assessment of their ability to pay, country risk and other factors and is not contingent on the resale of the product or on the collection of payments from their customers. We also purchase credit insurance to mitigate credit risk in some foreign markets where we believe it is warranted. If we license our software to a customer where we have a reason to believe the customer's ability to pay is not probable, due to country risk or credit risk, we will not recognize the revenue. We will revert to recognizing the revenue on a cash basis, assuming all other criteria for revenue recognition has been met. See Note 20 for information regarding our significant customers.
We derive a significant portion of our OEM PostScript and Other licensing revenue from a small number of OEMs. Our OEMs on occasion seek to renegotiate their royalty arrangements. We evaluate these requests on a case-by-case basis. If an agreement is not reached, a customer may decide to pursue other options, which could result in lower licensing revenue for us.
NOTE 6. PROPERTY AND EQUIPMENT
Property and equipment, net consisted of the following as of November 27, 2009 and November 28, 2008 (in thousands):
2009 | 2008 | |||||||
Computers and equipment | $ | 409,595 | $ | 331,235 | ||||
Furniture and fixtures | 62,786 | 56,253 | ||||||
Capital projects in-progress | 19,931 | 7,273 | ||||||
Leasehold improvements | 152,200 | 133,571 | ||||||
Land | 86,493 | 74,835 | ||||||
Buildings | 99,845 | 62,464 | ||||||
Total | 830,850 | 665,631 | ||||||
Less accumulated depreciation and amortization. | (442,718 | ) | (352,594 | ) | ||||
Property and equipment, net. | $ | 388,132 | $ | 313,037 |
Depreciation and amortization expense of property and equipment for fiscal 2009, 2008 and 2007 was $95.9 million, $83.3 million and $73.2 million, respectively.
NOTE 7. GOODWILL AND PURCHASED AND OTHER INTANGIBLES
Goodwill by reportable segment, as of November 27, 2009 was as follows (in thousands):
2008 | Acquisitions | Other (*) | 2009 | |||||||||||||
Creative Solutions | $ | 956,011 | $ | 253,463 | $ | 1,126 | $ | 1,210,600 | ||||||||
Knowledge Worker | 408,318 | - | 2,255 | 410,573 | ||||||||||||
Enterprise | 298,039 | - | (4,310 | ) | 293,729 | |||||||||||
Platform | 265,518 | - | (398 | ) | 265,120 | |||||||||||
Print and Publishing | 206,844 | - | (311 | ) | 206,533 | |||||||||||
Omniture | - | 1,108,034 | - | 1,108,034 | ||||||||||||
Goodwill | $ | 2,134,730 | $ | 1,361,497 | $ | (1,638 | ) | $ | 3,494,589 |
_________________________________________
(*) | Includes net reductions in goodwill of $5.2 million for tax related obligations associated with our acquisitions of Macromedia and Accelio in addition to a facility lease obligation adjustment of $1.7 million related to Macromedia, offset in part by foreign currency translation adjustments and other individually insignificant tax items. |
96
TABLE OF CONTENTS
ADOBE SYSTEMS INCORPORATED
NOTES TO CONSOLIDATED FINANCIAL STATEMENTS (Continued)
See Note 2 for further information regarding our acquisitions.
Purchased and other intangible assets, net by reportable segment as of November 27, 2009 and November 28, 2008 were as follows (in thousands):
2009 | 2008 | |||||||
Creative Solutions | $ | 124,178 | $ | 107,526 | ||||
Knowledge Worker | 23,041 | 48,851 | ||||||
Enterprise | 6,588 | 13,146 | ||||||
Platform | 9,159 | 26,248 | ||||||
Print and Publishing | 6,218 | 19,189 | ||||||
Omniture | 358,204 | - | ||||||
Purchased and other intangible assets, net | $ | 527,388 | $ | 214,960 |
Purchased and other intangible assets subject to amortization as of November 27, 2009 were as follows (in thousands):
Cost | Accumulated Amortization | Net | ||||||||||
Purchased technology | $ | 586,952 | $ | (387,731 | ) | $ | 199,221 | |||||
Localization | $ | 20,284 | $ | (15,222 | ) | $ | 5,062 | |||||
Trademarks | 172,030 | (104,953 | ) | 67,077 | ||||||||
Customer contracts and relationships | 363,922 | (159,450 | ) | 204,472 | ||||||||
Other intangibles | 54,535 | (2,979 | ) | 51,556 | ||||||||
Total other intangible assets | $ | 610,771 | $ | (282,604 | ) | $ | 328,167 | |||||
Purchased and other intangible assets | $ | 1,197,723 | $ | (670,335 | ) | $ | 527,388 |
Purchased and other intangible assets subject to amortization as of November 28, 2008 were as follows (in thousands):
Cost | Accumulated Amortization | Net | ||||||||||
Purchased technology | $ | 411,408 | $ | (338,608 | ) | $ | 72,800 | |||||
Localization | $ | 23,751 | $ | (6,156 | ) | $ | 17,595 | |||||
Trademarks | 130,925 | (78,181 | ) | 52,744 | ||||||||
Customer contracts and relationships | 198,891 | (127,520 | ) | 71,371 | ||||||||
Other intangibles | 800 | (350 | ) | 450 | ||||||||
Total other intangible assets | $ | 354,367 | $ | (212,207 | ) | $ | 142,160 | |||||
Purchased and other intangible assets | $ | 765,775 | $ | (550,815 | ) | $ | 214,960 |
Amortization expense related to purchased and other intangible assets was $151.3 million, $184.4 million and $216.3 million for fiscal 2009, 2008 and 2007, respectively. Of these amounts, for fiscal 2009, 2008 and 2007, $88.3 million, $116.1 million and $145.4 million, respectively, was included in cost of sales.
Purchased and other intangible assets are amortized over their estimated useful lives of 1 to 13 years. As of November 27, 2009, we expect amortization expense in future periods to be as follows (in thousands):
Fiscal Year |
| Purchased Technology | Other Intangible Assets | ||||||
2010 | $ | 35,830 | $ | 100,403 | |||||
2011 | 32,446 | 58,494 | |||||||
2012 | 30,840 | 22,068 | |||||||
2013 | 26,867 | 21,447 | |||||||
2014 | 25,110 | 21,046 | |||||||
Thereafter | 48,128 | 104,709 | |||||||
Total expected amortization expense | $ | 199,221 | $ | 328,167 | |||||
97
TABLE OF CONTENTS
ADOBE SYSTEMS INCORPORATED
NOTES TO CONSOLIDATED FINANCIAL STATEMENTS (Continued)
NOTE 8. OTHER ASSETS
Other assets as of November 27, 2009 and November 28, 2008 consisted of the following (in thousands):
2009 | 2008 | |||||||
Acquired rights to use technology | $ | 84,313 | $ | 90,643 | ||||
Investments | 63,526 | 76,589 | ||||||
Security and other deposits | 11,692 | 16,087 | ||||||
Prepaid royalties | 12,059 | 9,026 | ||||||
Deferred compensation plan assets | 9,045 | 7,560 | ||||||
Restricted cash | 4,650 | 7,361 | ||||||
Prepaid land lease | 3,209 | 3,185 | ||||||
Prepaid rent | 1,377 | 2,658 | ||||||
Other | 1,394 | 3,420 | ||||||
Other assets | $ | 191,265 | $ | 216,529 |
Acquired rights to use technology purchased during fiscal 2009 and fiscal 2008 was $6.0 million and $100.4 million, respectively. Of the cost for fiscal 2008, an estimated $56.4 million was related to future licensing rights and has been capitalized and is being amortized on a straight-line basis over the estimated useful lives up to fifteen years. Of the remaining costs for fiscal 2008, we estimated that $27.2 million was related to historical use of licensing rights which was expensed as cost of sales and the residual of $16.8 million for fiscal 2008 was expensed as general and administrative costs. In connection with these licensing arrangements, we have the ability to acquire additional rights to use technology in the future. See Note 17 for further information regarding our contractual commitments.
In general, acquired rights to use technology are amortized over their estimated useful lives of 3 to 15 years.
Included in investments are our indirect investments through our limited partnership interest in Adobe Ventures of approximately $37.1 million and $39.0 million as of November 27, 2009 and November 28, 2008, respectively, which is consolidated in accordance with the provisions for consolidating variable interest entities. The partnership is controlled by Granite Ventures, an independent venture capital firm and sole general partner of Adobe Ventures. We are the primary beneficiary of Adobe Ventures and bear virtually all of the risks and rewards related to our ownership . Our investment in Adobe Ventures does not have a significant impact on our consolidated financial position, results of operations or cash flows.
Adobe Ventures carries its investments in equity securities at estimated fair value and investment gains and losses are included in our Consolidated Statements of Income. Substantially all of the investments held by Adobe Ventures at November 27, 2009 and November 28, 2008 are not publicly traded and, therefore, there is no established market for these securities. In order to determine the fair value of these investments, we use the most recent round of financing involving new non-strategic investors or estimates of current market value made by Granite Ventures. It is our policy to evaluate the fair value of these investments held by Adobe Ventures, as well as our direct investments, on a regular basis. This evaluation includes, but is not limited to, reviewing each company's cash position, financing needs, earnings and revenue outlook, operational performance, management and ownership changes and competition. In the case of privately-held companies, this evaluation is based on information that we request from these companies. This information is not subject to the same disclosure regulations as U.S. publicly traded companies and as such, the basis for these evaluations is subject to the timing and the accuracy of the data received from these companies. See Note 4 for further information regarding Adobe Ventures.
Also included in investments are our direct investments in privately-held companies of approximately $26.4 million and $37.6 million as of November 27, 2009 and November 28, 2008, respectively, which are accounted for based on the cost method. We assess these investments for impairment in value as circumstances dictate. See Note 4 for further information regarding our cost method investments.
We entered into a Purchase and Sale Agreement, effective May 12, 2008, for the acquisition of real property located in Waltham, Massachusetts. We purchased the property upon completion of construction of an office building shell and core, parking structure, and site improvements. The purchase price for the property was $44.7 million and closed on June 16, 2009. We made an initial deposit of $7.0 million which was included in security and other deposits as of November 28, 2008 and the remaining balance was paid at closing. This deposit was held in escrow until closing and then applied to the purchase price.
98
TABLE OF CONTENTS
ADOBE SYSTEMS INCORPORATED
NOTES TO CONSOLIDATED FINANCIAL STATEMENTS (Continued)
Other assets include the fair value, at inception, of the residual value guarantee associated with our leases on the buildings we occupy as part of our corporate headquarters. The lease agreements for our corporate headquarters provide for residual value guarantees. The fair value of a residual value guarantee in lease agreements entered into after December 31, 2002, must be recognized as a liability on our Consolidated Balance Sheets. As such, we recognized $5.2 million and $3.0 million in liabilities, related to the extended East and West Towers and Almaden Tower leases, respectively. These liabilities are recorded in other long-term liabilities with the offsetting entry recorded as prepaid rent in other assets. The balance is being amortized to the Consolidated Statements of Income over the life of the leases. As of November 27, 2009 and November 28, 2008, the unamortized portion of the fair value of the residual value guarantees remaining in other long-term liabilities and prepaid rent was $1.3 million and $2.6 million, respectively.
NOTE 9. ACCRUED EXPENSES
Accrued expenses as of November 27, 2009 and November 28, 2008 consisted of the following (in thousands):
2009 | 2008 | |||||||
Accrued compensation and benefits | $ | 164,352 | $ | 177,760 | ||||
Taxes payable | 11,879 | 21,760 | ||||||
Sales and marketing allowances | 32,774 | 28,127 | ||||||
Other | 210,641 | 172,322 | ||||||
Accrued expenses | $ | 419,646 | $ | 399,969 |
Other primarily includes general corporate accruals for corporate marketing programs, local and regional expenses, and technical support. Other is also comprised of deferred rent related to office locations with rent escalations, accrued royalties, foreign currency derivatives and accrued interest on the credit facility.
NOTE 10. INCOME TAXES
Income before income taxes includes income from foreign operations of $422.4 million, $740.3 million and $453.2 million for fiscal 2009, 2008 and 2007, respectively.
The provision for income taxes for fiscal 2009, 2008 and 2007 consisted of the following (in thousands):
2009 | 2008 | 2007 (*) | ||||||||||
Current: | ||||||||||||
United States federal | $ | 152,840 | $ | 24,179 | $ | 36,614 | ||||||
Foreign | 36,794 | 27,680 | 55,536 | |||||||||
State and local | 25,427 | 6,972 | 4,100 | |||||||||
Total current | 215,061 | 58,831 | 96,250 | |||||||||
Deferred: | ||||||||||||
United States federal | 50,376 | 41,678 | 50,640 | |||||||||
Foreign | 559 | (9,693 | ) | (13,480 | ) | |||||||
State and local | 4,635 | 25,518 | 23,007 | |||||||||
Total deferred | 55,570 | 57,503 | 60,167 | |||||||||
Tax expense attributable to employee stock plans | 44,381 | 90,360 | 66,966 | |||||||||
Provision for income taxes | $ | 315,012 | $ | 206,694 | $ | 223,383 |
_________________________________________
(*) | Certain employee stock plan benefits in fiscal 2007 associated with the acquisition of Macromedia reduced goodwill. See Note 7 for further information regarding our goodwill . |
99
TABLE OF CONTENTS
ADOBE SYSTEMS INCORPORATED
NOTES TO CONSOLIDATED FINANCIAL STATEMENTS (Continued)
Total income tax expense differs from the expected tax expense (computed by multiplying the U.S. federal statutory rate of 35% by income before income taxes) as a result of the following (in thousands):
2009 | 2008 | 2007 | ||||||||||
Computed "expected" tax expense | $ | 245,532 | $ | 377,478 | $ | 331,516 | ||||||
State tax expense, net of federal benefit | 7,799 | 12,700 | 8,938 | |||||||||
Tax-exempt income | - | (342 | ) | (11,123 | ) | |||||||
Tax credits | (14,127 | ) | (12,873 | ) | (23,341 | ) | ||||||
Differences between statutory rate and foreign effective tax rate | (91,262 | ) | (132,470 | ) | (84,740 | ) | ||||||
Change in deferred tax asset valuation allowance | 2,759 | (1,105 | ) | 1,694 | ||||||||
Stock-based compensation (net of tax deduction) | 6,085 | 5,457 | 2,587 | |||||||||
Resolution of U.S. income tax exam for fiscal 2001 - 2004 years | - | (20,712 | ) | - | ||||||||
Foreign tax refund for fiscal 2000 - 2002 | - | (16,351 | ) | - | ||||||||
Domestic manufacturing deduction benefit | (7,525 | ) | (6,300 | ) | (4,419 | ) | ||||||
Tax charge for licensing Omniture's technology to foreign subsidiaries | 161,701 | - | - | |||||||||
Other, net | 4,050 | 1,212 | 2,271 | |||||||||
Provision for income taxes | $ | 315,012 | $ | 206,694 | $ | 223,383 |
Deferred Tax Assets and Liabilities
The tax effects of the temporary differences that gave rise to significant portions of the deferred tax assets and liabilities as of November 28, 2008 and November 27, 2009 are presented below (in thousands):
2009 | 2008 | |||||||
Deferred tax assets: | ||||||||
Acquired technology | $ | 937 | $ | 4,497 | ||||
Reserves and accruals | 68,472 | 71,174 | ||||||
Deferred revenue | 17,441 | 46,200 | ||||||
Unrealized losses on investments | 15,263 | 10,350 | ||||||
Stock-based compensation | 56,541 | 50,329 | ||||||
Net operating loss of acquired companies | 56,138 | 7,621 | ||||||
Credits | 12,205 | 19,130 | ||||||
Capitalized expenses | 5,701 | 5,688 | ||||||
Other | 11,603 | 3,538 | ||||||
Total gross deferred tax assets | 244,301 | 218,527 | ||||||
Deferred tax asset valuation allowance | (4,283 | ) | (1,524 | ) | ||||
Total deferred tax assets | 240,018 | 217,003 | ||||||
Deferred tax liabilities: | ||||||||
Depreciation and amortization | (11,975 | ) | (3,113 | ) | ||||
Undistributed earnings of foreign subsidiaries | (210,619 | ) | (167,760 | ) | ||||
Acquired intangible assets | (192,493 | ) | (52,745 | ) | ||||
Total deferred tax liabilities | (415,087 | ) | (223,618 | ) | ||||
Net deferred tax (liabilities) assets | $ | (175,069 | ) | $ | (6,615 | ) |
The deferred tax assets and liabilities for fiscal 2009 and fiscal 2008 include amounts related to various acquisitions. The total change in deferred tax assets and liabilities in fiscal 2009 includes changes that are recorded to other comprehensive income, additional paid-in capital, goodwill and retained earnings.
We provide U.S. income taxes on the earnings of foreign subsidiaries unless the subsidiaries' earnings are considered permanently reinvested outside the U.S. To the extent that the foreign earnings previously treated as permanently reinvested are repatriated, the related U.S. tax liability may be reduced by any foreign income taxes paid on these earnings. As of November 27, 2009, the cumulative amount of earnings upon which U.S. income taxes have not been provided is approximately $1.5 billion. The unrecognized deferred tax liability for these earnings is approximately $420.9 million.
100
TABLE OF CONTENTS
ADOBE SYSTEMS INCORPORATED
NOTES TO CONSOLIDATED FINANCIAL STATEMENTS (Continued)
As of November 27, 2009, we have net operating loss carryforward assets of approximately $135.0 million for federal, $56.2 million for state and $1.6 million related to foreign net operating losses. We also have federal and state tax credit carryforwards of approximately $2.9 million and $13.8 million, respectively. The net operating loss carryforward assets, federal tax credits and foreign tax credits will expire in various years from fiscal 2014 through 2029. The state tax credit carryforwards can be carried forward indefinitely. The net operating loss carryforward assets and certain credits are subject to an annual limitation under Internal Revenue Code Section 382, but are expected to be fully realized.
In addition, we have been tracking certain deferred tax attributes of $82.8 million which have not been recorded in the financial statements pursuant to accounting standards related to stock-based compensation. These amounts are no longer included in our gross or net deferred tax assets. Pursuant to these standards, the benefit of these deferred tax assets will be recorded to equity when they reduce taxes payable.
A valuation allowance has been established for certain deferred tax assets related to the impairment of investments. At the end of fiscal 2009, our valuation allowance was $4.3 million.
Accounting for Uncertainty in Income Taxes
On December 1, 2007, we adopted new standards related to how tax benefits for uncertain tax positions are to be recognized, measured, and derecognized in the financial statements. These standards also specify how liabilities for uncertain tax positions should be classified on the balance sheet. The adoption of these standards resulted in an increase of $3.9 million to both assets and unrecognized tax benefits in our Consolidated Balance Sheets as of the beginning of fiscal 2008. Upon adoption, the gross liability for unrecognized tax benefits at December 1, 2007 was $218.4 million, exclusive of interest and penalties.
Prior to the adoption of this new accounting standard, we presented our estimated liability for unrecognized tax benefits as a current liability. These new standards require liabilities for unrecognized tax benefits to be classified based on whether a payment is expected to be made within the next 12 months. That is, amounts expected to be paid within the next 12 months are to be classified as a current liability and all other amounts are to be classified as a non-current liability. As a result of adopting these standards, we reclassified $197.7 million from current income taxes payable to long-term income taxes payable, including accrued interest in our Consolidated Balance Sheets.
Prior to the adoption of this new accounting standard, we presented our estimated state, local and interest liabilities net of the estimated benefit we expect to receive from deducting such payments on future tax returns (i.e., on a "net" basis). These standards require this estimated benefit to be classified as a deferred tax asset instead of a reduction of the overall liability (i.e., on a "gross" basis). Accordingly, we recognized additional deferred income tax assets of $3.9 million to present the unrecognized tax benefits as gross amounts in our Consolidated Balance Sheets.
We classify interest and penalties on unrecognized tax benefits as income tax expense. As of December 1, 2007, the combined amount of accrued interest and penalties related to tax positions taken on our tax returns and included in non-current income taxes payable was approximately $42.8 million.
During fiscal 2009 and 2008, our aggregate changes in our total gross amount of unrecognized tax benefits are summarized as follows (in thousands):
| 2009 | 2008 | |||||||
Beginning balance | $ | 139,549 | $ | 201,808 | ||||
Gross increases in unrecognized tax benefits – prior year tax positions | 43,173 | 14,009 | ||||||
Gross increases in unrecognized tax benefits – current year tax positions | 42,422 | 11,350 | ||||||
Settlements with taxing authorities | (429 | ) | (81,213 | ) | ||||
Lapse of statute of limitations | (12,585 | ) | (3,512 | ) | ||||
Foreign exchange gains and losses | 5,910 | (2,893 | ) | |||||
Ending balance | $ | 218,040 | $ | 139,549 |
As of November 27, 2009, the combined amount of accrued interest and penalties related to tax positions taken on our tax returns and included in non-current income taxes payable was approximately $16.6 million.
101
TABLE OF CONTENTS
ADOBE SYSTEMS INCORPORATED
NOTES TO CONSOLIDATED FINANCIAL STATEMENTS (Continued)
We file income tax returns in the U.S. on a federal basis and in many U.S. state and foreign jurisdictions. We are subject to the continual examination of our income tax returns by the IRS and other domestic and foreign tax authorities. Our major tax jurisdictions are the U.S., Ireland and California. For California, Ireland and the U.S., the earliest fiscal years open for examination are 2001, 2004 and 2005, respectively. We regularly assess the likelihood of outcomes resulting from these examinations to determine the adequacy of our provision for income taxes and have reserved for potential adjustments that may result from the current examination. We believe such estimates to be reasonable; however, there can be no assurance that the final determination of any of these examinations will not have an adverse effect on our operating results and financial position.
The timing of the resolution of income tax examinations is highly uncertain as are the amounts and timing of tax payments that are part of any audit settlement process. These events could cause large fluctuations in the balance sheet classification of current and non-current assets and liabilities. The Company believes that before the end of fiscal 2010, it is reasonably possible that either certain audits will conclude or statutes of limitations on certain income tax examination periods will expire, or both. Given the uncertainties described above, we can only determine a range of estimated potential decreases in underlying unrecognized tax benefits equal to $0 to approximately $10 million. These amounts would decrease income tax expense under current GAAP related to income taxes and as a result of our adoption of new accounting standards related to business combinations in fiscal 2010 ( see Note 1 ). Under the new guidance related to business combinations, adjustments to acquired income tax liabilities (including adjustments for acquisitions completed prior to the effective date) that are recorded subsequent to the acquisition date will be recognized in income from continuing operations, with certain exceptions, if such changes occur after the measurement period.
NOTE 11. RESTRUCTURING
2009 Restructuring Plan Charges
On November 10, 2009, we initiated a restructuring plan to appropriately align our costs in connection with our fiscal 2010 operating plan impacting up to approximately 630 full-time positions worldwide. In connection with this restructuring plan, in the fourth quarter of fiscal 2009, we recorded restructuring charges of approximately $25.5 million related to ongoing termination benefits for the elimination of approximately 340 of these full-time positions worldwide. As of November 27, 2009, approximately $2.5 million was paid. The remaining accrual associated with these ongoing termination benefits is expected to be paid during fiscal 2010. The restructuring activities related to this program affect only those employees that were associated with Adobe prior to the acquisition of Omniture, Inc. on October 23, 2009.
Beginning in the first quarter of fiscal 2010, we expect to incur up to approximately $18 million related to the consolidation of leased facilities.
The following table sets forth a summary of Adobe restructuring activities during fiscal 2009 (in thousands):
November 28, 2008 | Costs Incurred | Cash Payments | Other Adjustments | November 27, 2009 | ||||||||||||||||
Termination benefits | $ | - | $ | 25,521 | $ | (2,537 | ) | $ | - | $ | 22,984 |
Accrued restructuring charges of approximately $23.0 million at November 27, 2009 is recorded in accrued restructuring, current in our Consolidated Balance Sheets.
Omniture Restructuring Charges
We completed our acquisition of Omniture on October 23, 2009. In the fourth quarter of fiscal 2009, we initiated a plan to restructure the pre-merger operations of Omniture to eliminate certain duplicative activities, focus our resources on future growth opportunities and reduce our cost structure. In connection with this restructuring plan, we accrued a total of approximately $10.6 million in costs related to termination benefits for the elimination of approximately 100 regular positions and for the closure of duplicative facilities. We also accrued approximately $0.2 million in costs related to the cancellation of certain contracts associated with the wind-down of subsidiaries and other service contracts held by Omniture. Restructuring charges related to the Omniture acquisition were recorded as a part of the purchase price allocation, as discussed in Note 2 and have been accrued for as of November 27, 2009.
102
TABLE OF CONTENTS
ADOBE SYSTEMS INCORPORATED
NOTES TO CONSOLIDATED FINANCIAL STATEMENTS (Continued)
The following table sets forth a summary of preliminary restructuring activities during fiscal 2009 (in thousands):
November 28, 2008 | Costs Recorded | Cash Payments | Other Adjustments | November 27, 2009 | ||||||||||||||||
Termination benefits | $ | - | $ | 6,704 | $ | - | $ | 8 | $ | 6,712 | ||||||||||
Cost of closing redundant facilities | - | 3,914 | - | 19 | 3,933 | |||||||||||||||
Contract termination | - | 242 | - | - | 242 | |||||||||||||||
Total | $ | - | $ | 10,860 | $ | - | $ | 27 | $ | 10,887 |
Accrued restructuring charges of approximately $10.9 million at November 27, 2009 include $8.6 million recorded in accrued restructuring, current and $2.3 million related to long-term facilities obligations recorded in accrued restructuring, non-current in our Consolidated Balance Sheets. We expect to pay accrued termination benefits during fiscal 2010. We expect to pay facilities-related liabilities through fiscal 2013. Included in the other adjustments column are foreign currency translation adjustments.
Additionally, approximately $1.5 million of restructuring costs related to facilities were included in the liabilities assumed by us upon acquisition of Omniture on October 23, 2009 for which subsequent payments of $0.1 million were made during the fourth quarter of fiscal 2009. Restructuring costs related to these facilities were approximately $1.4 million at November 27, 2009 with $1.2 million recorded in accrued restructuring, current and $0.2 million related to long-term facilities obligations recorded in accrued restructuring, non-current in our Consolidated Balance Sheets. We expect to pay these facilities-related liabilities through fiscal 2013.
2008 Restructuring Plan Charges
In the fourth quarter of fiscal 2008, we initiated a restructuring program, consisting of reductions in workforce of approximately 560 full-time positions globally and the consolidation of facilities, in order to reduce our operating costs and focus our resources on key strategic priorities. In connection with this restructuring program, we recorded restructuring charges in the fourth quarter of fiscal 2008 totaling $29.2 million related to ongoing termination benefits for the elimination of approximately 460 of the 560 full-time positions globally. As of November 28, 2008, $0.4 million was paid.
During fiscal 2009, we continued to implement restructuring activities under this program. We vacated approximately 89,000 square feet of research and development and sales facilities in the U.S., the United Kingdom and Canada. We accrued $8.5 million for the fair value of our future contractual obligations under these operating leases using our credit-adjusted risk-free interest rate, estimated at approximately 6% as of the date we ceased to use the leased properties. This amount is net of the fair value of future estimated sublease income of approximately $4.4 million. We also recorded additional charges of $6.7 million for termination benefits for the elimination of substantially all of the remaining 100 full-time positions expected to be terminated.
The following table sets forth a summary of Adobe restructuring activities during fiscal 2009 (in thousands):
November 28, 2008 | Costs Incurred | Cash Payments | Other Adjustments | November 27, 2009 | ||||||||||||||||
Termination benefits | $ | 28,759 | $ | 6,722 | $ | (34,191 | ) | $ | (233 | ) | $ | 1,057 | ||||||||
Cost of closing redundant facilities | - | 8,514 | (5,380 | ) | 248 | 3,382 | ||||||||||||||
Total | $ | 28,759 | $ | 15,236 | $ | (39,571 | ) | $ | 15 | $ | 4,439 |
Accrued restructuring charges of approximately $4.4 million at November 27, 2009 include $1.9 million recorded in accrued restructuring, current and $2.5 million related to long-term facilities obligations recorded in accrued restructuring, non-current in our Consolidated Balance Sheets. Total costs incurred to date and expected to be incurred for closing redundant facilities are $44.5 million and $44.7 million, respectively. We have substantially paid all of the accrued termination benefits during fiscal 2009. We expect to pay facilities-related liabilities through fiscal 2013.
Included in the other adjustments column are foreign currency translation adjustments of $0.6 million and small changes to previous estimates.
103
TABLE OF CONTENTS
ADOBE SYSTEMS INCORPORATED
NOTES TO CONSOLIDATED FINANCIAL STATEMENTS (Continued)
Macromedia Merger Restructuring Charges
We completed our acquisition of Macromedia on December 3, 2005. In connection with this acquisition, we initiated plans to restructure both the pre-merger operations of Adobe and Macromedia to eliminate certain duplicative activities, focus our resources on future growth opportunities and reduce our cost structure. In connection with the worldwide restructuring plan, we recognized costs related to termination benefits for employee positions that were eliminated and for the closure of duplicative facilities. We also recognized costs related to the cancellation of certain contracts associated with the wind-down of subsidiaries and other service contracts held by Macromedia. Costs for termination benefits and contract terminations were completed during fiscal 2007. Total costs incurred were $27.0 million and $3.2 million, respectively.
The following table sets forth a summary of Macromedia restructuring activities during fiscal 2009 (in thousands):
November 28, 2008 | Cash Payments | Other Adjustments | November 27, 2009 | |||||||||||||
Cost of closing redundant facilities | $ | 12,168 | $ | (6,675 | ) | $ | (487 | ) | $ | 5,006 | ||||||
Other | 977 | (889 | ) | (80 | ) | 8 | ||||||||||
Total | $ | 13,145 | $ | (7,564 | ) | $ | (567 | ) | $ | 5,014 |
Accrued restructuring charges of approximately $5.0 million at November 27, 2009 related to facilities obligations include $3.1 million recorded in accrued restructuring, current and $1.9 million recorded in accrued restructuring, non-current in our Consolidated Balance Sheets. We expect to pay these liabilities through fiscal 2012.
Included in the other adjustments column is a change to previous estimates of $0.6 million offset in part by small foreign currency translation adjustments. Included in the change in previous estimates of $0.6 million is an adjustment of $1.7 million associated with an accrual for a leased facility that was included in the purchase price of Macromedia as an assumed liability. During the third quarter of fiscal 2009, adjustments were made to the liability for this lease facility that were recorded as a reduction to Macromedia goodwill. Accordingly, during fiscal 2009, $1.1 million represents adjustments recorded as an increase to restructuring charges.
The following table sets forth a summary of Macromedia restructuring activities during fiscal 2008 (in thousands):
November 30, 2007 | Cash Payments | Other Adjustments | November 28, 2008 | |||||||||||||
Cost of closing redundant facilities | $ | 16,283 | $ | (7,187 | ) | $ | 3,072 | $ | 12,168 | |||||||
| Other | 1,435 | (147 | ) | (311 | ) | 977 | ||||||||||
| Total | $ | 17,718 | $ | (7,334 | ) | $ | 2,761 | $ | 13,145 |
Accrued restructuring charges of $13.1 million at November 28, 2008 includes $6.9 million recorded in accrued restructuring, current and $6.2 million, related to long-term facilities obligations, recorded in accrued restructuring, non-current in our Consolidated Balance Sheets. Included in the other adjustments column is a change to previous estimates, recorded as a current period expense, associated with closing redundant facilities as a result of the Macromedia acquisition as well as the net effect of foreign currency changes.
NOTE 12. BENEFIT PLANS
Retirement Savings Plan
In 1987, we adopted an Employee Investment Plan, qualified under Section 401(k) of the Internal Revenue Code, which is a retirement savings plan covering substantially all of our U.S. employees, now referred to as the Adobe 401(k) Retirement Savings Plan. Under the plan, eligible employees may contribute up to 65% of their pretax or after-tax salary, subject to the Internal Revenue Service annual contribution limits. In fiscal 2009, we matched 50% of the first 6% of the employee's eligible compensation. We contributed $15.1 million, $16.6 million and $14.5 million in fiscal 2009, 2008 and 2007, respectively. We can terminate matching contributions at our discretion.
104
TABLE OF CONTENTS
ADOBE SYSTEMS INCORPORATED
NOTES TO CONSOLIDATED FINANCIAL STATEMENTS (Continued)
Profit Sharing Plan
We have a profit sharing plan that provides for profit sharing payments to all eligible employees following each quarter in which we achieve at least 75% of our budgeted earnings for the quarter for fiscal 2009 and 80% of our budgeted earnings for the quarter for fiscal years 2008 and 2007. The plan, as well as the annual operating budget on which the plan is based, is approved by our Board of Directors. We contributed $13.3 million, $73.8 million and $67.6 million to the plan in fiscal 2009, 2008 and 2007, respectively. The profit sharing plan has been discontinued effective for fiscal 2010.
Deferred Compensation Plan
On September 21, 2006, the Board of Directors approved the Adobe Systems Incorporated Deferred Compensation Plan, effective December 2, 2006 (the "Deferred Compensation Plan"). The Deferred Compensation Plan is an unfunded, non-qualified, deferred compensation arrangement under which certain executives and members of the Board of Directors are able to defer a portion of their annual compensation. Participants may elect to contribute up to 75% of their base salary and 100% of other specified compensation, including commissions, bonuses, performance-based and time-based restricted stock units, and directors' fees. Participants are able to elect the payment of benefits to begin on a specified date at least three years after the end of the plan year in which the election is made in the form of a lump sum or annual installments over five, ten or fifteen years. Upon termination of a participant's employment with Adobe, such participant will receive a distribution in the form of a lump sum payment. All distributions will be made in cash, except for deferred performance-based and time-based restricted stock units which will be settled in stock. As of November 27, 2009 and November 28, 2008, the invested amounts under the Deferred Compensation Plan total $9.0 million and $7.6 million, respectively and were recorded as other assets on our Consolidated Balance Sheets. As of November 27, 2009 and November 28, 2008, $9.0 million and $7.6 million, respectively, was recorded as long-term liabilities to recognize undistributed deferred compensation due to employees.
NOTE 13. STOCK-BASED COMPENSATION
We have the following stock-based compensation plans and programs:
Stock Option Plans
Our stock option program is a long-term retention program that is intended to attract, retain and provide incentives for talented employees, officers and directors, and to align stockholder and employee interests. Currently, we grant options from the (i) 2003 Equity Incentive Plan, as amended ("2003 Plan"), and the 2005 Equity Incentive Assumption Plan ("2005 Assumption Plan"). These plans are collectively referred to in the following discussion as "the Plans." Under the Plans, options can be granted to all employees, including executive officers, outside consultants and non-employee directors. The Plans will continue until the earlier of (i) termination by the Board or (ii) the date on which all of the shares available for issuance under the plan have been issued and restrictions on issued shares have lapsed. Option vesting periods are generally four years for all of the Plans. Options granted under the Plans generally expire seven years from the effective date of grant.
As of November 27, 2009, we had reserved 110.3 million and 4.0 million shares of common stock for issuance under our 2003 Plan and 2005 Assumption Plan, respectively. As of November 27, 2009, we had 42.7 million and 2.9 million shares available for grant under our 2003 Plan and 2005 Assumption Plan, respectively.
Employee Stock Purchase Plan
Our 1997 Employee Stock Purchase Plan ("ESPP") allows eligible employee participants to purchase shares of our common stock at a discount through payroll deductions. The ESPP consists of a twenty-four month offering period with four six-month purchase periods in each offering period. Employees purchase shares in each purchase period at 85% of the market value of our common stock at either the beginning of the offering period or the end of the purchase period, whichever price is lower. The ESPP will continue until the earlier of (i) termination by the Board or (ii) the date on which all of the shares available for issuance under the plan have been issued.
As of November 27, 2009, we had reserved 76.0 million shares of our common stock for issuance under the ESPP and approximately 12.3 million shares remain available for future issuance.
105
TABLE OF CONTENTS
ADOBE SYSTEMS INCORPORATED
NOTES TO CONSOLIDATED FINANCIAL STATEMENTS (Continued)
Restricted Stock Plan
We grant restricted stock awards and performance awards to officers and key employees under our Amended 1994 Performance and Restricted Stock Plan ("Restricted Stock Plan"). We can also grant restricted stock units to all eligible employees under the Restricted Stock Plan and the 2003 Plan. Restricted stock awards issued under these plans vest annually over three years. Performance awards and restricted stock units issued under these plans generally vest over four years, the majority of which vest 25% annually; certain other restricted stock units vest 50% on the second anniversary and 25% on each of the third and fourth anniversaries.
As of November 27, 2009, we had reserved 16.0 million shares of our common stock for issuance under the Restricted Stock Plan and approximately 0.3 million shares were available for grant.
Performance Share Programs
Effective January 26, 2009, the Executive Compensation Committee adopted the 2009 Performance Share Program (the "2009 Program"). The purpose of the 2009 Program is to align key management and senior leadership with stockholders' interests and to retain key employees. The measurement period for the 2009 Program is our fiscal 2009 year. All members of our executive management and other key senior leaders are participating in the 2009 Program. Awards granted under the 2009 Program were granted in the form of performance shares pursuant to the terms of our 2003 Equity Incentive Plan. If pre-determined performance goals are met, shares of stock will be granted to the recipient, with 25% vesting on the later of the date of certification of achievement or the first anniversary date of the grant, and the remaining 75% vesting evenly on the following three annual anniversary dates of the grant, contingent upon the recipient's continued service to Adobe. Participants in the 2009 Program have the ability to receive up to 115% of the target number of shares originally granted.
Issuance of Shares
Upon exercise of stock options, vesting of restricted stock and performance shares, and purchases of shares under the ESPP, we will issue treasury stock. If treasury stock is not available, common stock will be issued. In order to minimize the impact of on-going dilution from exercises of stock options and vesting of restricted stock and performance shares, we instituted a stock repurchase program. See Note 14 for information regarding our stock repurchase programs.
Valuation of Stock-Based Compensation
Stock-based compensation cost is measured at the grant date based on the fair value of the award. We currently use the Black-Scholes option pricing model to determine the fair value of stock options and ESPP shares. The determination of the fair value of stock-based payment awards on the date of grant using an option pricing model is affected by our stock price as well as assumptions regarding a number of complex and subjective variables. These variables include our expected stock price volatility over the expected term of the awards, actual and projected employee stock option exercise behaviors, a risk-free interest rate and any expected dividends.
We estimate the expected term of options granted by calculating the average term from our historical stock option exercise experience. We estimate the volatility of our common stock by using implied volatility in market traded options. Our decision to use implied volatility was based upon the availability of actively traded options on our common stock and our assessment that implied volatility is more representative of future stock price trends than historical volatility. We base the risk-free interest rate that we use in the option valuation model on zero-coupon yields implied by U.S. Treasury issues with remaining terms similar to the expected term on the options. We do not anticipate paying any cash dividends in the foreseeable future and therefore use an expected dividend yield of zero in the option valuation model. We are required to estimate forfeitures at the time of grant and revise those estimates in subsequent periods if actual forfeitures differ from those estimates. We use historical data to estimate pre-vesting option forfeitures and record stock-based compensation expense only for those awards that are expected to vest.
The assumptions used to value our option grants were as follows:
Fiscal Years | ||||||||||||
2009 | 2008 | 2007 | ||||||||||
Expected term (in years) | 3.0 – 4.1 | 2.3 – 4.7 | 3.5 – 4.8 | |||||||||
Volatility | 34 – 57 | % | 32 – 60 | % | 30 – 39 | % | ||||||
Risk-free interest rate | 1.16 – 2.24 | % | 1.70 – 3.50 | % | 3.60 – 5.10 | % | ||||||
106
TABLE OF CONTENTS
ADOBE SYSTEMS INCORPORATED
NOTES TO CONSOLIDATED FINANCIAL STATEMENTS (Continued)
The expected term of ESPP shares is the average of the remaining purchase periods under each offering period. The assumptions used to value employee stock purchase rights were as follows:
Fiscal Years | ||||||||||||
2009 | 2008 | 2007 | ||||||||||
Expected term (in years) | 0.5 – 2.0 | 0.5 – 2.0 | 0.5 – 2.0 | |||||||||
Volatility | 40 – 57 | % | 30 – 36 | % | 30 – 33 | % | ||||||
Risk-free interest rate | 0.27 – 1.05 | % | 2.12 – 3.29 | % | 4.79 – 5.11 | % | ||||||
We recognize the estimated compensation cost of restricted stock awards and restricted stock units, net of estimated forfeitures, over the vesting term. The estimated compensation cost is based on the fair value of our common stock on the date of grant.
We recognize the estimated compensation cost of performance shares, net of estimated forfeitures. The awards are earned upon attainment of identified performance goals, some of which contain discretionary metrics. As such, these awards are re-valued based on our traded stock price at the end of each reporting period. If the discretion is removed, the award will be classified as a fixed equity award. The fair value of the awards will be based on the measurement date, which is the date the award becomes fixed. The awards will be subsequently amortized over the remaining performance period.
Summary of Stock Options
Option activity under our stock option program for fiscal years 2009, 2008 and 2007 was as follows (shares in thousands):
| Outstanding Options | ||||||||
Number of Shares | Weighted Average Exercise Price | |||||||
December 1, 2006 | 61,731 | $ | 24.19 | |||||
Granted | 10,084 | 40.36 | ||||||
Exercised | (21,368 | ) | 21.18 | |||||
Cancelled | (2,705 | ) | 33.18 | |||||
November 30, 2007 | 47,742 | $ | 28.47 | |||||
Granted | 5,462 | 35.08 | ||||||
Exercised | (9,983 | ) | 25.45 | |||||
Cancelled | (2,517 | ) | 35.34 | |||||
November 28, 2008 | 40,704 | $ | 29.67 | |||||
Granted | 5,758 | 22.90 | ||||||
Exercised | (7,560 | ) | 17.15 | |||||
Cancelled | (3,160 | ) | 33.57 | |||||
Increase due to acquisition | 5,509 | 20.15 | ||||||
November 27, 2009 | 41,251 | $ | 29.45 | |||||
The weighted average fair values of options granted during fiscal 2009, 2008 and 2007 were $8.39, $10.32 and $12.37, respectively.
The total intrinsic value of options exercised during fiscal 2009, 2008 and 2007 was $91.8 million, $142.4 million and $463.6 million, respectively. The intrinsic value is calculated as the difference between the market value on the date of exercise and the exercise price of the shares.
107
TABLE OF CONTENTS
ADOBE SYSTEMS INCORPORATED
NOTES TO CONSOLIDATED FINANCIAL STATEMENTS (Continued)
Information regarding the stock options outstanding at November 27, 2009, November 28, 2008 and November 30, 2007 is summarized below:
Number of Shares (thousands) |
Weighted Average Exercise Price | Weighted Average Remaining Contractual Life (years) |
Aggregate Intrinsic Value (*) (millions) | |||||||||||||
As of November 27, 2009 | ||||||||||||||||
Options outstanding | 41,251 | $ | 29.45 | 4.33 | $ | 295.8 | ||||||||||
Options vested and expected to vest | 39,322 | $ | 29.54 | 4.24 | $ | 279.1 | ||||||||||
Options exercisable | 26,677 | $ | 29.85 | 3.54 | $ | 181.7 | ||||||||||
As of November 28, 2008 | ||||||||||||||||
Options outstanding | 40,704 | $ | 29.67 | 4.00 | $ | 76.1 | ||||||||||
Options vested and expected to vest | 38,975 | $ | 29.36 | 3.87 | $ | 76.1 | ||||||||||
Options exercisable | 28,034 | $ | 26.61 | 3.28 | $ | 76.1 | ||||||||||
As of November 30, 2007 | ||||||||||||||||
Options outstanding | 47,742 | $ | 28.47 | 4.36 | $ | 654.2 | ||||||||||
Options vested and expected to vest | 43,067 | $ | 27.68 | 4.19 | $ | 623.8 | ||||||||||
Options exercisable | 29,387 | $ | 23.77 | 3.38 | $ | 539.8 |
_________________________________________
(*) | The intrinsic value is calculated as the difference between the market value as of end of the fiscal year and the exercise price of the shares. As reported by the NASDAQ Global Select Market, the market values as of November 27, 2009, November 28, 2008 and November 30, 2007 were $35.38, $23.16 and $42.14, respectively. |
All stock options granted to current executive officers are made after a review by and with the approval of the Executive Compensation Committee of the Board of Directors.
Summary of Employee Stock Purchase Plan Shares
The weighted average subscription date fair value of shares under the ESPP during fiscal 2009, 2008 and 2007 were $5.43, $9.56 and $12.03, respectively. Employees purchased 3.2 million shares at an average price of $19.04, 2.4 million shares at an average price of $30.40, and 2.6 million shares at an average price of $25.24, respectively, for fiscal 2009, 2008 and 2007. The intrinsic value of shares purchased during fiscal 2009, 2008 and 2007 was $21.7 million, $25.0 million and $39.8 million, respectively. The intrinsic value is calculated as the difference between the market value on the date of purchase and the purchase price of the shares.
Summary of Restricted Stock
Restricted stock award activity for fiscal 2009, 2008 and 2007 was as follows (shares in thousands):
| 2009 | 2008 | 2007 | ||||||||||||||||||||||
Non-vested Shares | Weighted Average Grant Date Fair Value |
Non-vested Shares | Weighted Average Grant Date Fair Value |
Non-vested Shares | Weighted Average Grant Date Fair Value | |||||||||||||||||||
Beginning outstanding balance | 4 | $ | 39.31 | 21 | $ | 36.41 | 501 | $ | 9.17 | |||||||||||||||
Awarded | - | - | - | - | 5 | 40.03 | ||||||||||||||||||
Released | (1 | ) | 38.22 | (15 | ) | 34.94 | (92 | ) | 29.32 | |||||||||||||||
Forfeited | - | - | (2 | ) | 39.95 | (393 | ) | 4.77 | ||||||||||||||||
Ending outstanding balance | 3 | $ | 40.01 | 4 | $ | 39.31 | 21 | $ | 36.41 | |||||||||||||||
108
TABLE OF CONTENTS
ADOBE SYSTEMS INCORPORATED
NOTES TO CONSOLIDATED FINANCIAL STATEMENTS (Continued)
The total fair value of restricted stock awards vested during fiscal 2009, 2008 and 2007 was $39.4 thousand, $0.5 million and $0.7 million, respectively.
Restricted stock awards are considered outstanding at the time of grant, as the stock award holders are entitled to dividends and voting rights. Unvested restricted stock awards are not considered outstanding in the computation of basic earnings per share.
Restricted stock unit activity for fiscal years 2009, 2008 and 2007 was as follows (in thousands):
2009 |
2008 |
2007 | ||||||||||
Beginning outstanding balance | 4,261 | 1,701 | - | |||||||||
Awarded | 6,176 | 3,177 | 1,771 | |||||||||
Released | (1,162 | ) | (422 | ) | - | |||||||
Forfeited | (401 | ) | (195 | ) | (70 | ) | ||||||
Increase due to acquisition | 1,559 | - | - | |||||||||
Ending outstanding balance | 10,433 | 4,261 | 1,701 | |||||||||
The weighted average grant date fair values of restricted stock units granted during fiscal 2009, 2008 and 2007 were $27.74, $33.55 and $39.67, respectively.The total fair value of restricted stock units vested during fiscal 2009 and 2008 was $27.1 million and $14.4 million, respectively.
Information regarding restricted stock units outstanding at the end of fiscal 2009, 2008 and 2007 is summarized below:
Number of Shares (thousands) | Weighted Average Remaining Contractual Life (years) | Aggregate Intrinsic Value (*) (millions) | ||||||||||
2009 | ||||||||||||
Restricted stock units outstanding | 10,433 | 1.82 | $ | 369.1 | ||||||||
Restricted stock units vested and expected to vest | 8,078 | 1.63 | $ | 285.7 | ||||||||
2008 | ||||||||||||
Restricted stock units outstanding | 4,261 | 1.73 | $ | 98.7 | ||||||||
Restricted stock units vested and expected to vest | 3,351 | 1.52 | $ | 77.6 | ||||||||
2007 | ||||||||||||
Restricted stock units outstanding | 1,701 | 1.88 | $ | 71.7 | ||||||||
Restricted stock units vested and expected to vest | 1,309 | 1.65 | $ | 55.2 | ||||||||
_________________________________________
(*) | The intrinsic value is calculated as the market value as of end of the fiscal year. As reported by the NASDAQ Global Select Market, the market values as of November 27, 2009, November 28, 2008 and November 30, 2007 were $35.38, $23.16 and $42.14, respectively. |
109
TABLE OF CONTENTS
ADOBE SYSTEMS INCORPORATED
NOTES TO CONSOLIDATED FINANCIAL STATEMENTS (Continued)
Summary of Performance Shares
The following table sets forth the summary of performance share activity under our 2009 Program for fiscal 2009 (in thousands):
Shares Granted | Maximum Shares Eligible to Receive | |||||||
Beginning outstanding balance | - | - | ||||||
Awarded | 559 | 643 | ||||||
Forfeited | (7 | ) | (8 | ) | ||||
Ending outstanding balance | 552 | 635 | ||||||
However, the performance metrics under the 2009 program were not achieved and therefore no shares will be awarded under the grants noted above.
In the first quarter of fiscal 2009, the Executive Compensation Committee certified the actual performance achievement of participants in the 2008 Performance Share Program (the "2008 Program"). Based upon the achievement of goals outlined in the 2008 Program, participants had the ability to receive up to 200% of the target number of shares originally granted. Actual performance resulted in participants achieving approximately 124% of target or approximately 1.0 million shares for the 2008 Program. Shares under the 2008 Program vested 25% in the first quarter of fiscal 2009, and the remaining 75% vest evenly on the following three annual anniversary dates of the grant, contingent upon the recipient's continued service to Adobe.
The following table sets forth the summary of performance share activity under our 2006 through 2008 programs, based upon share awards actually achieved, for fiscal 2009 and fiscal 2008 (in thousands):
2009 | 2008 | |||||||
Beginning outstanding balance | 383 | - | ||||||
Achieved | 1,022 | 993 | ||||||
Released | (382 | ) | (480 | ) | ||||
Forfeited | (73 | ) | (130 | ) | ||||
Ending outstanding balance | 950 | 383 | ||||||
The total fair value of performance awards vested during fiscal 2009 and 2008 was $7.7 million and $16.7 million, respectively.
Information regarding performance shares outstanding at November 27, 2009 and November 28, 2008 is summarized below:
Number of Shares (thousands) | Weighted Average Remaining Contractual Life (years) | Aggregate Intrinsic Value (*) (millions) | ||||||||||
2009 | ||||||||||||
Performance shares outstanding | 950 | 1.05 | $ | 33.6 | ||||||||
Performance shares vested and expected to vest | 818 | 0.97 | $ | 28.8 | ||||||||
2008 | ||||||||||||
Performance shares outstanding | 383 | 1.20 | $ | 8.9 | ||||||||
Performance shares vested and expected to vest | 323 | 1.10 | $ | 7.4 | ||||||||
_________________________________________
110
TABLE OF CONTENTS
ADOBE SYSTEMS INCORPORATED
NOTES TO CONSOLIDATED FINANCIAL STATEMENTS (Continued)
(*) | The intrinsic value is calculated as the market value as of end of the fiscal year. As reported by the NASDAQ Global Select Market, the market value as of November 27, 2009 and November 28, 2008 was $35.38 and $23.16, respectively. |
Grants to Non-Employee Directors
The Directors Plan (and starting in fiscal 2008, the 2003 Plan) provides for the granting of nonqualified stock options to non-employee directors. Prior to fiscal 2009, option grants were limited to 25,000 shares per person in each fiscal year, except for a new non-employee director to whom 50,000 shares were granted upon election as a director. Options granted before November 29, 2008 vest over four years: 25% on the day preceding each of our next four annual meetings and have a ten-year term. Starting in fiscal 2009, the initial equity grant to a new non-employee director is a restricted stock unit award having an aggregate value of $0.5 million as based on the average stock price over the 30 calendar days ending on the day before the date of grant. The initial equity award vests over 2 years, 50% on the day preceding each of our next 2 annual meetings. For the annual equity grant, a non-employee director can elect to receive 100% options, 100% restricted stock units or 50% of each and shall have an aggregate value of $0.2 million as based on the average stock price over the 30 calendar days ending on the day before the date of grant. The target grant value of restricted stock units to stock options will be based on a 3:1 conversion ratio. Annual equity awards granted on or after November 29, 2008 vest 100% on the day preceding the next annual meeting. Options granted on or after November 29, 2008 have a seven-year term. The exercise price of the options that are issued is equal to the fair market value of our common stock on the date of grant.
Options granted to directors for fiscal 2009, 2008 and 2007 are as follows (shares in thousands):
2009 | 2008 | 2007 | ||||||||||
Options granted to existing directors | 175 | 250 | 250 | |||||||||
Exercise price | $ | 23.28 | $ | 37.09 | $ | 42.61 |
Restricted stock units granted to directors for fiscal 2009 are as follows (shares in thousands):
2009 | ||||
Restricted stock units granted to existing directors | 27 | |||
Restricted stock units granted to new directors | 20 | |||
Compensation Costs
With the exception of performance shares, stock-based compensation expense is recognized on a straight-line basis over the requisite service period of the entire award, which is generally the vesting period. For performance shares, expense is recognized on a straight-line basis over the requisite service period for each vesting portion of the award.
As of November 27, 2009, there was $305.0 million of unrecognized compensation cost, adjusted for estimated forfeitures, related to non-vested stock-based awards which will be recognized over a weighted average period of 2.4 years. Total unrecognized compensation cost will be adjusted for future changes in estimated forfeitures.
111
TABLE OF CONTENTS
ADOBE SYSTEMS INCORPORATED
NOTES TO CONSOLIDATED FINANCIAL STATEMENTS (Continued)
Total stock-based compensation costs that have been included in our Consolidated Statements of Income for fiscal 2009, 2008 and 2007 were as follows (in thousands):
| Income Statement Classifications | ||||||||||||||||||||
Cost of Revenue – Services and Support | Research and Development | Sales and Marketing | General and Administrative |
Total | ||||||||||||||||
| ||||||||||||||||||||
Option Grants and Stock Purchase Rights (*) | ||||||||||||||||||||
Fiscal 2009 | $ | 1,906 | $ | 45,535 | $ | 38,790 | $ | 24,595 | $ | 110,826 | ||||||||||
Fiscal 2008 | $ | 3,728 | $ | 55,653 | $ | 41,326 | $ | 24,521 | $ | 125,228 | ||||||||||
Fiscal 2007 | $ | 5,152 | $ | 58,579 | $ | 41,801 | $ | 24,467 | $ | 129,999 | ||||||||||
Restricted Stock and Performance Share Awards (*) | ||||||||||||||||||||
Fiscal 2009 | $ | 639 | $ | 27,931 | $ | 19,818 | $ | 9,274 | $ | 57,662 | ||||||||||
Fiscal 2008 | $ | 570 | $ | 20,835 | $ | 17,928 | $ | 10,810 | $ | 50,143 | ||||||||||
Fiscal 2007 | $ | 346 | $ | 9,518 | $ | 6,084 | $ | 4,040 | $ | 19,988 | ||||||||||
_________________________________________
(*) | During fiscal 2009 and 2008, we recorded $0.9 million and $2.9 million, respectively, associated with cash recoveries of fringe benefit tax from employees in India. |
NOTE 14. STOCKHOLDERS' EQUITY
Stockholder Rights Plan
Our Stockholder Rights Plan is intended to protect stockholders from unfair or coercive takeover practices. In accordance with this plan, the Board of Directors declared a dividend distribution of one common stock purchase right on each outstanding share of our common stock held as of July 24, 1990 and on each share of common stock issued by Adobe thereafter. In July 2000, the Stockholder Rights Plan was amended to extend it for ten years so that each right entitles the holder to purchase one unit of Series A Preferred Stock, which is equal to 1/1000 share of Series A Preferred Stock, par value $0.0001 per share, at a price of $700 per unit. As adjusted for our 2000 and 2005 stock splits each in the form of a dividend, each share of common stock now entitles the holder to one-quarter of such a purchase right. Each whole right still entitles the registered holder to purchase from Adobe a unit of preferred stock at $700. The rights become exercisable in certain circumstances, including upon an entity's acquiring or announcing the intention to acquire beneficial ownership of 15% or more of our common stock without the approval of the Board of Directors or upon our being acquired by any person in a merger or business combination transaction. The rights are redeemable by Adobe prior to exercise at $0.01 per right and expire on July 23, 2010.
Stock Repurchase Program I
To facilitate our stock repurchase program, designed to return value to our stockholders and minimize dilution from stock issuances, we repurchase shares in the open market and also enter into structured repurchases with third-parties.
Authorization to repurchase shares to cover on-going dilution is not subject to expiration. However, this repurchase program is limited to covering net dilution from stock issuances and is subject to business conditions and cash flow requirements as determined by our Board of Directors from time to time.
During fiscal 2009, 2008 and 2007 we entered into several structured repurchase agreements with large financial institutions, whereupon we provided the financial institutions with prepayments of $350.0 million, $525.0 million and $1.1 billion, respectively. We entered into these agreements in order to take advantage of repurchasing shares at a guaranteed discount to the Volume Weighted Average Price ("VWAP") of our common stock over a specified period of time. We only enter into such transactions when the discount that we receive is higher than the foregone return on our cash prepayments to the financial institutions. There were no explicit commissions or fees on these structured repurchases. Under the terms of the agreements, there is no requirement for the financial institutions to return any portion of the prepayment to us.
112
TABLE OF CONTENTS
ADOBE SYSTEMS INCORPORATED
NOTES TO CONSOLIDATED FINANCIAL STATEMENTS (Continued)
The financial institutions agree to deliver shares to us at monthly intervals during the contract term. The parameters used to calculate the number of shares deliverable are: the total notional amount of the contract, the number of trading days in the contract, the number of trading days in the interval and the average VWAP of our stock during the interval less the agreed upon discount. During fiscal 2009, we repurchased approximately 15.2 million shares at an average price per share of $27.89 through structured repurchase agreements entered into during fiscal 2008 and fiscal 2009. During fiscal 2008, we repurchased 22.4 million shares at an average price of $36.26 through structured repurchase agreements which included prepayments from fiscal 2007. During fiscal 2007, we repurchased 22.0 million shares at an average price of $40.04 through structured repurchase agreements which included prepayments from fiscal 2006.
During fiscal 2008, we also repurchased 3.6 million shares at an average price of $36.41 in open market transactions.
For fiscal 2009, 2008 and 2007, the prepayments were classified as treasury stock on our Consolidated Balance Sheets at the payment date, though only shares physically delivered to us by November 27, 2009, November 28, 2008 and November 30, 2007 were excluded from the denominator in the computation of earnings per share. As of November 27, 2009 and November 28, 2008, approximately $59.9 million and $134.7 million, respectively, of up-front payments remained under the agreements.
Stock Repurchase Program II
Under this stock repurchase program, we had authorization to repurchase an aggregate of 50.0 million shares of our common stock. During the third quarter of fiscal 2008, the remaining authorized number of shares were repurchased. From the inception of the 50.0 million share authorization under this program, we provided prepayments of $1.9 billion under structured share repurchase agreements to large financial institutions. During the third quarter of fiscal 2008, the remaining authorized number of shares were repurchased.
During fiscal 2008, we provided prepayments of $1.0 billion and repurchased 31.9 million shares under these structured agreements at an average price of $37.15. During fiscal 2007, we provided prepayments of $850.0 million under structured share repurchase agreements to large financial institutions. During fiscal 2007, we repurchased 17.7 million shares under these structured agreements at an average price of $40.50 and approximately $133.7 million of up-front payments remained under these agreements as of November 30, 2007.
During fiscal 2008, we also repurchased 0.5 million shares at an average price of $39.79 in open market transactions.
NOTE 15. COMPREHENSIVE INCOME
The following table sets forth the activity for each component of comprehensive income, net of related taxes, for fiscal 2009, 2008 and 2007 (in thousands):
2009 | 2008 | 2007 | ||||||||||
Net income | $ | 386,508 | $ | 871,814 | $ | 723,807 | ||||||
Other comprehensive income (loss): | ||||||||||||
Available-for-sale securities: | ||||||||||||
Unrealized gains (losses) on available-for-sale securities, net of taxes | 6,661 | (3,102 | ) | 14,570 | ||||||||
Reclassification adjustment for (gains) losses on available-for-sale securities recognized during the period | (8,752 | ) | 1,559 | 2,000 | ||||||||
Subtotal available-for-sale securities | (2,091 | ) | (1,543 | ) | 16,570 | |||||||
Derivative instruments: | ||||||||||||
Unrealized (losses) gains on derivative instruments | (14,618 | ) | 54,967 | 4,974 | ||||||||
Reclassification adjustment for gains on derivative instruments recognized during the period | (27,138 | ) | (13,248 | ) | (5,510 | ) | ||||||
Subtotal derivative instruments | (41,756 | ) | 41,719 | (536 | ) | |||||||
Foreign currency translation adjustments | 11,071 | (10,902 | ) | 5,570 | ||||||||
Other comprehensive income (loss) | (32,776 | ) | 29,274 | 21,604 | ||||||||
Total comprehensive income, net of taxes | $ | 353,732 | $ | 901,088 | $ | 745,411 |
113
TABLE OF CONTENTS
ADOBE SYSTEMS INCORPORATED
NOTES TO CONSOLIDATED FINANCIAL STATEMENTS (Continued)
The following table sets forth the taxes related for each component of other comprehensive income for fiscal 2009, 2008 and 2007 (in thousands):
2009 | 2008 | 2007 | ||||||||
Available-for-sale securities | $ | 931 | $ | (988 | ) | $ | 2,382 | |||
Foreign currency translation adjustments | $ | 1,411 | $ | (4,860 | ) | $ | 3,699 |
Taxes related to derivative instruments were zero for all fiscal years.
The following table sets forth the components of accumulated other comprehensive income, net of related taxes, for fiscal 2009 and 2008 (in thousands):
2009 | 2008 | |||||||
Net unrealized gains on available-for-sale securities: | ||||||||
Unrealized gains on available-for-sale securities | $ | 13,818 | $ | 16,062 | ||||
Unrealized losses on available-for-sale securities | (2 | ) | (155 | ) | ||||
Total net unrealized gains on available-for-sale securities | 13,816 | 15,907 | ||||||
Net unrealized gains on derivative instruments | (5 | ) | 41,750 | |||||
Cumulative foreign currency translation adjustments | 10,635 | (435 | ) | |||||
Total accumulated other comprehensive income, net of taxes | $ | 24,446 | $ | 57,222 |
The following table sets forth the components of foreign currency translation adjustments for fiscal 2009, 2008 and 2007 (in thousands):
2009 | 2008 | 2007 | ||||||||||
| Beginning balance | $ | (4 31 | ) | $ | 10,471 | $ | 4,901 | |||||
Foreign currency translation adjustments | 17,343 | (19,461 | ) | 9,269 | ||||||||
Income tax effect relating to translation adjustments for undistributed foreign earnings | (6,272 | ) | 8,559 | (3,699 | ) | |||||||
Ending balance | $ | 10,640 | $ | (431 | ) | $ | 10,471 |
NOTE 16. NET INCOME PER SHARE
Basic net income per share is computed using the weighted average number of common shares outstanding for the period, excluding unvested restricted stock. Diluted net income per share is based upon the weighted average common shares outstanding for the period plus dilutive potential common shares, including unvested restricted stock and stock options using the treasury stock method.
The following table sets forth the computation of basic and diluted net income per share for fiscal 2009, 2008 and 2007 (in thousands, except per share data):
2009 | 2008 | 2007 | ||||||||||
Net income | $ | 386,508 | $ | 871,814 | $ | 723,807 | ||||||
| Shares used to compute basic net income per share | 524,470 | 539,373 | 584,203 | |||||||||
| Dilutive potential common shares: | ||||||||||||
Unvested restricted stock and performance share awards | 2,130 | 1,107 | 13 | |||||||||
| Stock options | 4,010 | 8,073 | 14,559 | |||||||||
Shares used to compute diluted net income per share | 530,610 | 548,553 | 598,775 | |||||||||
Basic net income per share | $ | 0.74 | $ | 1.62 | $ | 1.24 | ||||||
Diluted net income per share | $ | 0.73 | $ | 1.59 | $ | 1.21 |
114
TABLE OF CONTENTS
ADOBE SYSTEMS INCORPORATED
NOTES TO CONSOLIDATED FINANCIAL STATEMENTS (Continued)
For fiscal 2009, 2008 and 2007, options to purchase approximately 27.0 million, 16.5 million and 10.4 million shares, respectively, of common stock with exercise prices greater than the annual average fair market value of our stock of $27.30, $37.07 and $41.77, respectively, were not included in the calculation because the effect would have been anti-dilutive.
NOTE 17. COMMITMENTS AND CONTINGENCIES
Lease Commitments
We lease certain of our facilities and some of our equipment under non-cancellable operating lease arrangements that expire at various dates through 2028. We also have one land lease that expires in 2091. Rent expense includes base contractual rent and variable costs such as building expenses, utilities, taxes, insurance and equipment rental. Rent expense and sublease income for these leases for fiscal 2007 through fiscal 2009 were as follows (in thousands):
2009 | 2008 | 2007 | ||||||||||
Rent expense | $ | 93,921 | $ | 101,202 | $ | 90,553 | ||||||
Less: sublease income | 5,563 | 11,421 | 9,406 | |||||||||
Net rent expense | $ | 88,358 | $ | 89,781 | $ | 81,147 |
We occupy three office buildings in San Jose, California where our corporate headquarters are located. We reference these office buildings as the Almaden Tower and the East and West Towers.
In August 2004, we extended the lease agreement for our East and West Towers for an additional five years with an option to extend for an additional five years solely at our election. In June 2009, we submitted notice to the lessor that we intended to exercise our option to renew this agreement for an additional five years effective August 2009. As stated in the original lease agreement, in conjunction with the lease renewal, we were required to obtain a standby letter of credit for approximately $16.5 million which enabled us to secure a lower interest rate and reduce the number of covenants. As defined in the lease agreement, the standby letter of credit primarily represents the lease investment balance equity which is callable in the event of default. In March 2007, the Almaden Tower lease was extended for five years, with a renewal option for an additional five years solely at our election. As part of the lease extensions, we purchased the lease receivable from the lessor of the East and West Towers for $126.8 million and a portion of the lease receivable from the lessor of the Almaden Tower for $80.4 million, both of which are recorded as investments in lease receivables on our Consolidated Balance Sheets. This purchase may be credited against the residual value guarantee if we purchase the properties or will be repaid from the sale proceeds if the properties are sold to third parties. Under the agreement for the East and West Towers and the agreement for the Almaden Tower, we have the option to purchase the buildings at anytime during the lease term for approximately $143.2 million and $103.6 million, respectively. The residual value guarantees under the East and West Towers and the Almaden Tower obligations are $126.8 million and $89.4 million, respectively.
These two leases are both subject to standard covenants including certain financial ratios that are reported to the lessors quarterly. As of November 27, 2009, we were in compliance with all covenants. In the case of a default, the lessor may demand we purchase the buildings for an amount equal to the lease balance, or require that we remarket or relinquish the buildings. Both leases qualify for operating lease accounting treatment and, as such, the buildings and the related obligations are not included on our consolidated balance sheet. We utilized this type of financing in order to access bank-provided funding at the most favorable rates and to provide the lowest total cost of occupancy for the headquarter buildings. At the end of the lease term, we can extend the lease for an additional five year term, purchase the buildings for the lease balance, remarket or relinquish the buildings. If we choose to remarket or are required to do so upon relinquishing the buildings, we are bound to arrange the sale of the buildings to an unrelated party and will be required to pay the lessor any shortfall between the net remarketing proceeds and the lease balance, up to the residual value guarantee amount.
115
TABLE OF CONTENTS
ADOBE SYSTEMS INCORPORATED
NOTES TO CONSOLIDATED FINANCIAL STATEMENTS (Continued)
The following are our future minimum lease payments under non-cancellable operating leases and future minimum sublease income under non-cancellable subleases for each of the next five years and thereafter as of November 27, 2009 (in thousands):
Fiscal Year |
| Future Minimum Lease Payments | Future Minimum Sublease Income | ||||||
2010 | $ | 53,244 | $ | 3,970 | |||||
2011 | 41,328 | 3,323 | |||||||
2012 | 33,391 | 2,008 | |||||||
2013 | 24,780 | 404 | |||||||
2014 | 19,964 | - | |||||||
Thereafter | 76,548 | - | |||||||
Total | $ | 249,255 | $ | 9,705 | |||||
The table above includes commitments related to our restructured facilities. See Note 11 for information regarding our restructuring charges.
Guarantees
The lease agreements for our corporate headquarters provide for residual value guarantees as noted above. The fair value of a residual value guarantee in lease agreements entered into after December 31, 2002, must be recognized as a liability on our Consolidated Balance Sheets. As such, we recognized $5.2 million and $3.0 million in liabilities, related to the extended East and West Towers and Almaden Tower leases, respectively. These liabilities are recorded in other long-term liabilities with the offsetting entry recorded as prepaid rent in other assets. The balance will be amortized to the income statement over the life of the leases. As of November 27, 2009 and November 28, 2008, the unamortized portion of the fair value of the residual value guarantees, for both leases, remaining in other long-term liabilities and prepaid rent was $1.3 million and $2.6 million, respectively.
Royalties
We have royalty commitments associated with the shipment and licensing of certain products. Royalty expense is generally based on a dollar amount per unit shipped or a percentage of the underlying revenue. Royalty expense, which was recorded under our cost of products revenue on our Consolidated Statements of Income, was approximately $43.0 million, $47.8 million and $37.4 million in fiscal 2009, 2008 and 2007, respectively.
Indemnifications
In the normal course of business, we provide indemnifications of varying scope to customers against claims of intellectual property infringement made by third-parties arising from the use of our products. Historically, costs related to these indemnification provisions have not been significant and we are unable to estimate the maximum potential impact of these indemnification provisions on our future results of operations.
To the extent permitted under Delaware law, we have agreements whereby we indemnify our officers and directors for certain events or occurrences while the officer or director is, or was serving, at our request in such capacity. The indemnification period covers all pertinent events and occurrences during the officer's or director's lifetime. The maximum potential amount of future payments we could be required to make under these indemnification agreements is unlimited; however, we have director and officer insurance coverage that reduces our exposure and enables us to recover a portion of any future amounts paid. We believe the estimated fair value of these indemnification agreements in excess of applicable insurance coverage is minimal.
As part of our limited partnership interests in Adobe Ventures, we have provided a general indemnification to Granite Ventures, an independent venture capital firm and sole general partner of Adobe Ventures, for certain events or occurrences while Granite Ventures is, or was serving, at our request in such capacity provided that Granite Ventures acts in good faith on behalf of the partnership. We are unable to develop an estimate of the maximum potential amount of future payments that could potentially result from any hypothetical future claim, but believe the risk of having to make any payments under this general indemnification to be remote.
116
TABLE OF CONTENTS
ADOBE SYSTEMS INCORPORATED
NOTES TO CONSOLIDATED FINANCIAL STATEMENTS (Continued)
Legal Proceedings
On September 23, 2009, Richard Miner on behalf of himself and all similarly situated stockholders of Omniture, Inc. filed a class action lawsuit captioned Miner v. Omniture, Inc., et. al. , Case No. 090403559 (the "Miner Lawsuit") against Omniture, the members of Omniture's board of directors (collectively, the "Omniture Defendants") and Adobe in the United States Fourth Judicial District Court for Utah County, Provo Department, State of Utah seeking to enjoin the proposed acquisition between Omniture and Adobe. In the event the acquisition is consummated, the plaintiff seeks to recover an unspecified amount of damages. The plaintiff alleges that the members of Omniture's board of directors breached their fiduciary duties to Omniture's stockholders by failing to seek the highest possible price for Omniture and that Adobe induced or aided and abetted in the alleged breach of such fiduciary duties. Also on September 23, 2009, Christopher R. Barrell filed a substantially similar lawsuit to the Miner Lawsuit in the United States Fourth Judicial District Court for Utah County, Provo Department, State of Utah, captioned Barrell v. Omniture, Inc. et. al., Case No. 090403560 (the "Barrell Lawsuit"). The Barrell Lawsuit names the same defendants as the Miner Lawsuit, and also names Snowbird Acquisition Corporation as an additional defendant. Subsequently, on September 24, 2009, the plaintiff in the Barrell Lawsuit filed an amended complaint, which added allegations that the Schedule 14D-9 Solicitation/Recommendation Statement filed by Omniture on September 24, 2009 contained inadequate disclosures and was materially misleading. On September 25, 2009, the Omniture Defendants filed a motion requesting that the court consolidate the Barrell Lawsuit, Miner Lawsuit and a substantially similar lawsuit captioned Lodhia v. Omniture, Inc. et al., Case No. 090403499 (the "Lodhia Lawsuit") in which the Omniture Defendants, but not Adobe, were named. Additionally, on September 30, 2009, the plaintiff in the Lodhia Lawsuit filed a response to defendants' motion to consolidate, agreeing consolidation is appropriate, and also filed a motion seeking appointment as lead plaintiff in the consolidated action. Omniture moved for an order consolidating all three lawsuits. The plaintiffs in the three lawsuits filed a joint motion seeking preliminary injunction barring the consummation of the proposed acquisition and requiring additional disclosures by Omniture in its Schedule 14D-9. At a hearing on October 20, 2009, the court granted Omniture's motion to consolidate the three cases and denied the plaintiffs' motion for a preliminary injunction. On December 30, 2009, the plaintiffs served the defendants with a consolidated amended complaint. Adobe intends to defend the lawsuits vigorously. As of November 27, 2009, no amounts have been accrued as a loss is not probable.
In connection with our anti-piracy efforts, conducted both internally and through organizations such as the Business Software Alliance, from time to time we undertake litigation against alleged copyright infringers. Such lawsuits may lead to counter-claims alleging improper use of litigation or violation of other local laws. We believe we have valid defenses with respect to such counter-claims; however, it is possible that our consolidated financial position, cash flows or results of operations could be affected in any particular period by the resolution of one or more of these counter-claims.
From time to time, Adobe is subject to legal proceedings, claims and investigations in the ordinary course of business, including claims of alleged infringement of third-party patents and other intellectual property rights, commercial, employment and other matters. Adobe makes a provision for a liability when it is both probable that a liability has been incurred and the amount of the loss can be reasonably estimated. These provisions are reviewed at least quarterly and adjusted to reflect the impacts of negotiations, settlements, rulings, advice of legal counsel and other information and events pertaining to a particular case. Litigation is inherently unpredictable. However, we believe that we have valid defenses with respect to the legal matters pending against Adobe. It is possible, nevertheless, that our consolidated financial position, cash flows or results of operations could be negatively affected by an unfavorable resolution of one or more of such proceedings, claims or investigations.
NOTE 18. CREDIT AGREEMENT
In August 2007, we entered into the Amendment to our Credit Agreement dated February 2007 (the "Amendment"), which increased the total senior unsecured revolving facility from $500.0 million to $1.0 billion. The Amendment also permits us to request one-year extensions effective on each anniversary of the closing date of the original agreement, subject to the majority consent of the lenders. We also retain an option to request an additional $500.0 million in commitments, for a maximum aggregate facility of $1.5 billion.
In February 2008, we entered into the Second Amendment to the Credit Agreement dated February 26, 2008, which extended the maturity date of the facility by one year to February 16, 2013. The facility would terminate at this date if no additional extensions have been requested and granted. All other terms and conditions remain the same.
117
TABLE OF CONTENTS
ADOBE SYSTEMS INCORPORATED
NOTES TO CONSOLIDATED FINANCIAL STATEMENTS (Continued)
The facility contains a financial covenant requiring us not to exceed a certain maximum leverage ratio. At our option, borrowings under the facility accrue interest based on either the London interbank offered rate ("LIBOR") for one, two, three or six months, or longer periods with bank consent, plus a margin according to a pricing grid tied to this financial covenant, or a base rate. The margin is set at rates between 0.20% and 0.475%. Commitment fees are payable on the facility at rates between 0.05% and 0.15% per year based on the same pricing grid. The facility is available to provide loans to us and certain of our subsidiaries for general corporate purposes. As of November 28, 2008, the amount outstanding under this credit facility was $350.0 million. On September 22, 2009 we borrowed an additional $650.0 million under the credit facility. As of November 27, 2009, the amount outstanding under this credit facility was $1.0 billion which is included in long-term liabilities on our Consolidated Balance Sheets. The carrying value of the outstanding liability approximates fair value. As of November 27, 2009, we were in compliance with all of the covenants.
NOTE 19. NON-OPERATING INCOME (EXPENSE)
Non-operating income (expense) for fiscal 2009, 2008 and 2007 included the following (in thousands):
2009 | 2008 | 2007 | ||||||||||
Interest and other income, net: | ||||||||||||
Interest income | $ | 34,978 | $ | 57,588 | $ | 92,794 | ||||||
Foreign exchange losses | (13,420 | ) | (17,494 | ) | (9,264 | ) | ||||||
Realized gains on fixed income investment | 8,753 | 3,161 | 934 | |||||||||
Realized losses on fixed income investment | (1 | ) | (1,501 | ) | (3,510 | ) | ||||||
Other | 1,070 | 2,093 | 1,770 | |||||||||
Interest and other income, net | $ | 31,380 | $ | 43,847 | $ | 82,724 | ||||||
Interest expense | $ | (3,407 | ) | $ | (10,019 | ) | $ | (253 | ) | |||
Investment gains (losses), net: | ||||||||||||
Realized investment gains | $ | 52 | $ | 18,398 | $ | 9,308 | ||||||
Unrealized investment gains (*) | 7,950 | 7,803 | 5,265 | |||||||||
Realized investment losses | (9,019 | ) | (1,417 | ) | (2,236 | ) | ||||||
Unrealized investment losses | (15,949 | ) | (8,375 | ) | (5,203 | ) | ||||||
Investment gains (losses), net | $ | (16,966 | ) | $ | 16,409 | $ | 7,134 | |||||
Non-operating income (expense), net | $ | 11,007 | $ | 50,237 | $ | 89,605 |
_________________________________________
(*) | During fiscal 2009, we recorded $3.0 million in unrealized holding gains and losses associated with our deferred compensation plan assets (classified as trading securities). |
NOTE 20. INDUSTRY SEGMENT, GEOGRAPHIC INFORMATION AND SIGNIFICANT CUSTOMERS
For substantially all of fiscal 2009, we had the following reportable segments: Creative Solutions, Knowledge Worker, Enterprise, Platform and Print and Publishing. Coinciding with the integration of Omniture in the fourth quarter of fiscal 2009, we created a new reportable segment for financial reporting purposes. Our Creative Solutions segment focuses on delivering a complete professional line of integrated tools for a full range of creative and developer tasks to an extended set of customers. The Knowledge Worker segment focuses on the needs of knowledge worker customers, providing essential applications and services to help them share information and collaborate. This segment contains revenue generated by Acrobat Connect and our Acrobat family of products. Our Enterprise segment provides server-based enterprise interaction solutions that automate people-centric processes and contains revenue generated by our LiveCycle line of products. The Platform segment includes client and developer technologies, such as Adobe Flash Player, Adobe Flash Lite, Adobe AIR, Adobe Flex and Adobe Flash Builder, and also encompasses products and technologies created and managed in other Adobe segments. The Print and Publishing segment addresses market opportunities ranging from the diverse publishing needs of technical and business publishing, to our legacy type and OEM printing businesses. Finally, our Omniture segment provides web analytics and online business optimization products and services to manage and enhance online, offline and multi-channel business initiatives.
118
TABLE OF CONTENTS
ADOBE SYSTEMS INCORPORATED
NOTES TO CONSOLIDATED FINANCIAL STATEMENTS (Continued)
Effective in the first quarter of fiscal 2009, our former Mobile and Devices Solutions segment, was integrated into our Platform business unit to better align our engineering and marketing efforts and is now reported as part of the Platform segment. Prior year information in the table below has been reclassified to reflect the integration of these business units.
To better align our marketing efforts and go-to-market strategies, in fiscal 2010 we plan to move responsibility for the Connect Solutions product line from our Knowledge Worker segment to our Enterprise segment. We will adjust our reportable segments at the beginning of fiscal 2010 to reflect changes for how we manage our business as we enter the new fiscal year.
We report segment information based on the "management" approach. The management approach designates the internal reporting used by management for making decisions and assessing performance as the source of our reportable segments.
Our chief operating decision maker reviews revenue and gross margin information for each of our reportable segments. Operating expenses are not reviewed on a segment by segment basis. In addition, with the exception of goodwill and intangible assets, we do not identify or allocate our assets by the reportable segments.
Our segment results for fiscal 2009, 2008 and 2007 were as follows (dollars in thousands):
Creative Solutions | Knowledge Worker | Enterprise | Platform (1) | Print and Publishing | Omniture (2) | Total | ||||||||||||||||||||||
Fiscal 2009 | ||||||||||||||||||||||||||||
Revenue | $ | 1,702,110 | $ | 622,970 | $ | 235,498 | $ | 181,033 | $ | 177,970 | $ | 26,272 | $ | 2,945,853 | ||||||||||||||
Cost of revenue | 152,909 | 40,155 | 47,991 | 21,174 | 18,674 | 15,829 | 296,732 | |||||||||||||||||||||
Gross profit | $ | 1,549,201 | $ | 582,815 | $ | 187,507 | $ | 159,859 | $ | 159,296 | $ | 10,443 | $ | 2,649,121 | ||||||||||||||
Gross profit as a percentage of revenue | 91 | % | 94 | % | 80 | % | 88 | % | 90 | % | 40 | % | 90 | % | ||||||||||||||
Fiscal 2008 | ||||||||||||||||||||||||||||
Revenue | $ | 2,072,835 | $ | 810,883 | $ | 252,976 | $ | 231,558 | $ | 211,637 | $ | - | $ | 3,579,889 | ||||||||||||||
Cost of revenue | 160,560 | 53,282 | 75,539 | 44,344 | 28,905 | - | 362,630 | |||||||||||||||||||||
Gross profit | $ | 1,912,275 | $ | 757,601 | $ | 177,437 | $ | 187,214 | $ | 182,732 | $ | - | $ | 3,217,259 | ||||||||||||||
Gross profit as a percentage of revenue | 92 | % | 93 | % | 70 | % | 81 | % | 86 | % | - | 90 | % | |||||||||||||||
Fiscal 2007 | ||||||||||||||||||||||||||||
Revenue | $ | 1,898,924 | $ | 728,528 | $ | 191,317 | $ | 133,380 | $ | 205,732 | $ | - | $ | 3,157,881 | ||||||||||||||
Cost of revenue | 147,161 | 57,683 | 68,932 | 44,087 | 36,831 | - | 354,694 | |||||||||||||||||||||
Gross profit | $ | 1,751,763 | $ | 670,845 | $ | 122,385 | $ | 89,293 | $ | 168,901 | $ | - | $ | 2,803,187 | ||||||||||||||
Gross profit as a percentage of revenue | 92 | % | 92 | % | 64 | % | 67 | % | 82 | % | - | 89 | % |
_________________________________________
(1) | Platform revenue includes revenue related to our Mobile client products of $51.3 million, $113.1 million and $52.5 million for fiscal 2009, 2008 and 2007, respectively, or 28%, 49% and 39% of Platform revenues, respectively. |
(2) | Fiscal 2009 includes the integration of Omniture as a new reportable segment in the fourth quarter. Fiscal 2008 and 2007 do not include the impact of our acquisition of Omniture. |
119
TABLE OF CONTENTS
ADOBE SYSTEMS INCORPORATED
NOTES TO CONSOLIDATED FINANCIAL STATEMENTS (Continued)
The tables below list our revenue and property and equipment, net, by geographic area for fiscal 2009, 2008 and 2007 (in thousands). With the exception of property and equipment, we do not identify or allocate our assets by geographic area.
Revenue |
| 2009 | 2008 | 2007 | |||||||||
Americas: | |||||||||||||
United States | $ | 1,244,631 | $ | 1,473,319 | $ | 1,379,028 | |||||||
Other | 137,940 | 159,507 | 129,776 | ||||||||||
Total Americas | 1,382,571 | 1,632,826 | 1,508,804 | ||||||||||
EMEA | 928,857 | 1,229,161 | 1,026,455 | ||||||||||
Asia: | |||||||||||||
Japan | 410,055 | 450,799 | 407,344 | ||||||||||
Other | 224,370 | 267,103 | 215,278 | ||||||||||
Total Asia | 634,425 | 717,902 | 622,622 | ||||||||||
Revenue | $ | 2,945,853 | $ | 3,579,889 | $ | 3,157,881 | |||||||
Property and Equipment |
| 2009 | 2008 | ||||||
Americas: | |||||||||
United States | $ | 336,303 | $ | 252,434 | |||||
Other | 5,806 | 9,154 | |||||||
Total Americas | 342,109 | 261,588 | |||||||
EMEA | 23,729 | 29,887 | |||||||
Asia: | |||||||||
India | 14,625 | 15,242 | |||||||
Other | 7,669 | 6,320 | |||||||
Total Asia | 22,294 | 21,562 | |||||||
Property and equipment, net | $ | 388,132 | $ | 313,037 | |||||
Significant Customers
As listed, our significant customers are distributors who sell products across our various segments. Our significant customers, as a percentage of net revenue for fiscal 2009, 2008 and 2007 were as follows:
2009 | 2008 | 2007 | ||||||||||
Ingram Micro | 15 | % | 18 | % | 21 | % | ||||||
Tech Data | 8 | % | 9 | % | 10 | % | ||||||
Receivables from our significant customers, as a percentage of gross trade receivables for fiscal 2009 and 2008 were as follows:
2009 | 2008 | |||||||
Ingram Micro | 16 | % | 18 | % | ||||
Tech Data | 6 | % | 8 | % | ||||
120
TABLE OF CONTENTS
ADOBE SYSTEMS INCORPORATED
NOTES TO CONSOLIDATED FINANCIAL STATEMENTS (Continued)
NOTE 21. SELECTED QUARTERLY FINANCIAL DATA (unaudited)
| 2009 | ||||||||||||||||
(in thousands, except per share data) | Quarter Ended | |||||||||||||||
February 27 | May 29 | August 28 | November 27 | |||||||||||||
Revenue | $ | 786,390 | $ | 704,673 | $ | 697,507 | $ | 757,283 | ||||||||
Gross profit | $ | 709,037 | $ | 632,665 | $ | 632,460 | $ | 674,959 | ||||||||
Income before income taxes | $ | 203,162 | $ | 163,730 | $ | 174,416 | $ | 160,212 | ||||||||
Net income (loss) | $ | 156,435 | $ | 126,071 | $ | 136,045 | $ | (32,043 | ) | |||||||
Basic net income (loss) per share | $ | 0.30 | $ | 0.24 | $ | 0.26 | $ | (0.06 | ) | |||||||
Diluted net income (loss) per share | $ | 0.30 | $ | 0.24 | $ | 0.26 | $ | (0.06 | ) | |||||||
| 2008 | ||||||||||||||||
(in thousands, except per share data) | Quarter Ended | |||||||||||||||
February 29 | May 30 | August 29 | November 28 | |||||||||||||
Revenue | $ | 890,445 | $ | 886,886 | $ | 887,257 | $ | 915,301 | ||||||||
Gross profit | $ | 807,970 | $ | 804,020 | $ | 776,406 | $ | 828,863 | ||||||||
Income before income taxes | $ | 295,644 | $ | 278,006 | $ | 228,514 | $ | 276,344 | ||||||||
Net income | $ | 219,379 | $ | 214,910 | $ | 191,608 | $ | 245,917 | ||||||||
Basic net income per share | $ | 0.39 | $ | 0.40 | $ | 0.36 | $ | 0.47 | ||||||||
Diluted net income per share | $ | 0.38 | $ | 0.40 | $ | 0.35 | $ | 0.46 | ||||||||
Our fiscal year is a 52- or 53-week year. Each of the fiscal quarters presented were comprised of 13 weeks.
121
TABLE OF CONTENTS
REPORT OF INDEPENDENT REGISTERED PUBLIC ACCOUNTING FIRM
The Board of Directors and Stockholders
Adobe Systems Incorporated:
We have audited the accompanying consolidated balance sheets of Adobe Systems Incorporated and subsidiaries as of November 27, 2009 and November 28, 2008, and the related consolidated statements of income, stockholders' equity and comprehensive income, and cash flows for each of the years in the three-year period ended November 27, 2009. We have also audited Adobe Systems Incorporated's internal control over financial reporting as of November 27, 2009, based on criteria established in Internal Control – Integrated Framework , issued by the Committee of Sponsoring Organizations of the Treadway Commission (COSO) . Adobe System Incorporated's management is responsible for these consolidated financial statements, for maintaining effective internal control over financial reporting, and for its assessment of the effectiveness of internal control over financial reporting, included in the accompanying Management's Annual Report on Internal Control over Financial Reporting appearing under Item 9A. Our responsibility is to express an opinion on these consolidated financial statements and an opinion on Adobe Systems Incorporated's internal control over financial reporting based on our audits.
We conducted our audits in accordance with the standards of the Public Company Accounting Oversight Board (United States). Those standards require that we plan and perform the audits to obtain reasonable assurance about whether the financial statements are free of material misstatement and whether effective internal control over financial reporting was maintained in all material respects. Our audits of the consolidated financial statements included examining, on a test basis, evidence supporting the amounts and disclosures in the financial statements, assessing the accounting principles used and significant estimates made by management, and evaluating the overall financial statement presentation. Our audit of internal control over financial reporting included obtaining an understanding of internal control over financial reporting, assessing the risk that a material weakness exists, and testing and evaluating the design and operating effectiveness of internal control based on the assessed risk. Our audits also included performing such other procedures as we considered necessary in the circumstances. We believe that our audits provide a reasonable basis for our opinions.
A company's internal control over financial reporting is a process designed to provide reasonable assurance regarding the reliability of financial reporting and the preparation of financial statements for external purposes in accordance with generally accepted accounting principles. A company's internal control over financial reporting includes those policies and procedures that (1) pertain to the maintenance of records that, in reasonable detail, accurately and fairly reflect the transactions and dispositions of the assets of the company; (2) provide reasonable assurance that transactions are recorded as necessary to permit preparation of financial statements in accordance with generally accepted accounting principles, and that receipts and expenditures of the company are being made only in accordance with authorizations of management and directors of the company; and (3) provide reasonable assurance regarding prevention or timely detection of unauthorized acquisition, use, or disposition of the company's assets that could have a material effect on the financial statements.
Because of its inherent limitations, internal control over financial reporting may not prevent or detect misstatements. Also, projections of any evaluation of effectiveness to future periods are subject to the risk that controls may become inadequate because of changes in conditions, or that the degree of compliance with the policies or procedures may deteriorate.
Adobe Systems Incorporated acquired Omniture, Inc. during fiscal 2009, and management excluded from its assessment of the effectiveness of Adobe Systems Incorporated's internal control over financial reporting as of November 27, 2009, Omniture, Inc.'s internal control over financial reporting associated with total assets of $195.5 million and total revenues of $26.3 million included in the consolidated financial statements of Adobe Systems Incorporated and subsidiaries as of and for the year ended November 27, 2009. Our audit of internal control over financial reporting of Adobe Systems Incorporated also excluded an evaluation of the internal control over financial reporting of Omniture, Inc.
In our opinion, the consolidated financial statements referred to above present fairly, in all material respects, the financial position of Adobe Systems Incorporated and subsidiaries as of November 27, 2009 and November 28, 2008, and the results of their operations and their cash flows for each of the years in the three-year period ended November 27, 2009, in conformity with U.S. generally accepted accounting principles. Also in our opinion, Adobe Systems Incorporated maintained, in all material respects, effective internal control over financial reporting as of November 27, 2009, based on criteria established in Internal Control – Integrated Framework , issued by COSO .
122
TABLE OF CONTENTS
As discussed in Note 10 to the consolidated financial statements, Adobe Systems Incorporated changed its method of accounting for uncertainty in income taxes in fiscal 2008 resulting from the adoption of new accounting pronouncements.
/s/KPMG LLP
Mountain View, California
January 22, 2010
123
TABLE OF CONTENTS
ITEM 9. CHANGES IN AND DISAGREEMENTS WITH ACCOUNTANTS ON ACCOUNTING AND FINANCIAL DISCLOSURE
None.
ITEM 9A. CONTROLS AND PROCEDURES
Disclosure Controls and Procedures
Our management has evaluated, under the supervision and with the participation of our Chief Executive Officer and Chief Financial Officer, the effectiveness of our disclosure controls and procedures as of November 27, 2009. Based on their evaluation as of November 27, 2009, our Chief Executive Officer and Chief Financial Officer have concluded that our disclosure controls and procedures (as defined in Rules 13a-15(e) and 15d-15(e) under the Securities Exchange Act of 1934, as amended) were effective at the reasonable assurance level to ensure that the information required to be disclosed by us in this Annual Report on Form 10-K was (i) recorded, processed, summarized and reported within the time periods specified in the SEC's rules and regulations and (ii) accumulated and communicated to our management, including our Chief Executive Officer and Chief Financial Officer, to allow timely decisions regarding required disclosure.
Our management, including our Chief Executive Officer and Chief Financial Officer, does not expect that our disclosure controls and procedures or our internal controls over financial reporting will prevent all error and all fraud. A control system, no matter how well conceived and operated, can provide only reasonable, not absolute, assurance that the objectives of the control system are met. Further, the design of a control system must reflect the fact that there are resource constraints and the benefits of controls must be considered relative to their costs. Because of the inherent limitations in all control systems, no evaluation of controls can provide absolute assurance that all control issues and instances of fraud, if any, within Adobe have been detected.
Management's Annual Report on Internal Control over Financial Reporting
Our management is responsible for establishing and maintaining adequate internal control over financial reporting (as defined in Rule 13a-15(f) under the Securities Exchange Act of 1934, as amended). Our management assessed the effectiveness of our internal control over financial reporting as of November 27, 2009. In making this assessment, our management used the criteria set forth by the Committee of Sponsoring Organizations of the Treadway Commission ("COSO") in Internal Control-Integrated Framework . Our management has concluded that, as of November 27, 2009, our internal control over financial reporting is effective based on these criteria.
Our management's evaluation excluded Omniture, from which we acquired certain assets on October 23, 2009. At November 27, 2009, Omniture had $ 195.5 million and $40.4 million of total assets and net assets, respectively. For the year ended November 27, 2009, our Consolidated Statement of Income included total revenue associated with Omniture of $26.3 million. In accordance with guidance issued by the SEC, companies are allowed to exclude acquisitions from their assessment of internal controls over financial reporting during the first year subsequent to the acquisition while integrating the acquired operations.
KPMG LLP, the independent registered public accounting firm that audited our financial statements included in this Annual Report on Form 10-K, has issued an attestation report on our internal control over financial reporting, which is included herein.
Changes in Internal Control over Financial Reporting
There were no changes in our internal control over financial reporting during the quarter ended November 27, 2009 that have materially affected, or are reasonably likely to materially affect our internal control over financial reporting.
ITEM 9B. OTHER INFORMATION
None.
PART III
ITEM 10. DIRECTORS, EXECUTIVE OFFICERS AND CORPORATE GOVERNANCE
The information required by Item 10 of Form 10-K with respect to Item 401 of Regulation S-K regarding our directors is incorporated herein by reference from the information contained in the section entitled "Proposal 1 – Election of Directors" in our definitive Proxy Statement we will deliver to our stockholders in connection with our Annual Meeting of Stockholders to be held on April 16, 2010. For information with respect to our executive officers, see "Executive Officers" at the end of Part I, Item 1 of this report.
124
TABLE OF CONTENTS
The information required by Item 10 of Form 10-K with respect to Item 405 of Regulation S-K regarding section 16(a) beneficial ownership compliance is incorporated by reference from the information contained in the section entitled "Section 16(a) Beneficial Ownership Reporting Compliance" in our definitive Proxy Statement we will deliver to our stockholders in connection with our Annual Meeting of Stockholders to be held on April 16, 2010.
The information required by Item 10 of Form 10-K with respect to Item 406 of Regulation S-K regarding code of ethics is incorporated by reference from the information contained in the section entitled "Code of Ethics" in our definitive Proxy Statement we will deliver to our stockholders in connection with our Annual Meeting of Stockholders to be held on April 16, 2010.
The information required by Item 10 of Form 10-K with respect to Item 407(c)(3), 407(d)(4) and 407(d)(5) is incorporated by reference from the information contained in the sections entitled "Proposal 1- Election of Directors" and report of the "Audit Committee" in our definitive Proxy Statement we will deliver to our stockholders in connection with our Annual Meeting of Stockholders to be held on April 16, 2010.
ITEM 11. EXECUTIVE COMPENSATION
You will find this information in the sections captioned "Compensation Discussion and Analysis," "Executive Compensation Committee Report," "Executive Compensation," "Director Compensation" and "Compensation Committee Interlocks and Insider Participation" in the Proxy Statement we will deliver to our stockholders in connection with our Annual Meeting of Stockholders to be held on April 16, 2010. We are incorporating the information contained in that section of our Proxy Statement here by reference.
ITEM 12. SECURITY OWNERSHIP OF CERTAIN BENEFICIAL OWNERS AND MANAGEMENT AND RELATED STOCKHOLDER MATTERS
You will find this information in the sections captioned "Security Ownership of Certain Beneficial Owners and Management" and "Equity Compensation Plan Information" in the Proxy Statement we will deliver to our stockholders in connection with our Annual Meeting of Stockholders to be held on April 16, 2010. We are incorporating the information contained in that section here by reference.
ITEM 13. CERTAIN RELATIONSHIPS AND RELATED TRANSACTIONS, AND DIRECTOR INDEPENDENCE
You will find this information in the sections captioned "Transactions with Related Persons" and "Proposal 1-Election of Directors-Independence of Directors" in the Proxy Statement we will deliver to our stockholders in connection with our Annual Meeting of Stockholders to be held on April 16, 2010. We are incorporating the information contained in that section here by reference.
ITEM 14. PRINCIPAL ACCOUNTING FEES AND SERVICES
You will find this information in the sections captioned "Principal Accounting Fees and Services" and "Audit Committee Pre-Approval of Services Performed by Our Independent Registered Public Accountants" in the Proxy Statement we will deliver to our stockholders in connection with our Annual Meeting of Stockholders to be held on April 16, 2010. We are incorporating the information contained in that section here by reference.
PART IV
ITEM 15. EXHIBITS, FINANCIAL STATEMENT SCHEDULES
1. | Financial Statements. See "Index to Consolidated Financial Statements" in Part II, Item 8 of this Form 10-K. |
2. | Exhibits. The exhibits listed in the accompanying "Index to Exhibits" are filed or incorporated by reference as part of this Form 10-K. |
125
TABLE OF CONTENTS
SIGNATURES
Pursuant to the requirements of Section 13 or 15(d) of the Securities Exchange Act of 1934, the registrant has duly caused this report to be signed on its behalf by the undersigned, thereunto duly authorized, on January 22, 2010.
ADOBE SYSTEMS INCORPORATED | ||||
By: | /s/ Mark Garrett | |||
Mark Garrett, Executive Vice President and Chief Financial Officer (Principal Financial Officer) | ||||
POWER OF ATTORNEY
KNOW ALL PERSONS BY THESE PRESENTS, that each person whose signature appears below constitutes and appoints Shantanu Narayen and Mark Garrett, and each or any one of them, his or her lawful attorneys-in-fact and agents, for such person in any and all capacities, to sign any and all amendments to this report and to file the same, with all exhibits thereto and other documents in connection therewith, with the Securities and Exchange Commission, hereby ratifying and confirming all that either of said attorneys-in-fact and agent, or substitute or substitutes, may do or cause to be done by virtue hereof.
Pursuant to the requirements of the Securities Exchange Act of 1934, this report has been signed below by the following persons on behalf of the registrant and in the capacities and on the dates indicated.
Signature | Title | Date | ||
/s/ John E. Warnock | January 22, 2010 | |||
John E. Warnock | Chairman of the Board of Directors | |||
/s/ Charles M. Geschke | January 22, 2010 | |||
Charles M. Geschke | Chairman of the Board of Directors | |||
/s/ Shantanu narayen | January 22, 2010 | |||
Shantanu Narayen | Director, President and Chief Executive Officer (Principal Executive Officer) | |||
/s/ Mark Garrett | January 22, 2010 | |||
Mark Garrett
| Executive Vice President and Chief Financial Officer (Principal Financial Officer) | |||
/s/ Richard T. Rowley | January 22, 2010 | |||
Richard T. Rowley | Vice President and Principal Accounting Officer | |||
/s/ Edward W. Barnholt | January 22, 2010 | |||
Edward W. Barnholt | Director | |||
/s/ Robert K. Burgess | January 22, 2010 | |||
Robert K. Burgess | Director |
126
TABLE OF CONTENTS
Signature | Title | Date | ||
/s/ Michael R. Cannon | January 22, 2010 | |||
Michael R. Cannon | Director | |||
s/ James E. Daley | January 22, 2010 | |||
James E. Daley | Director | |||
/s / Carol Mills | January 22, 2010 | |||
Carol Mills | Director | |||
/s/ Daniel L. Rosensweig | January 22, 2010 | |||
Daniel L. Rosensweig | Director | |||
/s/ Robert Sedgewick | January 22, 2010 | |||
Robert Sedgewick | Director |
127
TABLE OF CONTENTS
SUMMARY OF TRADEMARKS
The following trademarks of Adobe Systems Incorporated or its subsidiaries, which may be registered in the United States and/or other countries, are referenced in this Form 10-K:
Adobe
Acrobat
Acrobat Connect
ActionScript
Adobe AIR
Adobe Audition
Adobe Premiere
Adobe Type Manager
After Effects
AIR
Authorware
BusinessCatalyst
Buzzword
Captivate
ColdFusion
ColdFusion Builder
Contribute
Creative Suite
Director
Dreamweaver
Encore
Fireworks
Flash
Flash Access
Flash Builder
Flash Cast
Flash Catalyst
Flash Lite
Flex
Font Folio
FrameMaker
FreeHand
HBX
Illustrator
InCopy
InDesign
JRun
Lightroom
LiveCycle
Macromedia
MXML
Omniture
Omniture DataWarehouse
Omniture Discover
Omniture Genesis
Omniture Insight
Omniture SearchCenter
Open Screen Project
Ovation
PageMaker
Photoshop
PostScript
Reader
RoboHelp
Scene7
Shockwave
SiteCatalyst
Soundbooth
Version Cue
128
TABLE OF CONTENTS
SUMMARY OF TRADEMARKS (Continued)
Visual Communicator
All other trademarks are the property of their respective owners.
129
TABLE OF CONTENTS
EXHIBITS
Exhibit | Incorporated by Reference** | Filed | ||||||||
Number | Exhibit Description | Form | Date | Number | Herewith | |||||
3.1 | Amended and Restated Bylaws | 8-K | 1/13/09 | 3.1 | ||||||
3.2 | Restated Certificate of Incorporation of Adobe Systems Incorporated | 10-Q | 7/16/01 | 3.6 | ||||||
3.2.1 | Certificate of Correction of Restated Certificate of Incorporation of Adobe Systems Incorporated | 10-Q | 4/11/03 | 3.6.1 | ||||||
3.3 | Certificate of Designation of Series A Preferred Stock of Adobe Systems Incorporated | 10-Q | 7/08/03 | 3.3 | ||||||
4.1 | Fourth Amended and Restated Rights Agreement between Adobe Systems Incorporated and Computershare Investor Services, LLC | 8-K | 7/03/00 | 1 | ||||||
4.1.1 | Amendment No. 1 to Fourth Amended and Restated Rights Agreement between Adobe Systems Incorporated and Computershare Investor Services, LLC | 8-A/2G/A | 5/23/03 | 7 | ||||||
4.2 | Specimen Common Stock Certificate | S-3 | 1/15/2010 | 4.3 |
| |||||
10.1 | Amended 1994 Performance and Restricted Stock Plan* | 10-Q | 4/4/08 | 10.2 | ||||||
10.2 | Form of Restricted Stock Agreement used in connection with the Amended 1994 Performance and Restricted Stock Plan* | 10-K | 1/23/09 | 10.3 | ||||||
10.3 | 1997 Employee Stock Purchase Plan, as amended* | 10-K | 1/24/08 | 10.5 | ||||||
10.4 | 1996 Outside Directors Stock Option Plan, as amended* | 10-Q | 4/12/06 | 10.6 | ||||||
130
TABLE OF CONTENTS
Exhibit | Incorporated by Reference** | Filed | ||||||||
Number | Exhibit Description | Form | Date | Number | Herewith | |||||
10.5 | Forms of Stock Option Agreements used in connection with the 1996 Outside Directors Stock Option Plan* | S-8 | 6/16/00 | 4.8 | ||||||
10.6 | 1999 Nonstatutory Stock Option Plan, as amended* | S-8 | 10/29/01 | 4.6 | ||||||
10.7 | 1999 Equity Incentive Plan, as amended* | 10-K | 2/26/03 | 10.37 | ||||||
10.8 | 2003 Equity Incentive Plan, as amended and restated* | DEF 14A | 2/20/09 | Appendix A | ||||||
10.9 | Form of Stock Option Agreement used in connection with the 2003 Equity Incentive Plan* | 10-Q | 4/4/08 | 10.11 | ||||||
10.10 | Form of Indemnity Agreement* | 10-Q | 6/26/09 | 10.12 | ||||||
10.11 | Forms of Retention Agreement* | 10-K | 11/28/97 | 10.44 | ||||||
10.12 | Second Amended and Restated Master Lease of Land and Improvements by and between SMBC Leasing and Finance, Inc. and Adobe Systems Incorporated | 10-Q | 10/07/04 | 10.14 | ||||||
10.13 | Lease between Adobe Systems Incorporated and Selco Service Corporation, dated March 26, 2007 | 8-K | 3/28/07 | 10.1 | ||||||
10.14 | Participation Agreement among Adobe Systems Incorporated, Selco Service Corporation, et al. dated March 26, 2007 | 8-K | 3/28/07 | 10.2 | ||||||
10.15 | Form of Restricted Stock Unit Agreement used in connection with the Amended 1994 Performance and Restricted Stock Plan* | 10-K | 1/23/09 | 10.19 |
131
TABLE OF CONTENTS
Exhibit | Incorporated by Reference** | Filed | ||||||||
Number | Exhibit Description | Form | Date | Number | Herewith | |||||
10.16 | Form of Restricted Stock Unit Agreement used in connection with the 2003 Equity Incentive Plan* | 10-K | 1/23/09 | 10.20 | ||||||
10.17 | Form of Restricted Stock Agreement used in connection with the 2003 Equity Incentive Plan* | 10-Q | 10/07/04 | 10.11 | ||||||
10.18 | 2008 Executive Officer Annual Incentive Plan* | 8-K | 1/30/08 | 10.4 | ||||||
10.19 | 2005 Equity Incentive Assumption Plan, as amended and restated* | X | ||||||||
10.20 | Form of Stock Option Agreement used in connection with the 2005 Equity Incentive Assumption Plan* | 10-Q | 4/4/08 | 10.24 | ||||||
10.21 | Allaire Corporation 1997 Stock Incentive Plan* | S-8 | 03/27/01 | 4.06 | ||||||
10.22 | Allaire Corporation 1998 Stock Incentive Plan* | S-8 | 03/27/01 | 4.07 | ||||||
10.23 | Allaire Corporation 2000 Stock Incentive Plan* | S-8 | 03/27/01 | 4.08 | ||||||
10.24 | Andromedia, Inc. 1999 Stock Plan* | S-8 | 12/07/99 | 4.09 | ||||||
10.25 | Blue Sky Software Corporation 1996 Stock Option Plan* | S-8 | 12/29/03 | 4.07 | ||||||
10.26 | Macromedia, Inc. 1999 Stock Option Plan* | S-8 | 08/17/00 | 4.07 | ||||||
10.27 | Macromedia, Inc. 1992 Equity Incentive Plan* | 10-Q | 08/03/01 | 10.01 | ||||||
10.28 | Macromedia, Inc. 2002 Equity Incentive Plan* | S-8 | 08/10/05 | 4.08 | ||||||
10.29 | Form of Macromedia, Inc. Stock Option Agreement* | S-8 | 08/10/05 | 4.09 | ||||||
10.30 | Middlesoft, Inc. 1999 Stock Option Plan* | S-8 | 08/17/00 | 4.09 |
132
TABLE OF CONTENTS
Exhibit | Incorporated by Reference** | Filed | ||||||||
Number | Exhibit Description | Form | Date | Number | Herewith | |||||
10.31 | Form of Macromedia, Inc. Revised Non-Plan Stock Option Agreement* | S-8 | 11/23/04 | 4.10 | ||||||
10.32 | Form of Macromedia, Inc. Restricted Stock Purchase Agreement* | 10-Q | 2/08/05 | 10.01 | ||||||
10.33 | Adobe Systems Incorporated Form of Performance Share Program pursuant to the 2003 Equity Incentive Plan* | 8-K | 1/30/08 | 10.1 | ||||||
10.34 | Form of Award Grant Notice and Performance Share Award Agreement used in connection with grants under the Adobe Systems Incorporated 2008 Performance Share Program pursuant to the 2003 Equity Incentive Plan* | 8-K | 1/30/08 | 10.2 | ||||||
10.35 | 2008 Award Calculation Methodology Exhibit A to the 2008 Performance Share Program pursuant to the 2003 Equity Incentive Plan* | 8-K | 1/30/08 | 10.3 | ||||||
10.36 | Adobe Systems Incorporated Deferred Compensation Plan* | 10-K | 1/24/08 | 10.52 | ||||||
10.37 | Adobe Systems Incorporated 2007 Performance Share Program pursuant to the 2003 Equity Incentive Plan* | 8-K | 1/30/07 | 10.1 | ||||||
10.38 | Form of Award Grant Notice and Performance Share Award Agreement used in connection with grants under the Adobe Systems Incorporated 2007 Performance Share Program pursuant to the 2003 Equity Incentive Plan* | 8-K | 1/30/07 | 10.2 |
133
TABLE OF CONTENTS
Exhibit | Incorporated by Reference** | Filed | ||||||||
Number | Exhibit Description | Form | Date | Number | Herewith | |||||
10.39 | Adobe Systems Incorporated 2007 Performance Share Program pursuant to the Amended 1994 Performance and Restricted Stock Plan* | 8-K | 1/30/07 | 10.3 | ||||||
10.40 | Form of Award Grant Notice and Performance Share Award Agreement used in connection with grants under the Adobe Systems Incorporated 2007 Performance Share Program pursuant to the Amended 1994 Performance and Restricted Stock Plan* | 8-K | 1/30/07 | 10.4 | ||||||
10.41 | Adobe Systems Incorporated Executive Cash Bonus Plan* | DEF 14A | 2/24/06 | Appendix B | ||||||
10.42 | First Amendment to Retention Agreement between Adobe Systems Incorporated and Shantanu Narayen, effective as of February 11, 2008* | 8-K | 2/13/08 | 10.1 | ||||||
10.43 | Adobe Systems Incorporated Executive Severance Plan in the Event of a Change of Control* | 8-K | 2/13/08 | 10.2 | ||||||
10.44 | Employment offer letter between Adobe Systems Incorporated and Richard Rowley, dated October 30, 2006* | 8-K | 11/16/06 | 10.1 | ||||||
10.45 | Employment offer letter between Adobe Systems Incorporated and Mark Garrett dated January 5, 2007* | 8-K | 1/26/07 | 10.1 |
134
TABLE OF CONTENTS
Exhibit | Incorporated by Reference** | Filed | ||||||||
Number | Exhibit Description | Form | Date | Number | Herewith | |||||
10.46 | Credit Agreement, dated as of February 16, 2007, among Adobe Systems Incorporated and Certain Subsidiaries as Borrowers; BNP Paribas, Keybank National Association, and UBS Loan Finance LLC as Co-Documentation Agents; JPMorgan Chase Bank, N.A. as Syndication Agent; Bank of America, N.A. as Administrative Agent and Swing Line Lender; the Other Lenders Party Thereto; and Banc of America Securities LLC and J.P. Morgan Securities Inc. as Joint Lead Arrangers and Joint Book Managers | 8-K | 8/16/07 | 10.1 | ||||||
10.47 | Amendment to Credit Agreement, dated as of August 13, 2007, among Adobe Systems Incorporated, as Borrower; each Lender from time to time party to the Credit Agreement; and Bank of America, N.A. as Administrative Agent | 8-K | 8/16/07 | 10.2 | ||||||
10.48 | Second Amendment to Credit Agreement, dated as of February 26, 2008, among Adobe Systems Incorporated, as Borrower; each Lender from time to time party to the Credit Agreement; and Bank of America, N.A. as Administrative Agent | 8-K | 2/29/08 | 10.1 | ||||||
10.49 | Purchase and Sale Agreement, by and between NP Normandy Overlook, LLC, as Seller and Adobe Systems Incorporated as Buyer, effective as of May 12, 2008 | 8-K | 5/15/08 | 10.1 |
135
TABLE OF CONTENTS
Exhibit | Incorporated by Reference** | Filed | ||||||||
Number | Exhibit Description | Form | Date | Number | Herewith | |||||
10.50 | Form of Director Annual Grant Stock Option Agreement used in connection with the 2003 Equity Incentive Plan* | 10-K | 1/23/09 | 10.60 | ||||||
10.51 | Form of Director Initial Grant Restricted Stock Unit Agreement in connection with the 2003 Equity Incentive Plan* | 10-K | 1/23/09 | 10.61 | ||||||
10.52 | Form of Director Annual Grant Restricted Stock Unit Agreement in connection with the 2003 Equity Incentive Plan* | 10-K | 1/23/09 | 10.62 | ||||||
10.53 | Description of 2009 Director Compensation* | 10-K | 1/23/09 | 10.63 | ||||||
10.54 | 2009 Performance Share Program Award Calculation Methodology* | 8-K | 1/29/09 | 10.3 | ||||||
10.55 | 2009 Executive Annual Incentive Plan* | 8-K | 1/29/09 | 10.4 | ||||||
10.56 | Omniture, Inc. 1999 Equity Incentive Plan, as amended (the "Omniture 1999 Plan")* | S-1 | 4/4/06 | 10.2A | ||||||
10.57 | Forms of Stock Option Agreement under the Omniture 1999 Plan* | S-1 | 4/4/06 | 10.2B | ||||||
10.58 | Form of Stock Option Agreement under the Omniture 1999 Plan used for Named Executive Officers and Non-Employee Directors* | S-1 | 6/9/06 | 10.2C | ||||||
10.59 | Omniture, Inc. 2006 Equity Incentive Plan and related forms* | 10-Q | 08/06/09 | 10.3 | ||||||
10.60 | Omniture, Inc. 2007 Equity Incentive Plan and related forms* | 10-K | 2/27/09 | 10.9 |
136
TABLE OF CONTENTS
Exhibit | Incorporated by Reference** | Filed | ||||||||
Number | Exhibit Description | Form | Date | Number | Herewith | |||||
10.61 | Omniture, Inc. 2008 Equity Incentive Plan and related forms* | 10-K | 2/27/09 | 10.10 | ||||||
10.62 | Visual Sciences, Inc. (formerly, WebSideStory, Inc.) Amended and Restated 2000 Equity Incentive Plan* | 10-K | 2/29/08 | 10.5 | ||||||
10.63 | Visual Sciences, Inc. (formerly, WebSideStory, Inc.) 2004 Equity Incentive Award Plan (the "VS 2004 Plan") and Form of Option Grant Agreement* | 10-K | 2/29/08 | 10.6 | ||||||
10.64 | Form of Restricted Stock Award Grant Notice and Restricted Stock Award Agreement under the VS 2004 Plan* | 10-K | 2/29/08 | 10.6A | ||||||
10.65 | Visual Sciences, Inc. (formerly, WebSideStory, Inc.) 2006 Employment Commencement Equity Incentive Award Plan and Form of Option Grant Agreement* | 10-K | 2/29/08 | 10.8 | ||||||
10.66 | Avivo Corporation 1999 Equity Incentive Plan and Form of Option Grant Agreement* | 10-K | 2/29/08 | 10.7 | ||||||
10.67 | The Touch Clarity Limited Enterprise Management Incentives Share Option Plan 2002* | S-8 | 3/16/07 | 99.5 | ||||||
10.68 | Forms of Agreements under The Touch Clarity Limited Enterprise Management Incentives Share Option Plan 2002* | S-8 | 3/16/07 | 99.6 | ||||||
10.69 | Touch Clarity Limited 2006 U.S. Stock Plan* | S-8 | 3/16/07 | 99.7 |
137
TABLE OF CONTENTS
Exhibit | Incorporated by Reference** | Filed | ||||||||
Number | Exhibit Description | Form | Date | Number | Herewith | |||||
10.70 | Form of Stock Option Agreement under Touch Clarity Limited 2006 U.S. Stock Plan* | S-8 | 3/16/07 | 99.8 | ||||||
10.71 | Description of 2010 Director Compensation* | X | ||||||||
21 | Subsidiaries of the Registrant | X | ||||||||
23.1 | Consent of Independent Registered Public Accounting Firm, KPMG LLP | X | ||||||||
24.1 | Power of Attorney (set forth on the signature page to this Annual Report on Form 10-K) | X | ||||||||
31.1 | Certification of Chief Executive Officer, as required by Rule 13a-14(a) of the Securities Exchange Act of 1934 | X | ||||||||
31.2 | Certification of Chief Financial Officer, as required by Rule 13a-14(a) of the Securities Exchange Act of 1934 | X | ||||||||
32.1 | Certification of Chief Executive Officer, as required by Rule 13a-14(b) of the Securities Exchange Act of 1934† | X | ||||||||
32.2 | Certification of Chief Financial Officer, as required by Rule 13a-14(b) of the Securities Exchange Act of 1934† | X | ||||||||
101.INS | XBRL Instance†† | X | ||||||||
101.SCH | XBRL Taxonomy Extension Schema†† | X | ||||||||
101.CAL | XBRL Taxonomy Extension Calculation†† | X |
138
TABLE OF CONTENTS
Exhibit | Incorporated by Reference** | Filed | ||||||||
Number | Exhibit Description | Form | Date | Number | Herewith | |||||
101.LAB | XBRL Taxonomy Extension Labels†† | X | ||||||||
101.PRE | XBRL Taxonomy Extension Presentation†† | X | ||||||||
101.DEF | XBRL Taxonomy Extension Definition†† | X |
_________________________________________
* | Compensatory plan or arrangement. |
** | References to Exhibits 10.21 through 10.32 are to filings made by Macromedia, Inc. |
*** | References to Exhibits 10.56 through 10.70 are to filings made by Omniture, Inc. |
† | The certifications attached as Exhibits 32.1 and 32.2 that accompany this Annual Report on Form 10-K, are not deemed filed with the Securities and Exchange Commission and are not to be incorporated by reference into any filing of Adobe Systems Incorporated under the Securities Act of 1933, as amended, or the Securities Exchange Act of 1934, as amended, whether made before or after the date of this Form 10-K, irrespective of any general incorporation language contained in such filing. |
†† | Furnished, not filed. |
139